| Param | Original file | Final file |
|---|---|---|
| Filename | modeM0/AS1A02_029T01_9000001058_07680cztM0_level2.evt | modeM0/AS1A02_029T01_9000001058_07680cztM0_level2_quad_clean.evt |
| Size (bytes) | 1,219,944,960 | 155,433,600 |
| Size | 1.1 GB | 148.2 MB |
| Events in quadrant A | 5,768,314 | 993,822 |
| Events in quadrant B | 6,424,549 | 1,006,781 |
| Events in quadrant C | 16,876,870 | 889,121 |
| Events in quadrant D | 7,025,521 | 944,285 |
| Mode M9 | |||
|---|---|---|---|
| Quadrant | BADHDUFLAG | Total packets | Discarded packets |
| A | 0 | 13 | 0 |
| B | 0 | 13 | 0 |
| C | 0 | 13 | 0 |
| D | 0 | 14 | 0 |
| Mode M0 | |||
|---|---|---|---|
| Quadrant | BADHDUFLAG | Total packets | Discarded packets |
| A | 0 | 25724 | 3 |
| B | 0 | 27479 | 3 |
| C | 0 | 58964 | 3 |
| D | 0 | 29509 | 3 |
| Mode SS | |||
|---|---|---|---|
| Quadrant | BADHDUFLAG | Total packets | Discarded packets |
| A | 0 | 258 | 0 |
| B | 0 | 258 | 0 |
| C | 0 | 258 | 0 |
| D | 0 | 258 | 0 |
| Quadrant | Total seconds | Saturated seconds | Saturation percentage |
|---|---|---|---|
| A | 12622 | 58 | 0.459515% |
| B | 12622 | 160 | 1.267628% |
| C | 12622 | 2598 | 20.583109% |
| D | 12622 | 192 | 1.521154% |
Noise dominated data is calculated using 1-second bins in cleaned event files. If a bin has >2000 counts, and if more than 50% of those come from <1% of pixels, then it is considered to be noise-dominated and hence unusable.
| Quadrant | # 1 sec bins | Bins with >0 counts | Bins with >2000 counts | High rate bins dominated by noise | Noise dominated (total time) | Noise dominated (detector-on time) | Marked lightcurve |
|---|---|---|---|---|---|---|---|
| A | 13997 | 12625 | 2 | 2 | 0.01% | 0.02% | 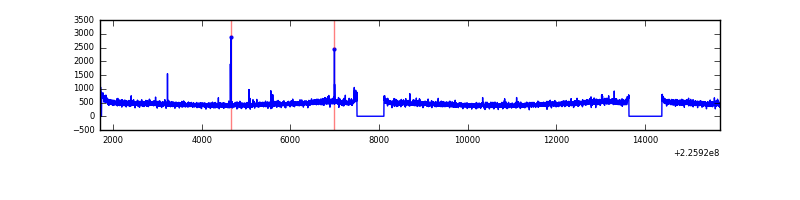 |
| B | 13997 | 12625 | 55 | 55 | 0.39% | 0.44% |  |
| C | 13997 | 12625 | 2169 | 2169 | 15.50% | 17.18% | 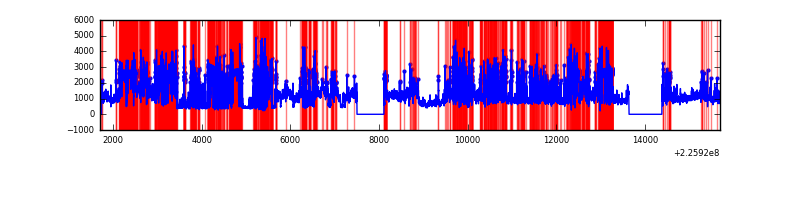 |
| D | 13997 | 12625 | 115 | 115 | 0.82% | 0.91% | 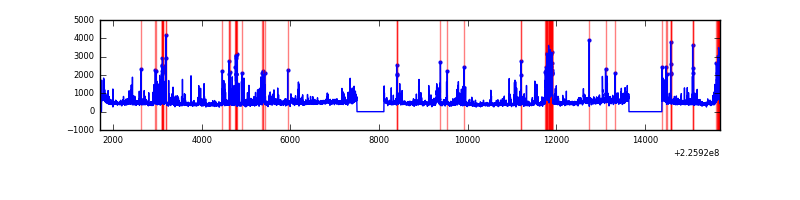 |
Top three noisy pixels from each quadrant. If the there are fewer than three noisy pixels in the level2.evt file, extra rows are filled as -1
| Pixel properties | Quadrant properties | ||||||
|---|---|---|---|---|---|---|---|
| Quadrant | DetID | PixID | Counts | Sigma | Mean | Median | Sigma |
| A | 13 | 248 | 16243 | 48.89 | 1483 | 1450 | 302.6 |
| A | 0 | 226 | 14466 | 43.02 | 1483 | 1450 | 302.6 |
| A | 0 | 254 | 13830 | 40.91 | 1483 | 1450 | 302.6 |
| B | 4 | 239 | 269904 | 944.21 | 1494 | 1459 | 284.3 |
| B | 0 | 219 | 184707 | 644.54 | 1494 | 1459 | 284.3 |
| B | 0 | 214 | 69732 | 240.14 | 1494 | 1459 | 284.3 |
| C | 9 | 68 | 11592833 | 38106.22 | 1313 | 1319 | 304.2 |
| C | 8 | 208 | 61587 | 198.13 | 1313 | 1319 | 304.2 |
| C | 1 | 3 | 51082 | 163.59 | 1313 | 1319 | 304.2 |
| D | 2 | 152 | 424763 | 1200.67 | 1438 | 1391 | 352.6 |
| D | 2 | 136 | 300818 | 849.16 | 1438 | 1391 | 352.6 |
| D | 12 | 0 | 278741 | 786.55 | 1438 | 1391 | 352.6 |
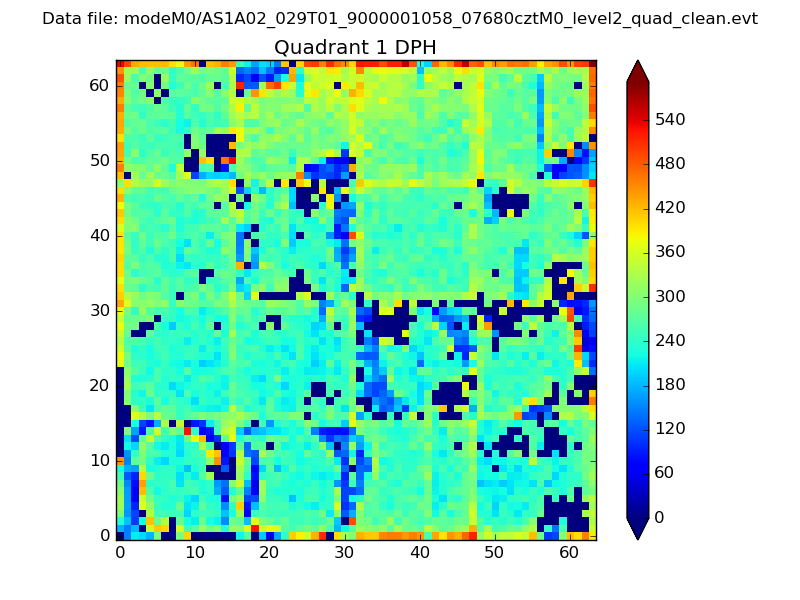
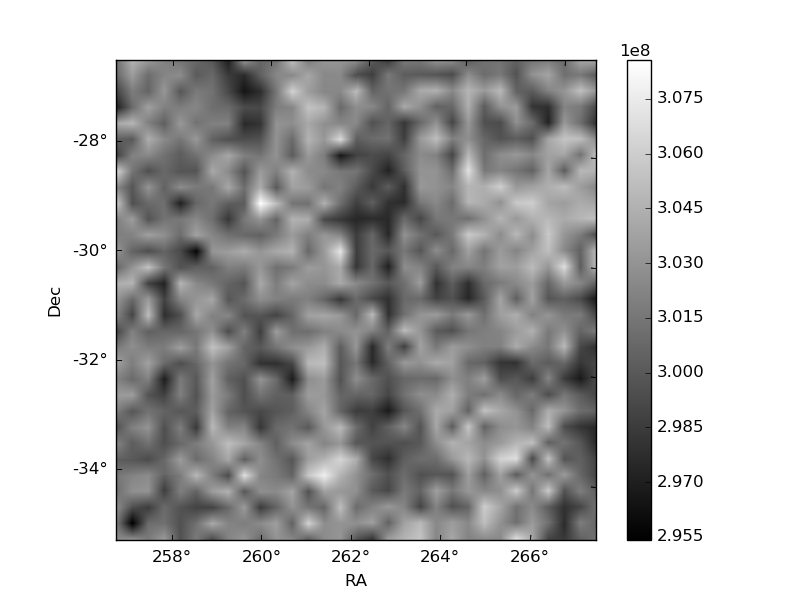
Histogram calculated using DETX and DETY for each event in the final _common_clean file
| Quadrant A | 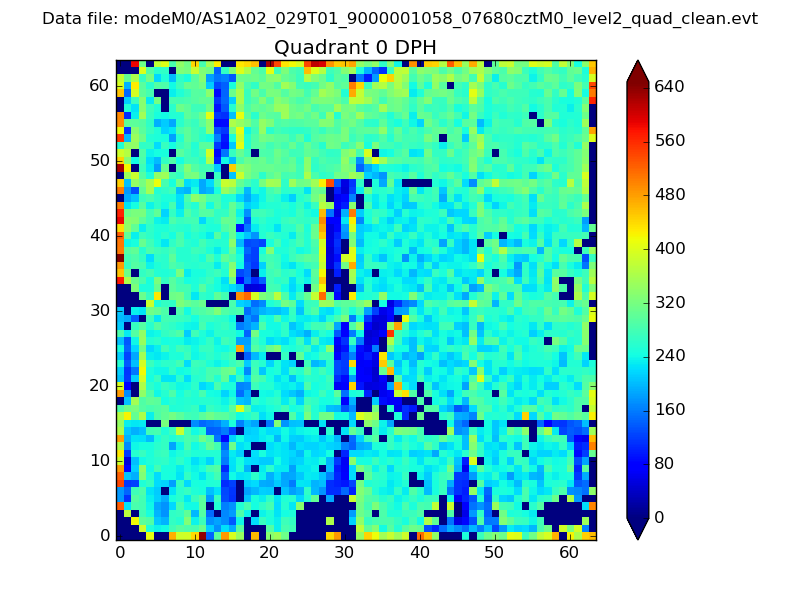 |
 |
Quadrant B |
|---|---|---|---|
| Quadrant D | 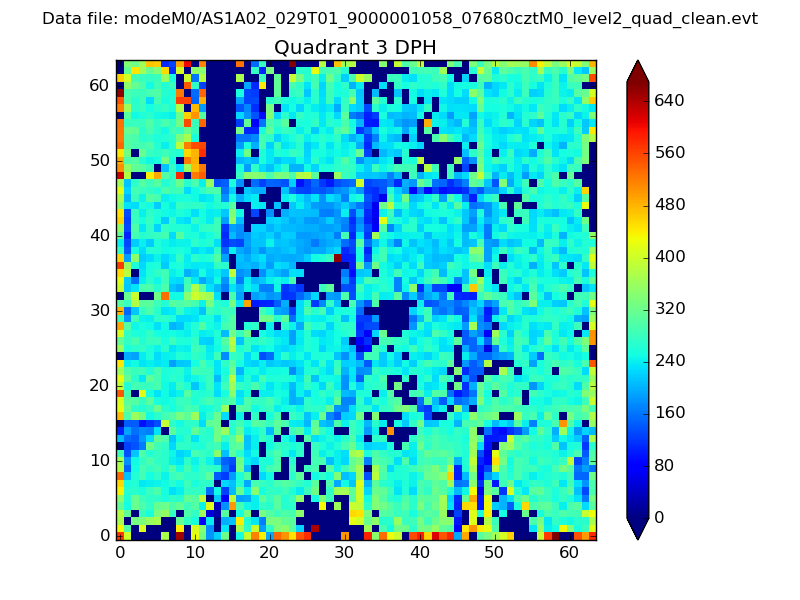 |
 |
Quadrant C |
| Plot type | Count rate plots | Images |
|---|---|---|
| Comparison with Poisson distribution Blue bars denote a histogram of data divided into 1 sec bins. Red curve is a Poisson curve with rate = median count rate of data. |
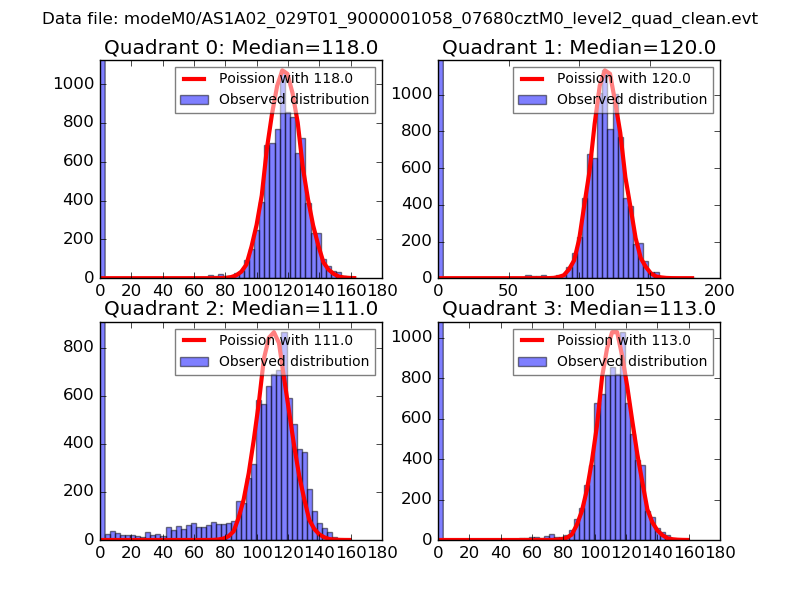 |
 |
| Quadrant-wise count rates Data is divided into 100 sec bins |
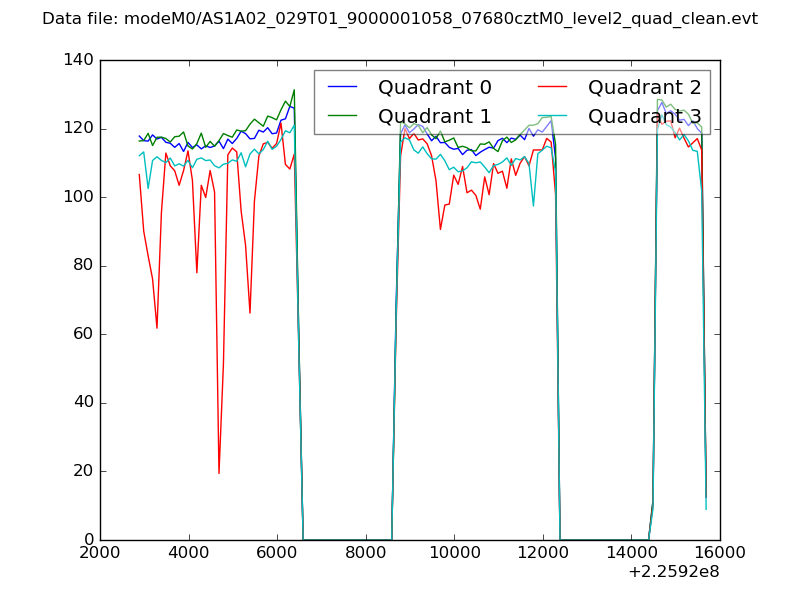 |
|
| Module-wise count rates for Quadrant A Data is divided into 100 sec bins |
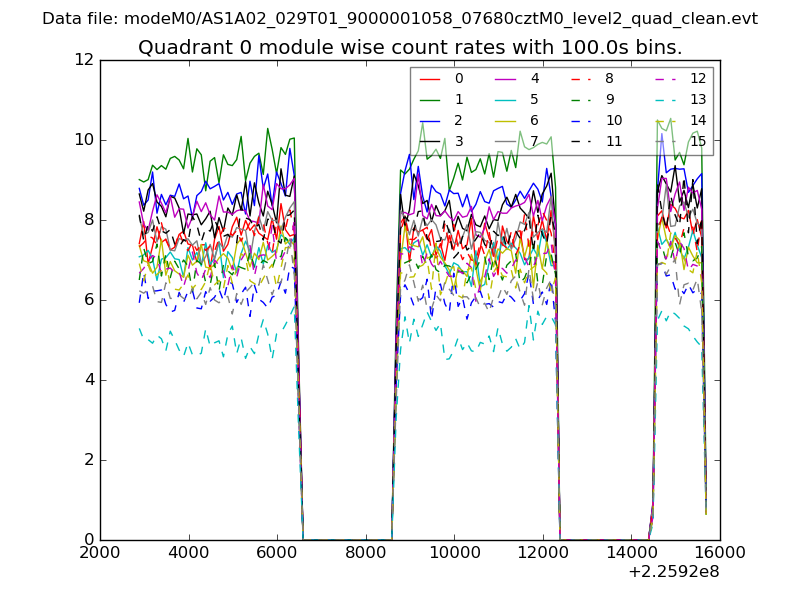 |
 |
| Module-wise count rates for Quadrant B Data is divided into 100 sec bins |
 |
 |
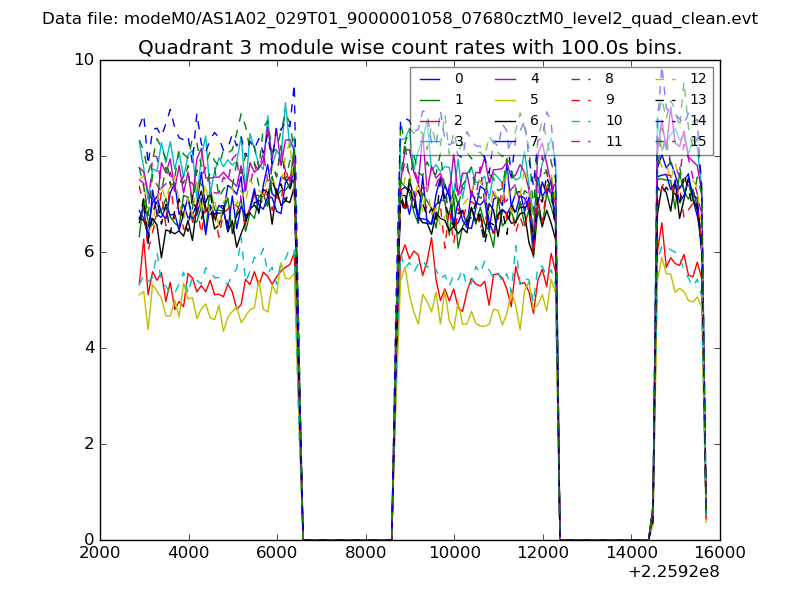
| Module-wise count rates for Quadrant C Data is divided into 100 sec bins |
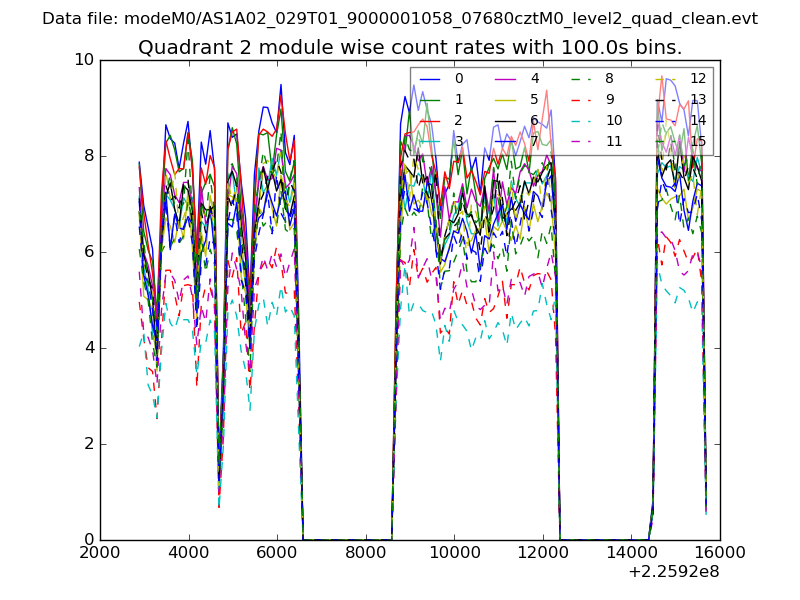 |
 |
| Module-wise count rates for Quadrant D Data is divided into 100 sec bins |
 |
 |
| Parameter | Plot |
|---|---|
| CZT HV Monitor | 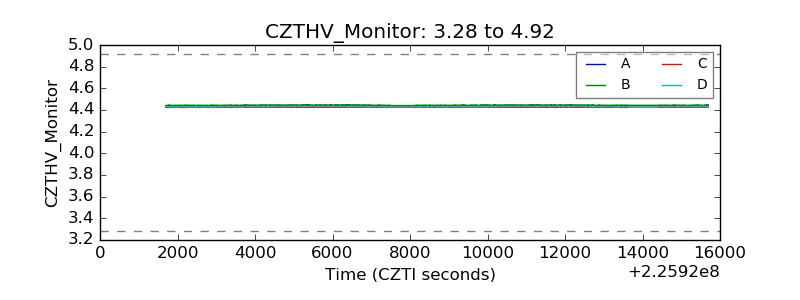 |
| D_VDD | 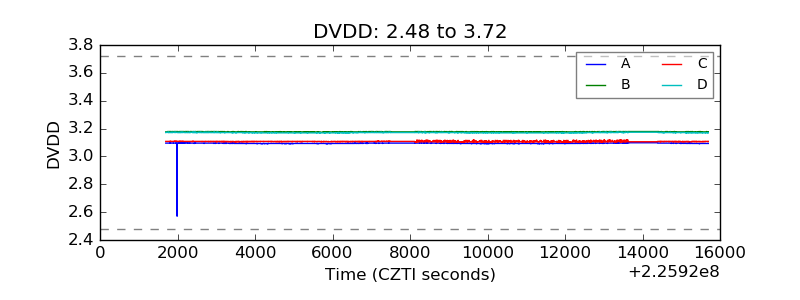 |
| Temperature 1 | 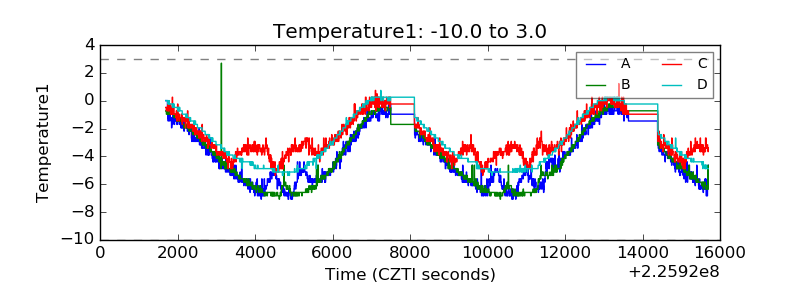 |
| Veto HV Monitor |  |
| Veto LLD | 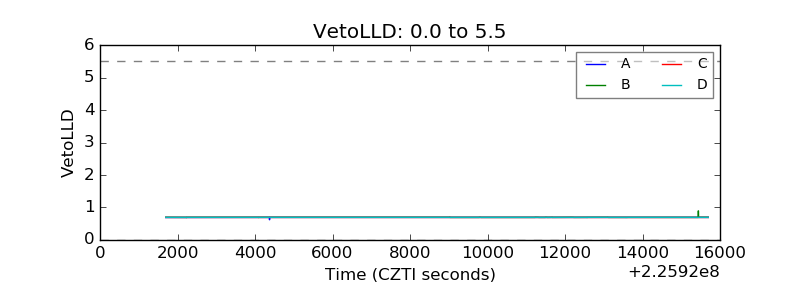 |
| Alpha Counter | 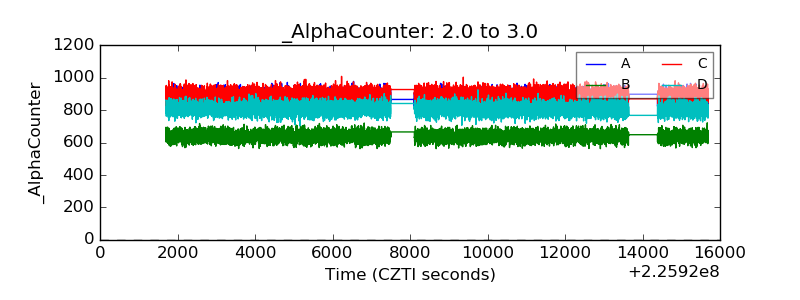 |
| _CPM_Rate | 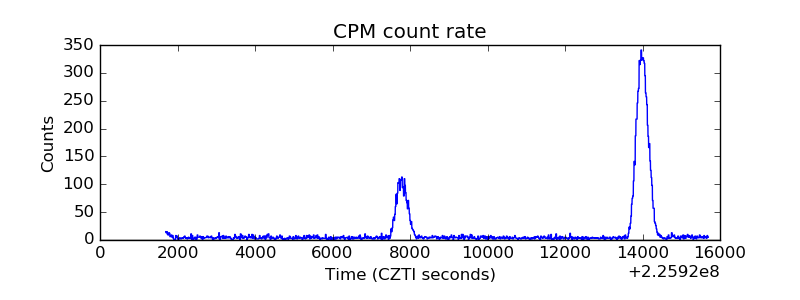 |
| CZT Counter |  |
| +2.5 Volts monitor |  |
| +5 Volts monitor | 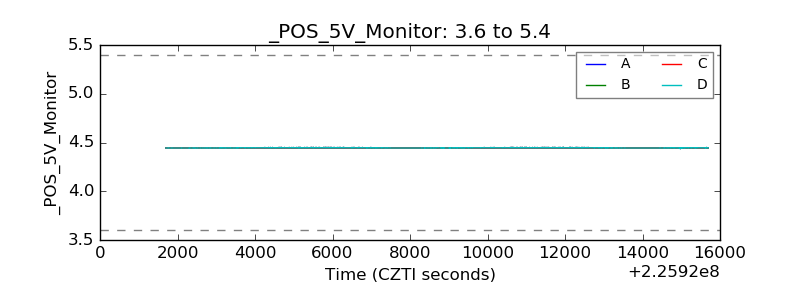 |
| _ROLL_ROT | 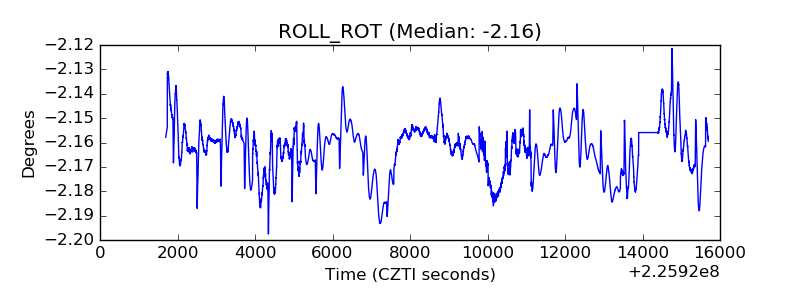 |
| _Roll_DEC | 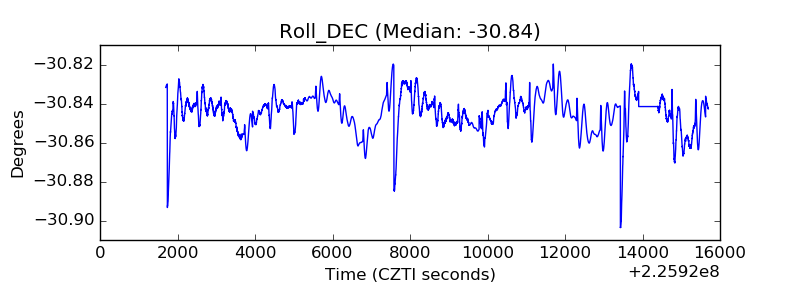 |
| _Roll_RA |  |
| Veto Counter | 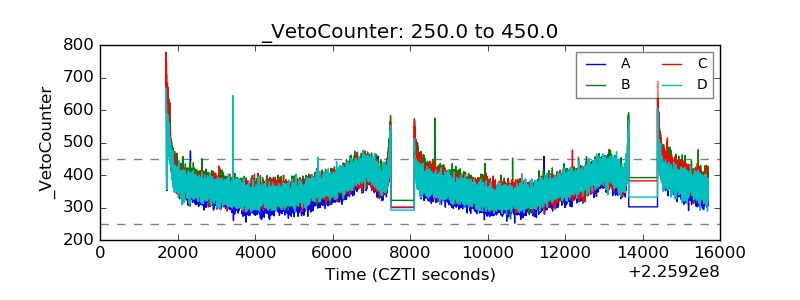 |