| Param | Original file | Final file |
|---|---|---|
| Filename | modeM0/AS1G06_104T01_9000001060_07680cztM0_level2.evt | modeM0/AS1G06_104T01_9000001060_07680cztM0_level2_quad_clean.evt |
| Size (bytes) | 255,193,920 | 35,579,520 |
| Size | 243.4 MB | 33.9 MB |
| Events in quadrant A | 1,210,220 | 226,856 |
| Events in quadrant B | 1,253,221 | 232,902 |
| Events in quadrant C | 3,612,185 | 202,686 |
| Events in quadrant D | 1,458,221 | 211,042 |
| Mode SS | |||
|---|---|---|---|
| Quadrant | BADHDUFLAG | Total packets | Discarded packets |
| A | 0 | 58 | 0 |
| B | 0 | 58 | 0 |
| C | 0 | 58 | 0 |
| D | 0 | 58 | 0 |
| Mode M0 | |||
|---|---|---|---|
| Quadrant | BADHDUFLAG | Total packets | Discarded packets |
| A | 0 | 5694 | 1 |
| B | 0 | 5750 | 0 |
| C | 0 | 12733 | 0 |
| D | 0 | 6380 | 0 |
| Quadrant | Total seconds | Saturated seconds | Saturation percentage |
|---|---|---|---|
| A | 2843 | 3 | 0.105522% |
| B | 2843 | 0 | 0.000000% |
| C | 2843 | 295 | 10.376363% |
| D | 2843 | 14 | 0.492438% |
Noise dominated data is calculated using 1-second bins in cleaned event files. If a bin has >2000 counts, and if more than 50% of those come from <1% of pixels, then it is considered to be noise-dominated and hence unusable.
| Quadrant | # 1 sec bins | Bins with >0 counts | Bins with >2000 counts | High rate bins dominated by noise | Noise dominated (total time) | Noise dominated (detector-on time) | Marked lightcurve |
|---|---|---|---|---|---|---|---|
| A | 2843 | 2843 | 0 | 0 | 0.00% | 0.00% |  |
| B | 2843 | 2843 | 0 | 0 | 0.00% | 0.00% |  |
| C | 2843 | 2843 | 288 | 288 | 10.13% | 10.13% | 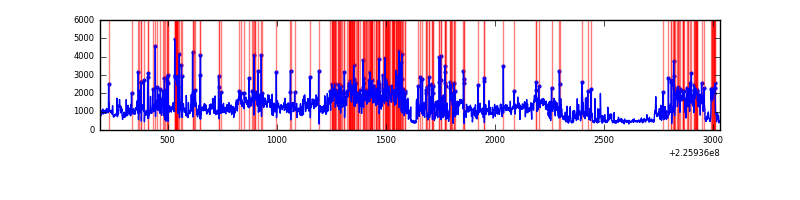 |
| D | 2843 | 2843 | 9 | 9 | 0.32% | 0.32% | 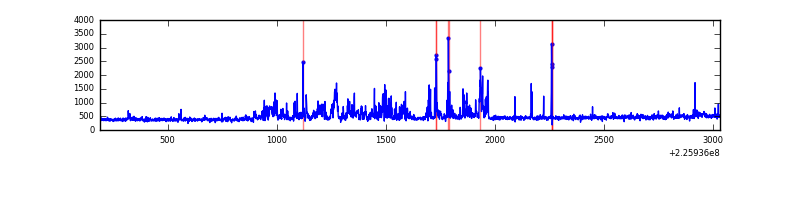 |
Top three noisy pixels from each quadrant. If the there are fewer than three noisy pixels in the level2.evt file, extra rows are filled as -1
| Pixel properties | Quadrant properties | ||||||
|---|---|---|---|---|---|---|---|
| Quadrant | DetID | PixID | Counts | Sigma | Mean | Median | Sigma |
| A | 0 | 226 | 2956 | 40.77 | 313 | 307 | 65.0 |
| A | 12 | 194 | 2876 | 39.54 | 313 | 307 | 65.0 |
| A | 3 | 1 | 2434 | 32.74 | 313 | 307 | 65.0 |
| B | 0 | 214 | 18917 | 303.28 | 314 | 306 | 61.4 |
| B | 0 | 219 | 7073 | 110.27 | 314 | 306 | 61.4 |
| B | 12 | 111 | 5962 | 92.17 | 314 | 306 | 61.4 |
| C | 9 | 68 | 2446019 | 35265.56 | 296 | 298 | 69.4 |
| C | 8 | 208 | 6447 | 88.66 | 296 | 298 | 69.4 |
| C | 13 | 61 | 2258 | 28.26 | 296 | 298 | 69.4 |
| D | 2 | 152 | 154179 | 2013.95 | 308 | 298 | 76.4 |
| D | 2 | 136 | 115594 | 1508.96 | 308 | 298 | 76.4 |
| D | 5 | 233 | 12326 | 157.42 | 308 | 298 | 76.4 |
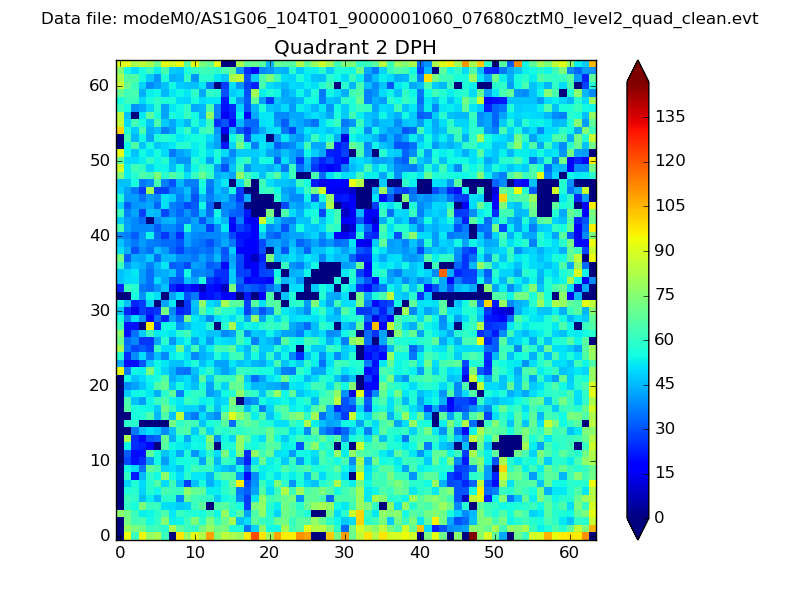
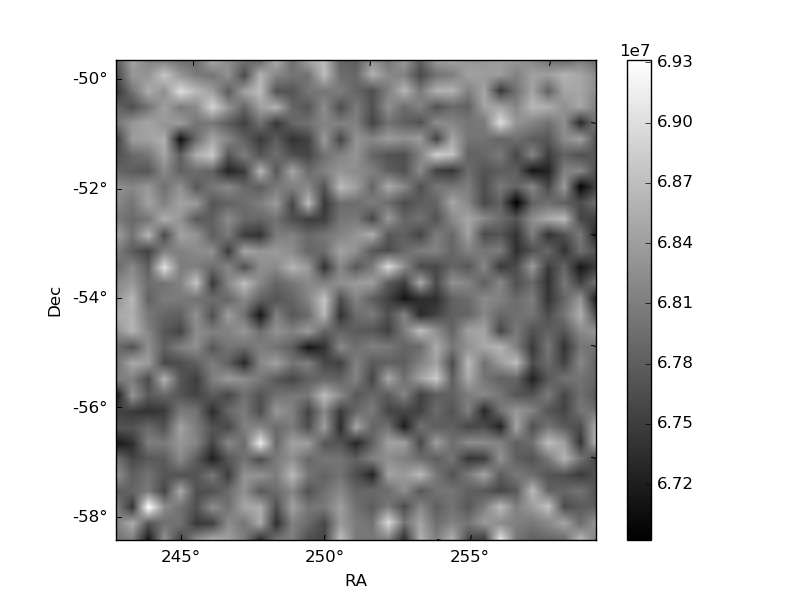
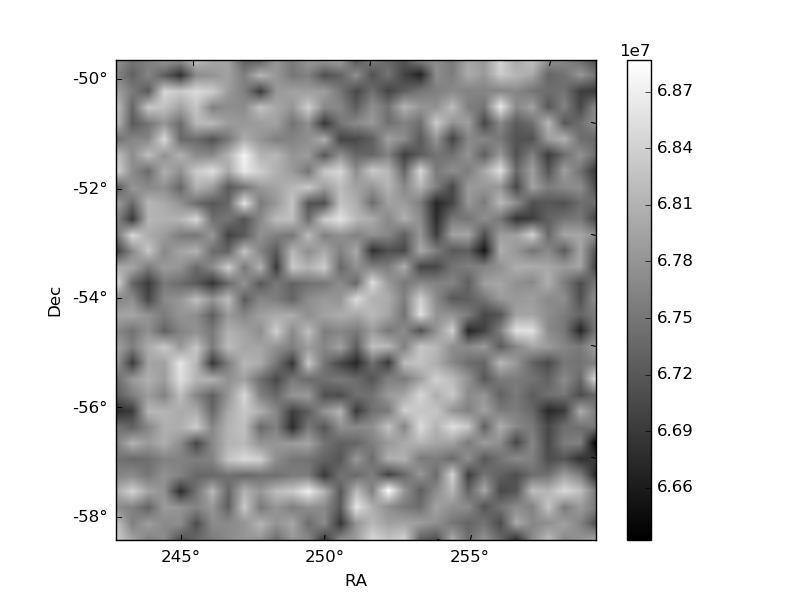
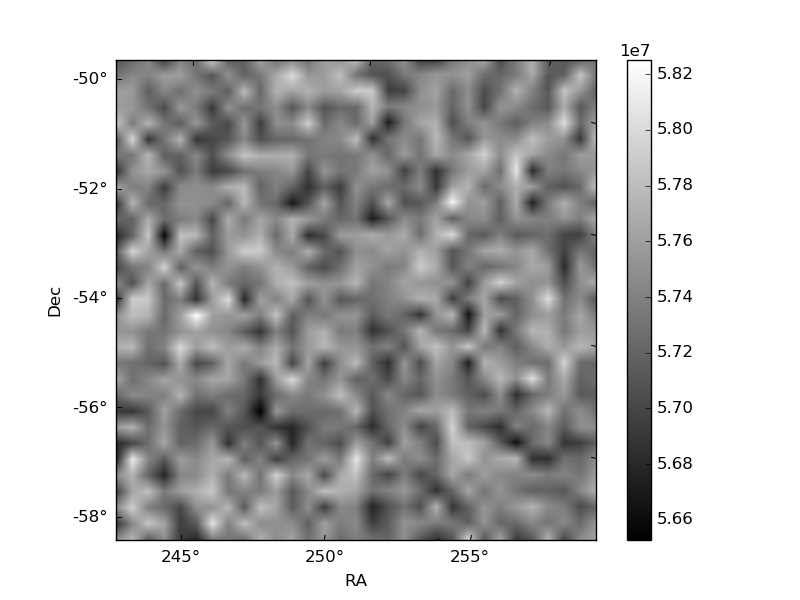
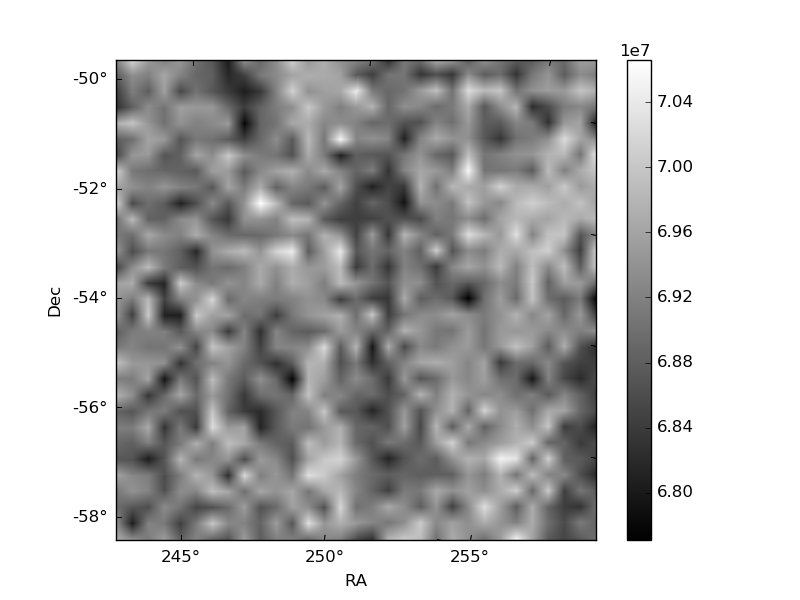
Histogram calculated using DETX and DETY for each event in the final _common_clean file
| Quadrant A | 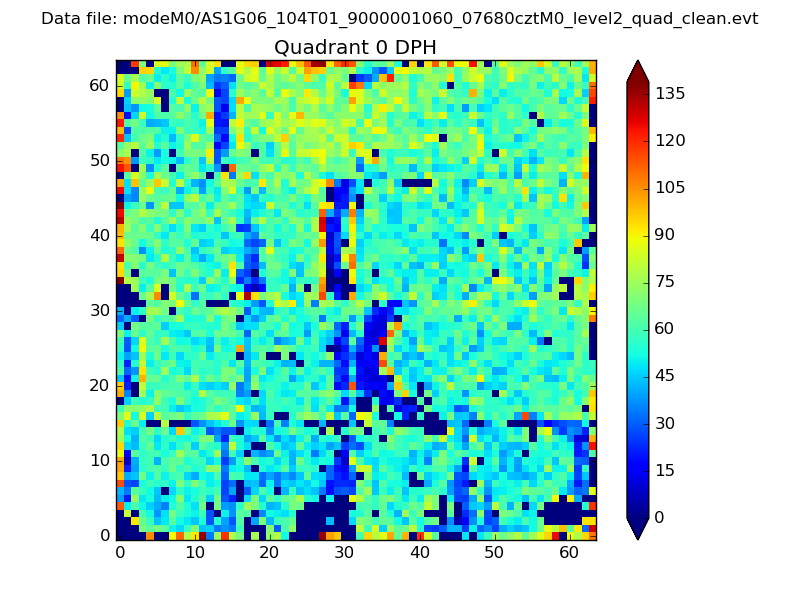 |
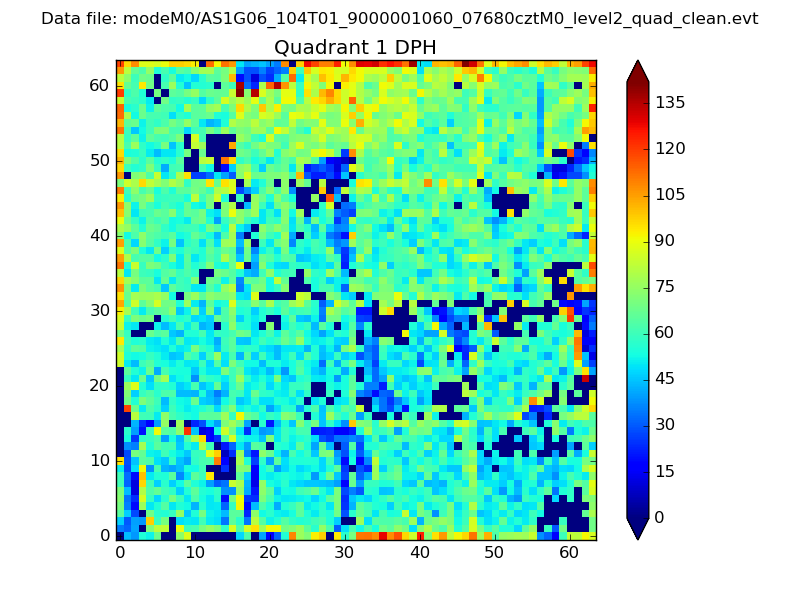 |
Quadrant B |
|---|---|---|---|
| Quadrant D | 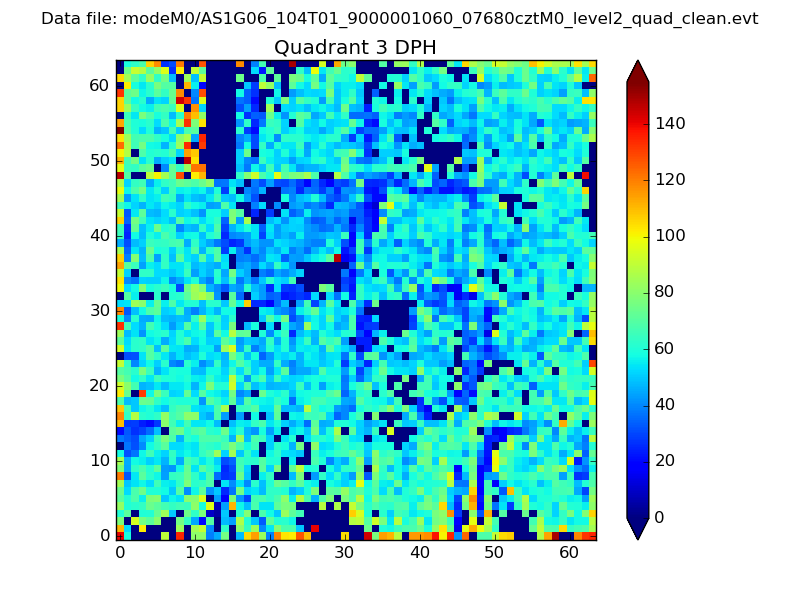 |
 |
Quadrant C |
| Plot type | Count rate plots | Images |
|---|---|---|
| Comparison with Poisson distribution Blue bars denote a histogram of data divided into 1 sec bins. Red curve is a Poisson curve with rate = median count rate of data. |
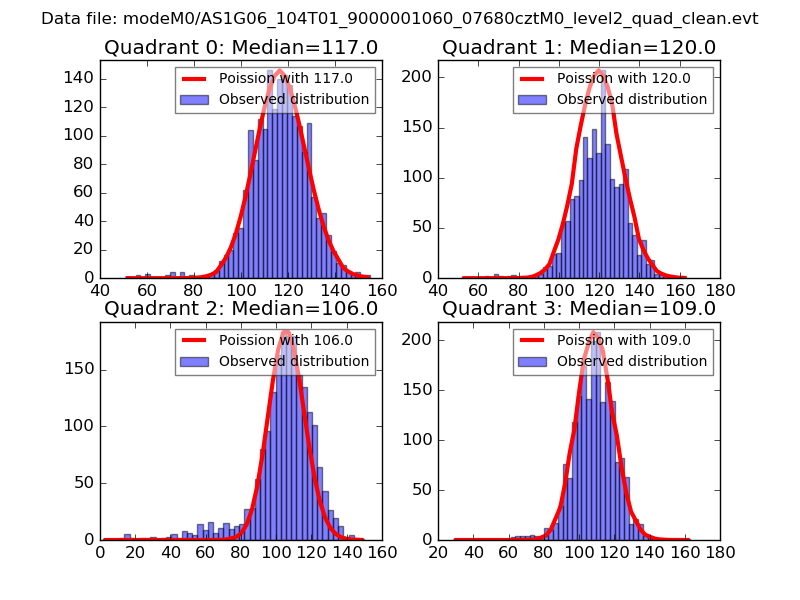 |
 |
| Quadrant-wise count rates Data is divided into 100 sec bins |
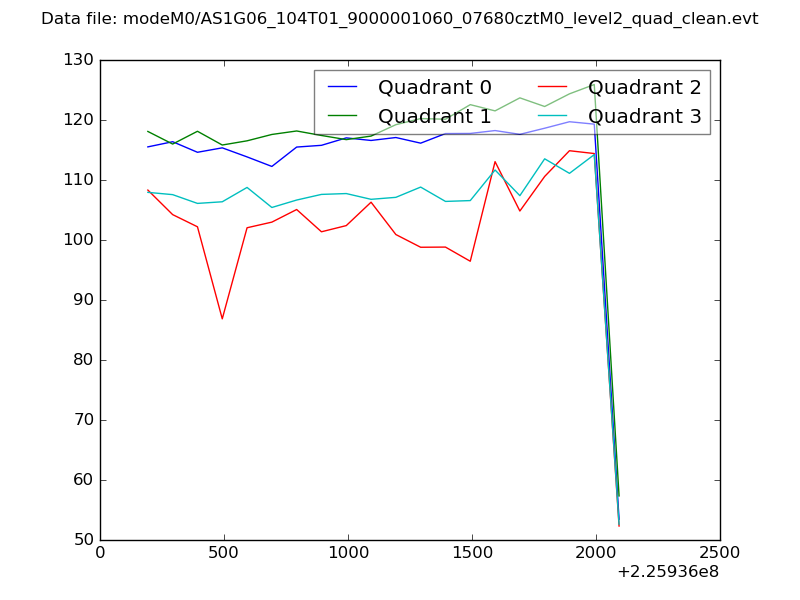 |
|
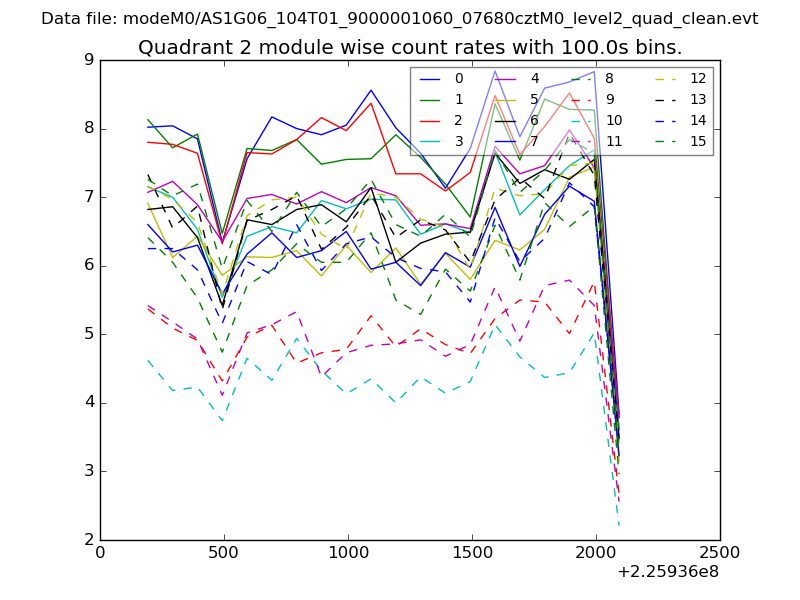
| Module-wise count rates for Quadrant A Data is divided into 100 sec bins |
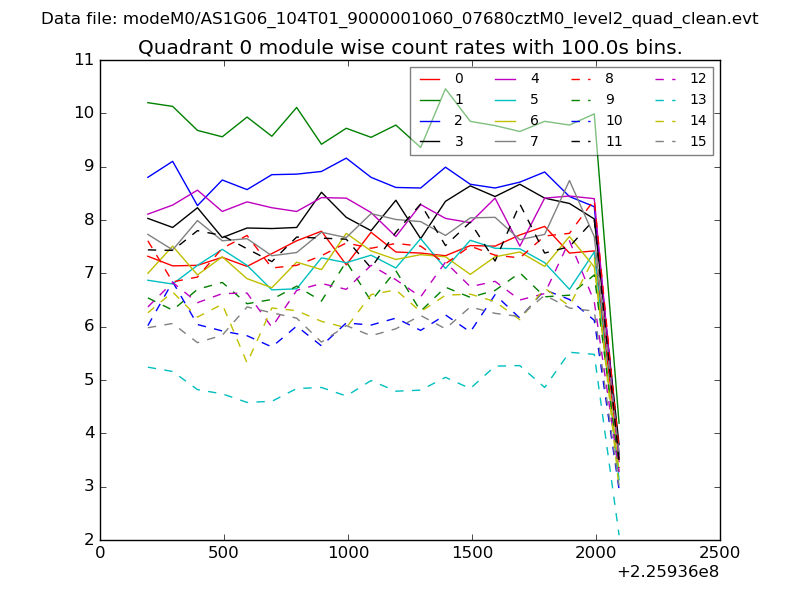 |
 |
| Module-wise count rates for Quadrant B Data is divided into 100 sec bins |
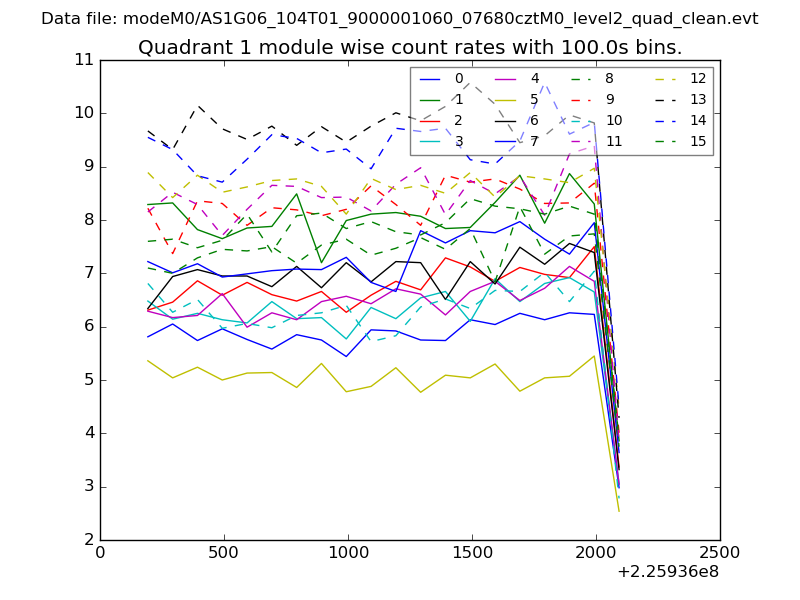 |
 |
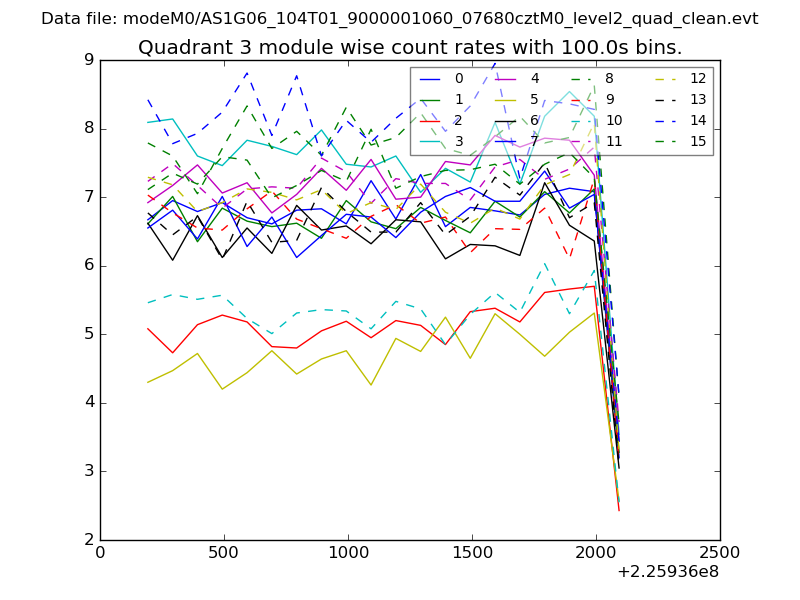
| Module-wise count rates for Quadrant C Data is divided into 100 sec bins |
 |
 |
| Module-wise count rates for Quadrant D Data is divided into 100 sec bins |
 |
 |
| Parameter | Plot |
|---|---|
| CZT HV Monitor | 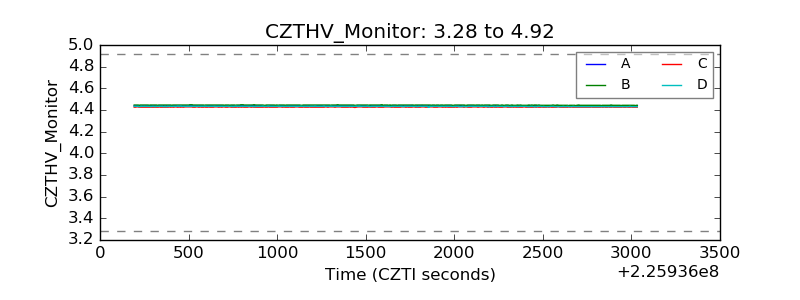 |
| D_VDD | 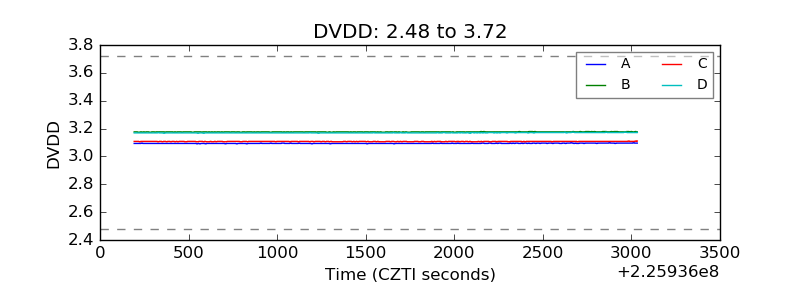 |
| Temperature 1 | 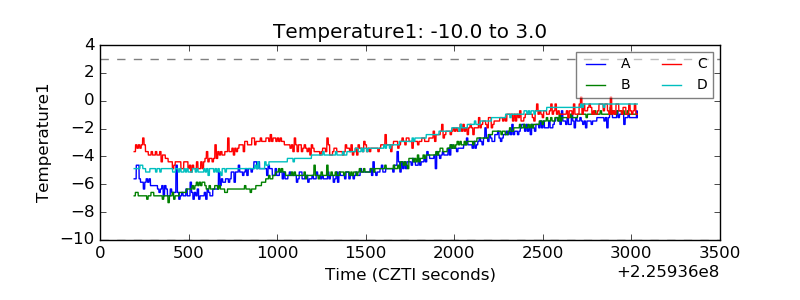 |
| Veto HV Monitor | 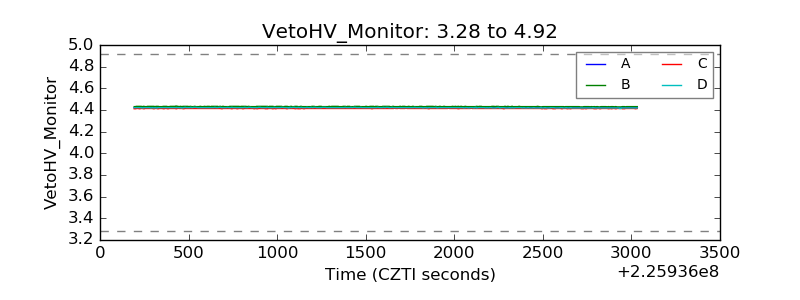 |
| Veto LLD | 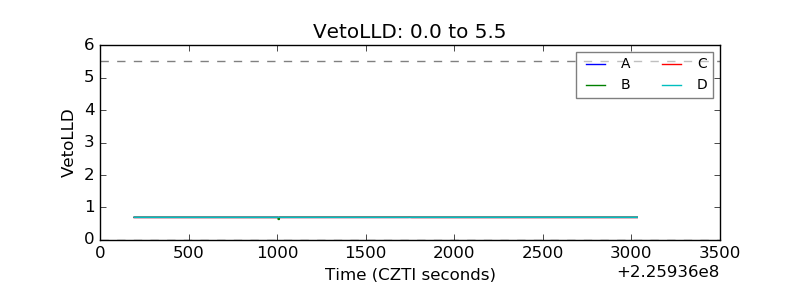 |
| Alpha Counter | 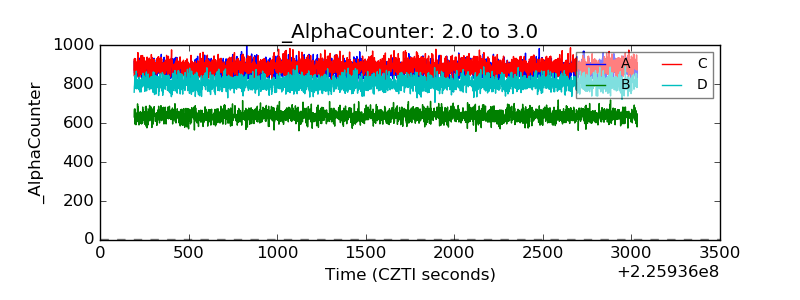 |
| _CPM_Rate | 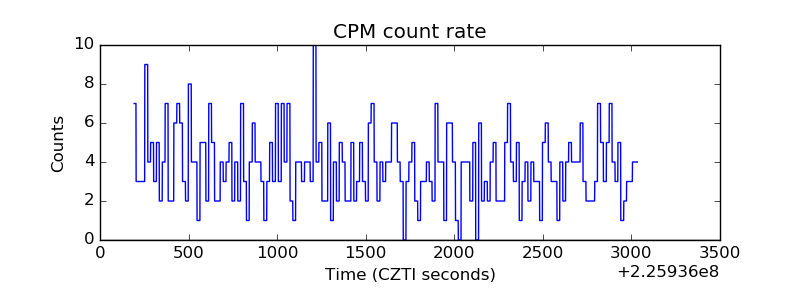 |
| CZT Counter | 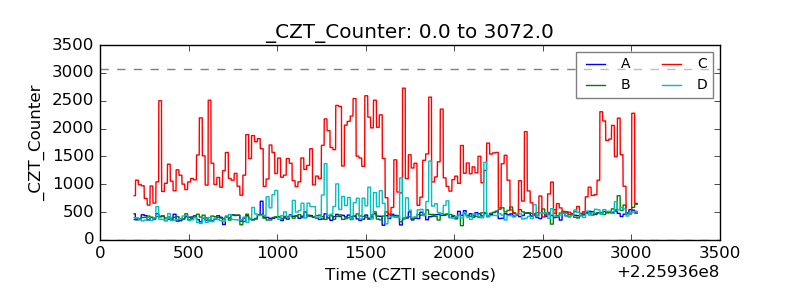 |
| +2.5 Volts monitor |  |
| +5 Volts monitor |  |
| _ROLL_ROT | 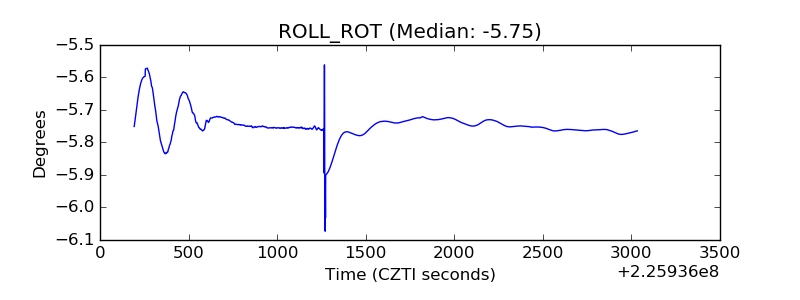 |
| _Roll_DEC | 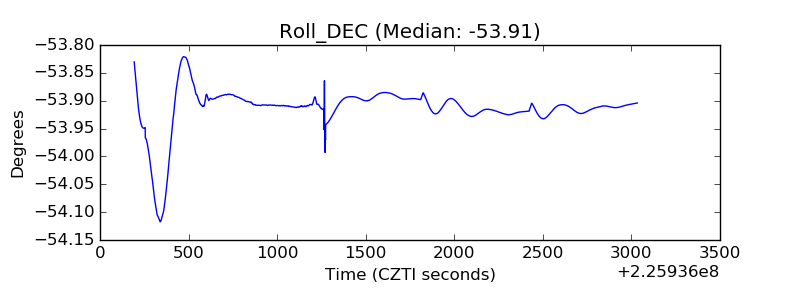 |
| _Roll_RA | 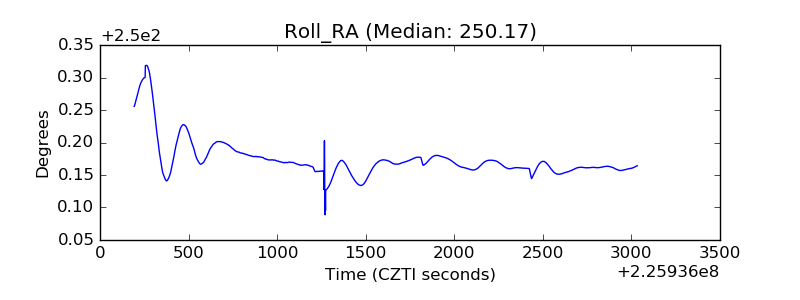 |
| Veto Counter | 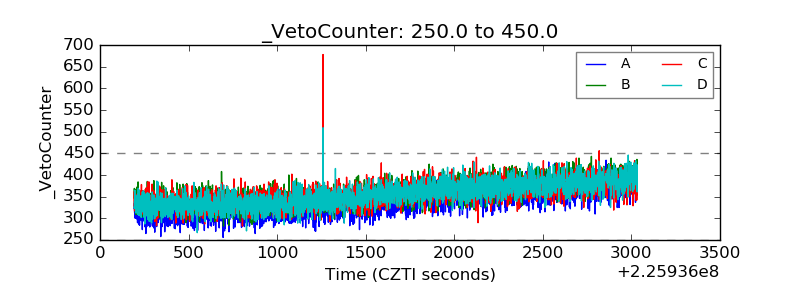 |