| Param | Original file | Final file |
|---|---|---|
| Filename | modeM0/AS1G06_104T01_9000001060_07681cztM0_level2.evt | modeM0/AS1G06_104T01_9000001060_07681cztM0_level2_quad_clean.evt |
| Size (bytes) | 760,495,680 | 94,754,880 |
| Size | 725.3 MB | 90.4 MB |
| Events in quadrant A | 3,598,459 | 603,019 |
| Events in quadrant B | 3,768,905 | 618,898 |
| Events in quadrant C | 10,635,866 | 546,966 |
| Events in quadrant D | 4,504,290 | 561,667 |
| Mode SS | |||
|---|---|---|---|
| Quadrant | BADHDUFLAG | Total packets | Discarded packets |
| A | 0 | 160 | 0 |
| B | 0 | 160 | 0 |
| C | 0 | 160 | 0 |
| D | 0 | 160 | 0 |
| Mode M9 | |||
|---|---|---|---|
| Quadrant | BADHDUFLAG | Total packets | Discarded packets |
| A | 0 | 19 | 0 |
| B | 0 | 19 | 0 |
| C | 0 | 19 | 0 |
| D | 0 | 19 | 0 |
| Mode M0 | |||
|---|---|---|---|
| Quadrant | BADHDUFLAG | Total packets | Discarded packets |
| A | 0 | 15792 | 3 |
| B | 0 | 16148 | 2 |
| C | 0 | 36876 | 2 |
| D | 0 | 18545 | 2 |
| Quadrant | Total seconds | Saturated seconds | Saturation percentage |
|---|---|---|---|
| A | 7741 | 32 | 0.413383% |
| B | 7741 | 61 | 0.788012% |
| C | 7741 | 2687 | 34.711278% |
| D | 7741 | 124 | 1.601860% |
Noise dominated data is calculated using 1-second bins in cleaned event files. If a bin has >2000 counts, and if more than 50% of those come from <1% of pixels, then it is considered to be noise-dominated and hence unusable.
| Quadrant | # 1 sec bins | Bins with >0 counts | Bins with >2000 counts | High rate bins dominated by noise | Noise dominated (total time) | Noise dominated (detector-on time) | Marked lightcurve |
|---|---|---|---|---|---|---|---|
| A | 9686 | 7743 | 0 | 0 | 0.00% | 0.00% | 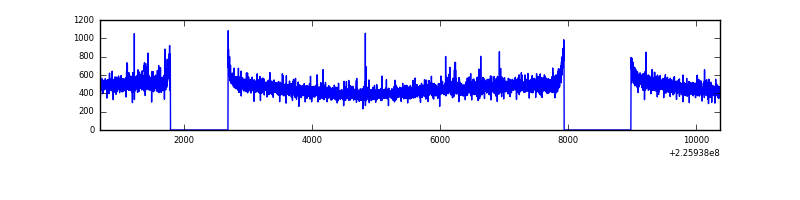 |
| B | 9686 | 7743 | 2 | 2 | 0.02% | 0.03% | 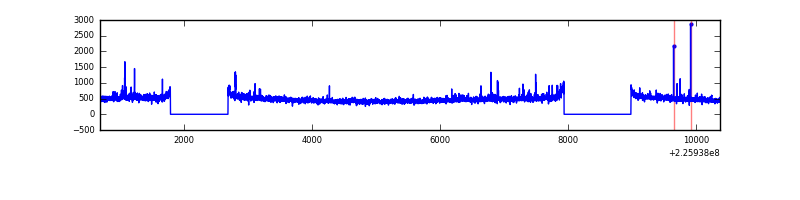 |
| C | 9686 | 7743 | 2282 | 2282 | 23.56% | 29.47% | 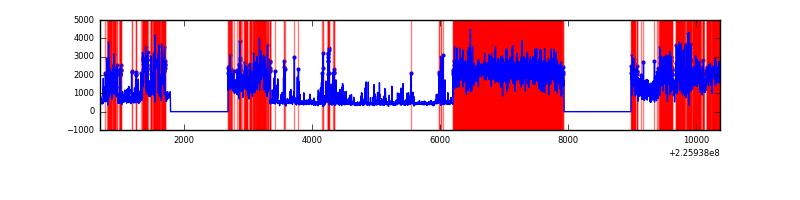 |
| D | 9686 | 7743 | 53 | 53 | 0.55% | 0.68% | 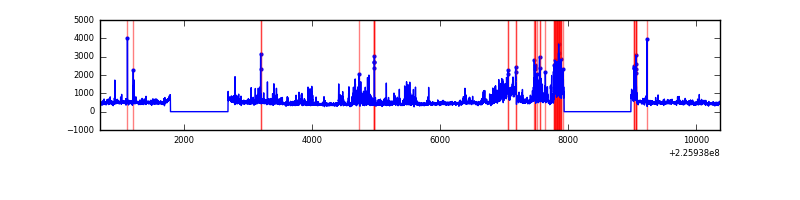 |
Top three noisy pixels from each quadrant. If the there are fewer than three noisy pixels in the level2.evt file, extra rows are filled as -1
| Pixel properties | Quadrant properties | ||||||
|---|---|---|---|---|---|---|---|
| Quadrant | DetID | PixID | Counts | Sigma | Mean | Median | Sigma |
| A | 0 | 128 | 10942 | 53.33 | 927 | 905 | 188.2 |
| A | 13 | 248 | 10010 | 48.37 | 927 | 905 | 188.2 |
| A | 0 | 226 | 8715 | 41.49 | 927 | 905 | 188.2 |
| B | 0 | 219 | 42657 | 235.4 | 939 | 917 | 177.3 |
| B | 4 | 239 | 18997 | 101.96 | 939 | 917 | 177.3 |
| B | 0 | 214 | 17070 | 91.1 | 939 | 917 | 177.3 |
| C | 9 | 68 | 7421561 | 39019.63 | 818 | 820 | 190.2 |
| C | 12 | 4 | 8500 | 40.38 | 818 | 820 | 190.2 |
| C | 13 | 61 | 6234 | 28.47 | 818 | 820 | 190.2 |
| D | 2 | 152 | 714155 | 3211.89 | 903 | 876 | 222.1 |
| D | 2 | 136 | 156412 | 700.38 | 903 | 876 | 222.1 |
| D | 1 | 83 | 92917 | 414.46 | 903 | 876 | 222.1 |
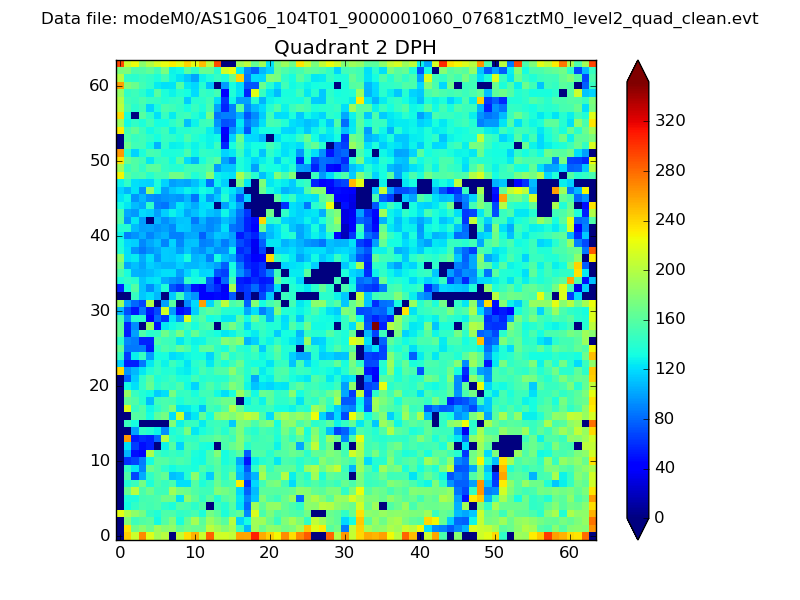
Histogram calculated using DETX and DETY for each event in the final _common_clean file
| Quadrant A | 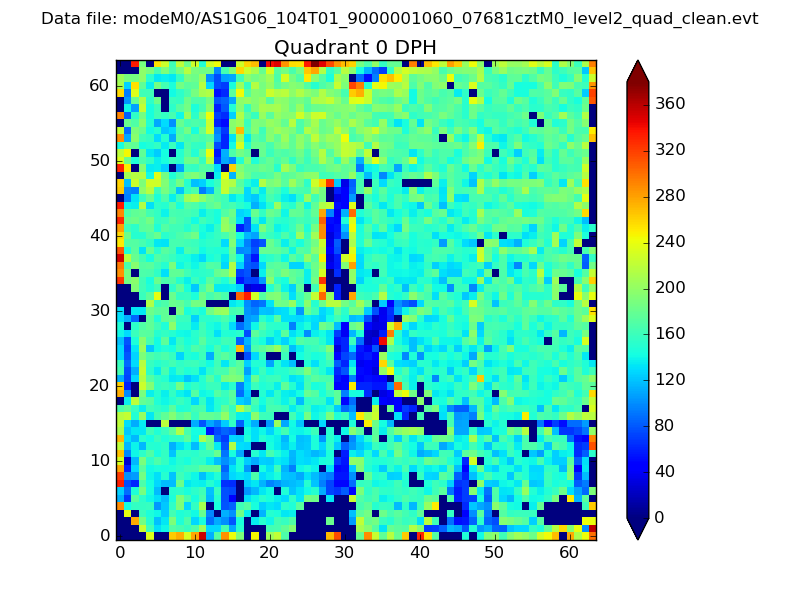 |
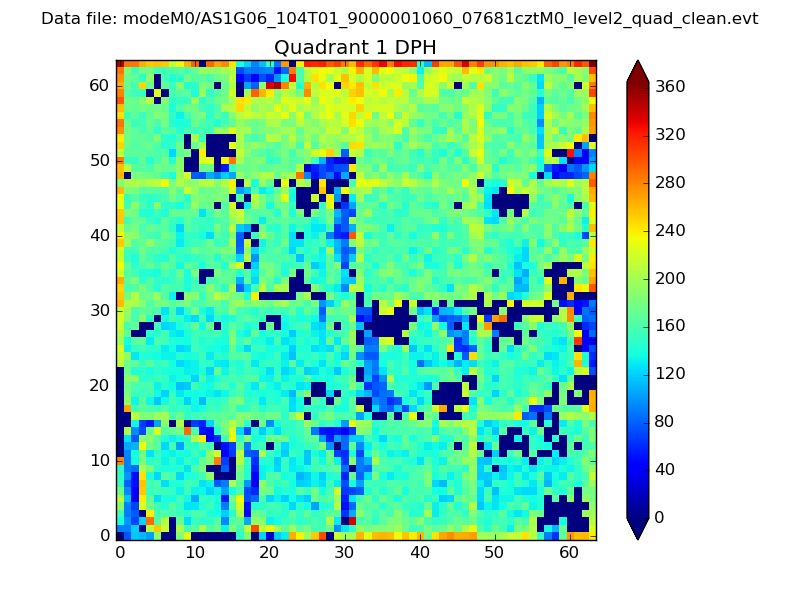 |
Quadrant B |
|---|---|---|---|
| Quadrant D | 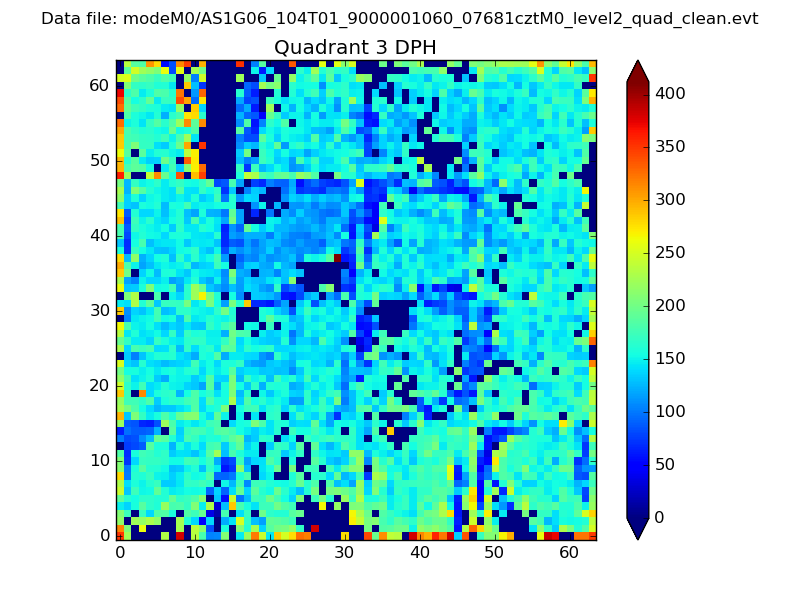 |
 |
Quadrant C |
| Plot type | Count rate plots | Images |
|---|---|---|
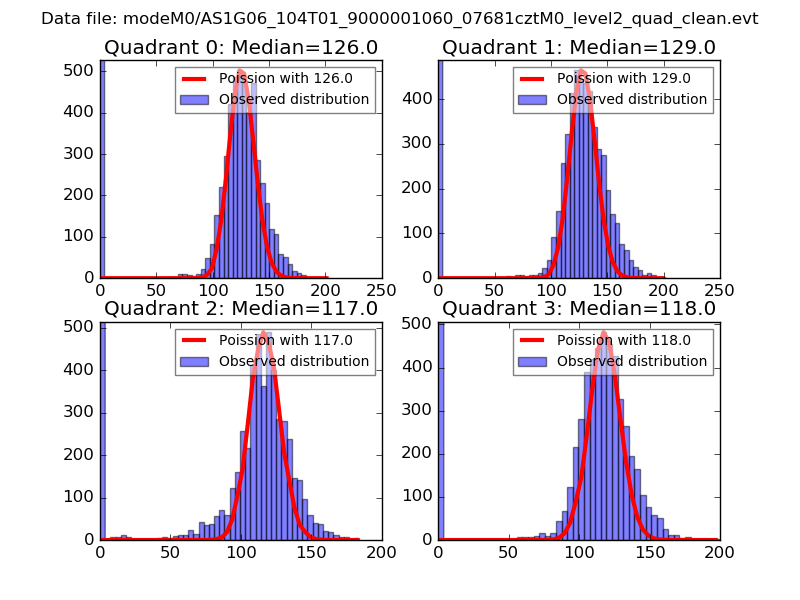
| Comparison with Poisson distribution Blue bars denote a histogram of data divided into 1 sec bins. Red curve is a Poisson curve with rate = median count rate of data. |
 |
 |
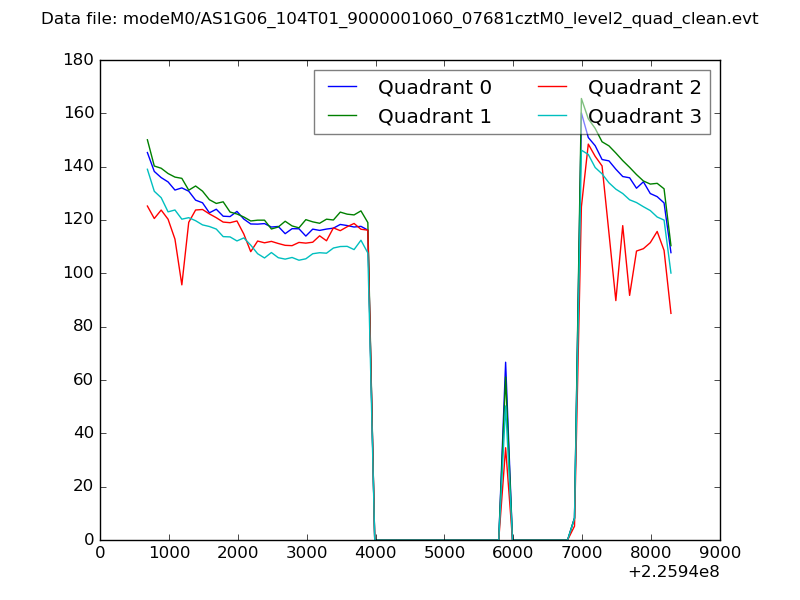
| Quadrant-wise count rates Data is divided into 100 sec bins |
 |
|
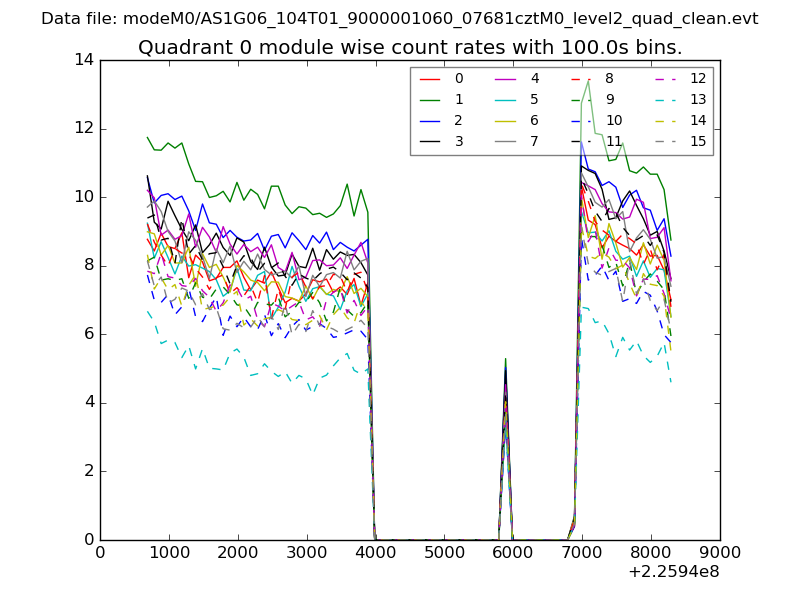
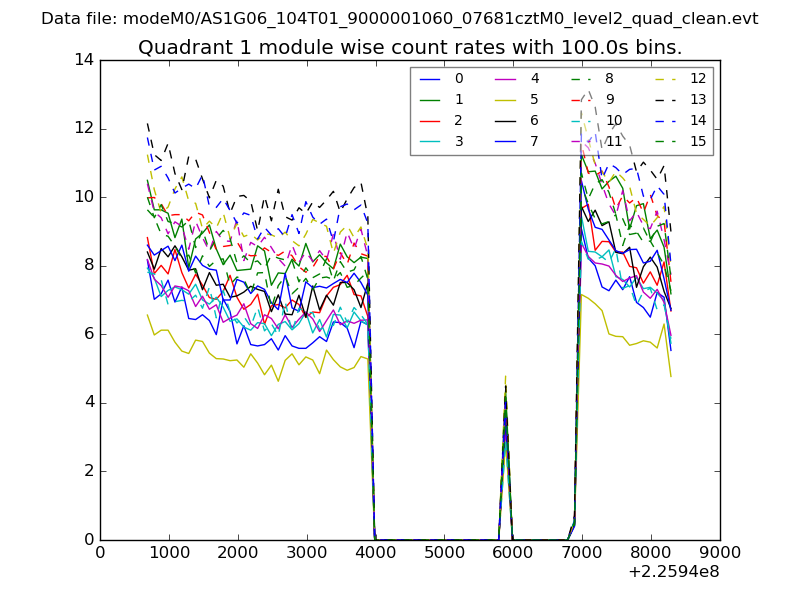
| Module-wise count rates for Quadrant A Data is divided into 100 sec bins |
 |
 |
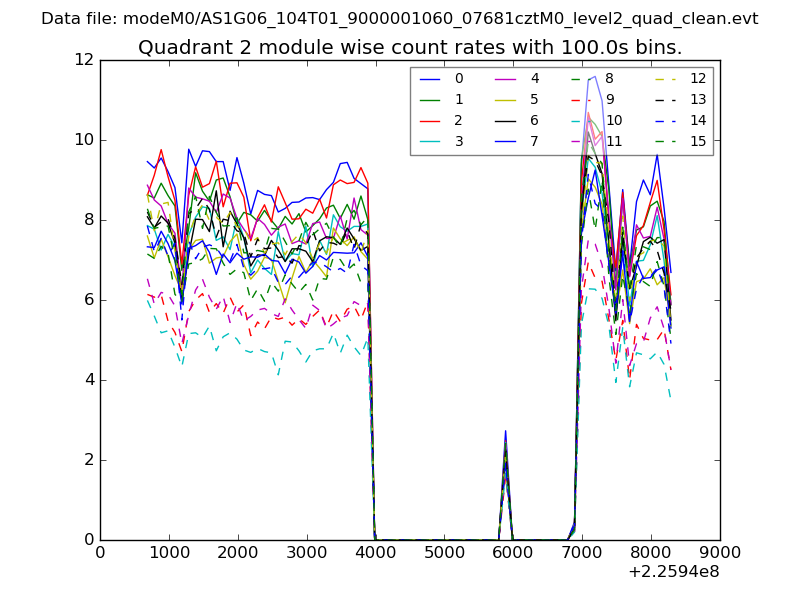
| Module-wise count rates for Quadrant B Data is divided into 100 sec bins |
 |
 |
| Module-wise count rates for Quadrant C Data is divided into 100 sec bins |
 |
 |
| Module-wise count rates for Quadrant D Data is divided into 100 sec bins |
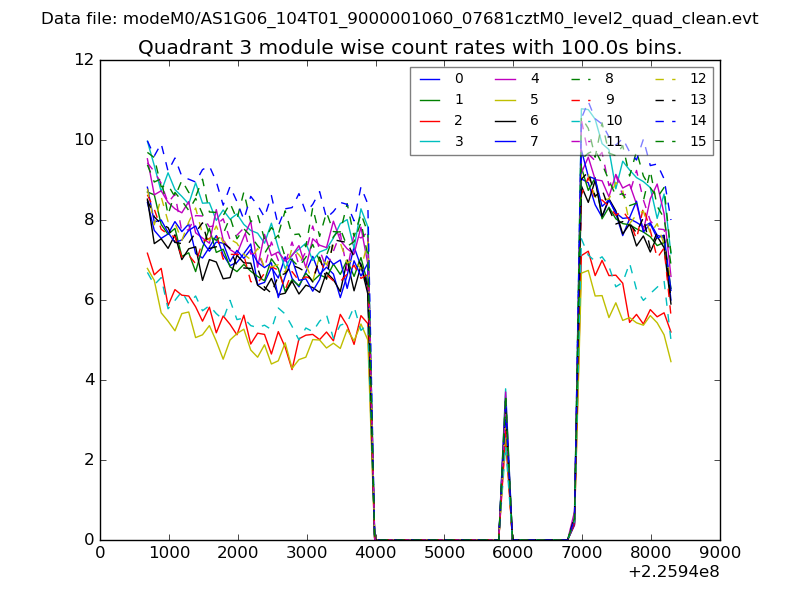 |
 |
| Parameter | Plot |
|---|---|
| CZT HV Monitor | 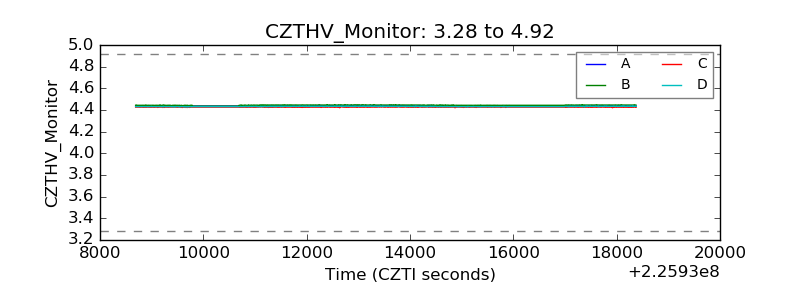 |
| D_VDD | 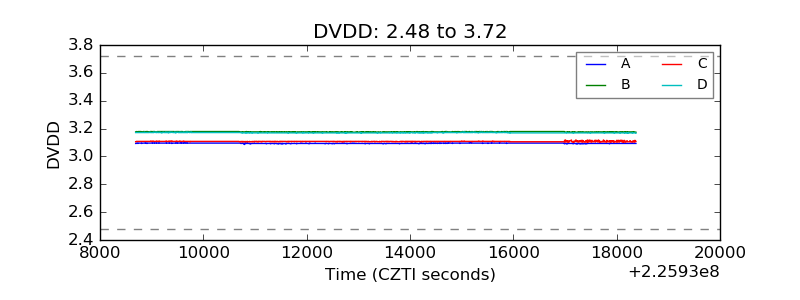 |
| Temperature 1 | 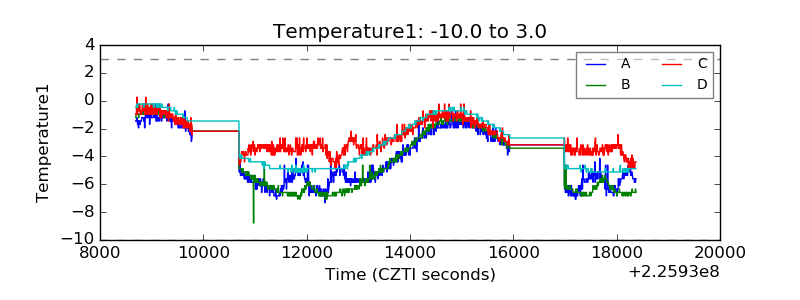 |
| Veto HV Monitor | 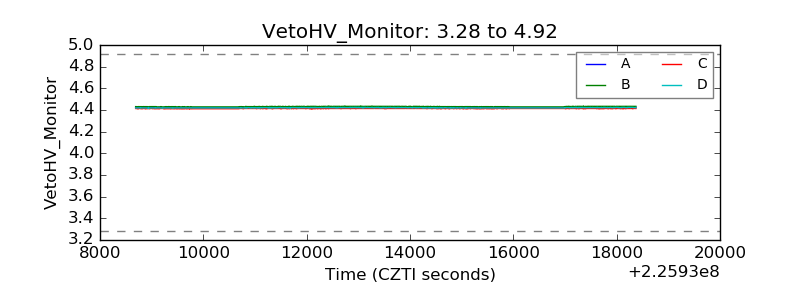 |
| Veto LLD | 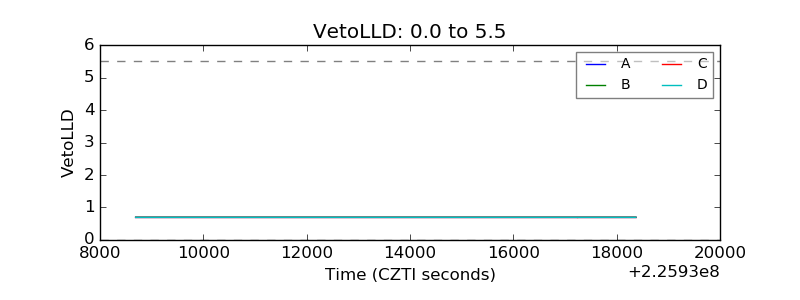 |
| Alpha Counter | 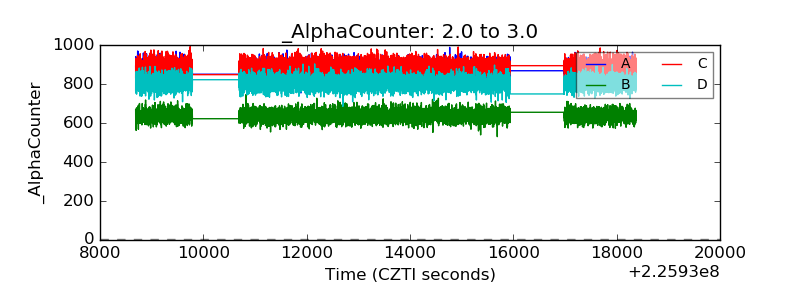 |
| _CPM_Rate | 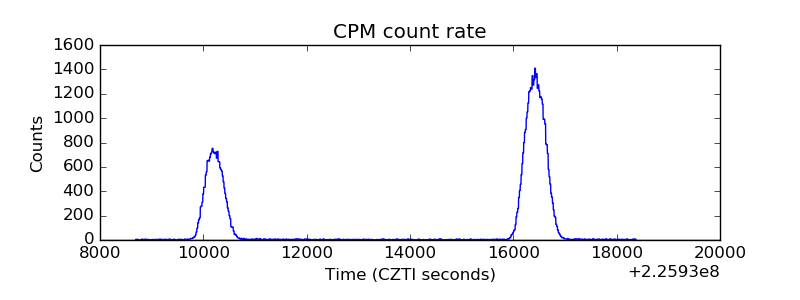 |
| CZT Counter | 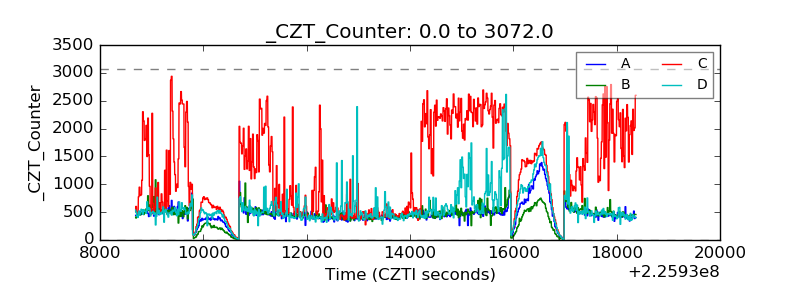 |
| +2.5 Volts monitor |  |
| +5 Volts monitor | 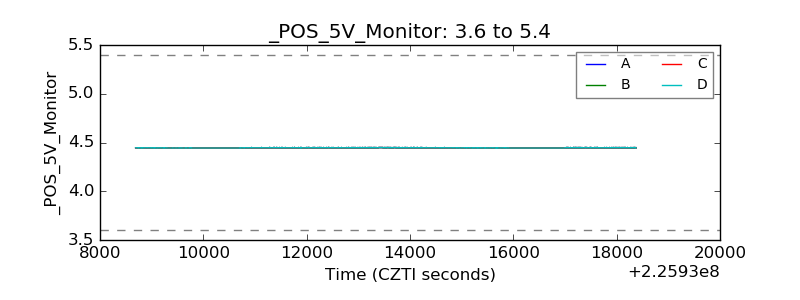 |
| _ROLL_ROT | 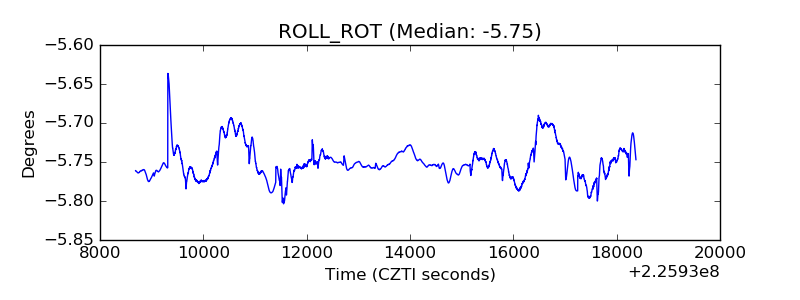 |
| _Roll_DEC | 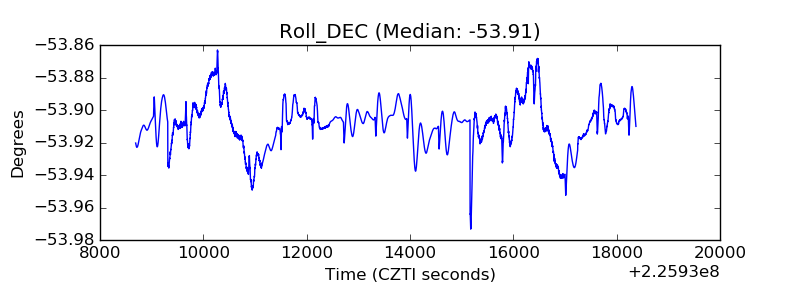 |
| _Roll_RA |  |
| Veto Counter | 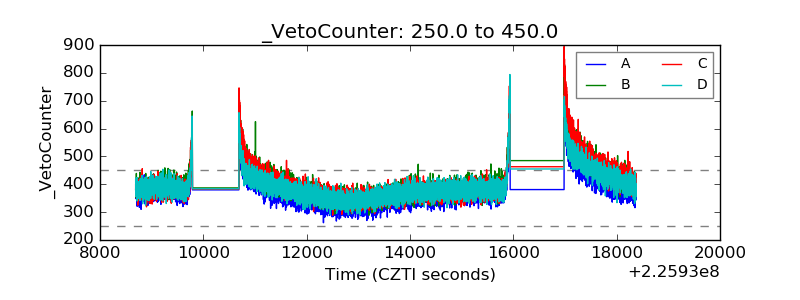 |