| Param | Original file | Final file |
|---|---|---|
| Filename | modeM0/AS1G06_104T01_9000001060_07683cztM0_level2.evt | modeM0/AS1G06_104T01_9000001060_07683cztM0_level2_quad_clean.evt |
| Size (bytes) | 607,305,600 | 94,386,240 |
| Size | 579.2 MB | 90.0 MB |
| Events in quadrant A | 3,012,214 | 620,165 |
| Events in quadrant B | 3,147,530 | 638,448 |
| Events in quadrant C | 8,547,368 | 560,987 |
| Events in quadrant D | 3,246,921 | 586,719 |
| Mode SS | |||
|---|---|---|---|
| Quadrant | BADHDUFLAG | Total packets | Discarded packets |
| A | 0 | 132 | 0 |
| B | 0 | 132 | 0 |
| C | 0 | 132 | 0 |
| D | 0 | 132 | 0 |
| Mode M9 | |||
|---|---|---|---|
| Quadrant | BADHDUFLAG | Total packets | Discarded packets |
| A | 0 | 16 | 0 |
| B | 0 | 16 | 0 |
| C | 0 | 16 | 0 |
| D | 0 | 17 | 0 |
| Mode M0 | |||
|---|---|---|---|
| Quadrant | BADHDUFLAG | Total packets | Discarded packets |
| A | 0 | 13211 | 3 |
| B | 0 | 13458 | 2 |
| C | 0 | 29884 | 2 |
| D | 0 | 13979 | 2 |
| Quadrant | Total seconds | Saturated seconds | Saturation percentage |
|---|---|---|---|
| A | 6473 | 20 | 0.308976% |
| B | 6473 | 35 | 0.540708% |
| C | 6473 | 1286 | 19.867140% |
| D | 6473 | 51 | 0.787888% |
Noise dominated data is calculated using 1-second bins in cleaned event files. If a bin has >2000 counts, and if more than 50% of those come from <1% of pixels, then it is considered to be noise-dominated and hence unusable.
| Quadrant | # 1 sec bins | Bins with >0 counts | Bins with >2000 counts | High rate bins dominated by noise | Noise dominated (total time) | Noise dominated (detector-on time) | Marked lightcurve |
|---|---|---|---|---|---|---|---|
| A | 7653 | 6474 | 0 | 0 | 0.00% | 0.00% | 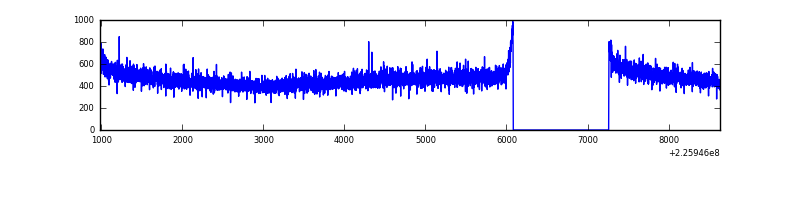 |
| B | 7653 | 6474 | 3 | 3 | 0.04% | 0.05% | 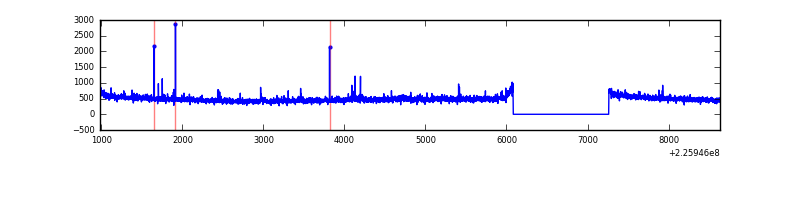 |
| C | 7653 | 6474 | 1342 | 1342 | 17.54% | 20.73% | 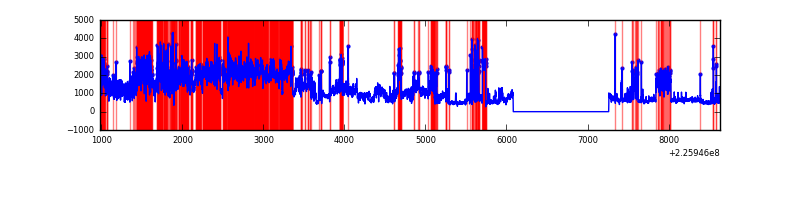 |
| D | 7653 | 6474 | 15 | 15 | 0.20% | 0.23% | 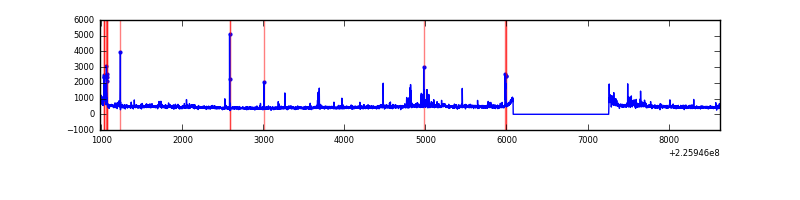 |
Top three noisy pixels from each quadrant. If the there are fewer than three noisy pixels in the level2.evt file, extra rows are filled as -1
| Pixel properties | Quadrant properties | ||||||
|---|---|---|---|---|---|---|---|
| Quadrant | DetID | PixID | Counts | Sigma | Mean | Median | Sigma |
| A | 0 | 226 | 7479 | 42.6 | 781 | 764 | 157.6 |
| A | 12 | 194 | 6853 | 38.63 | 781 | 764 | 157.6 |
| A | 13 | 254 | 3489 | 17.29 | 781 | 764 | 157.6 |
| B | 0 | 219 | 31218 | 204.76 | 793 | 775 | 148.7 |
| B | 12 | 111 | 14307 | 91.02 | 793 | 775 | 148.7 |
| B | 5 | 255 | 12990 | 82.16 | 793 | 775 | 148.7 |
| C | 9 | 68 | 5620727 | 32912.05 | 739 | 743 | 170.8 |
| C | 8 | 208 | 21806 | 123.35 | 739 | 743 | 170.8 |
| C | 8 | 128 | 8175 | 43.52 | 739 | 743 | 170.8 |
| D | 2 | 152 | 197547 | 1050.1 | 770 | 750 | 187.4 |
| D | 2 | 136 | 48487 | 254.72 | 770 | 750 | 187.4 |
| D | 12 | 233 | 40834 | 213.89 | 770 | 750 | 187.4 |
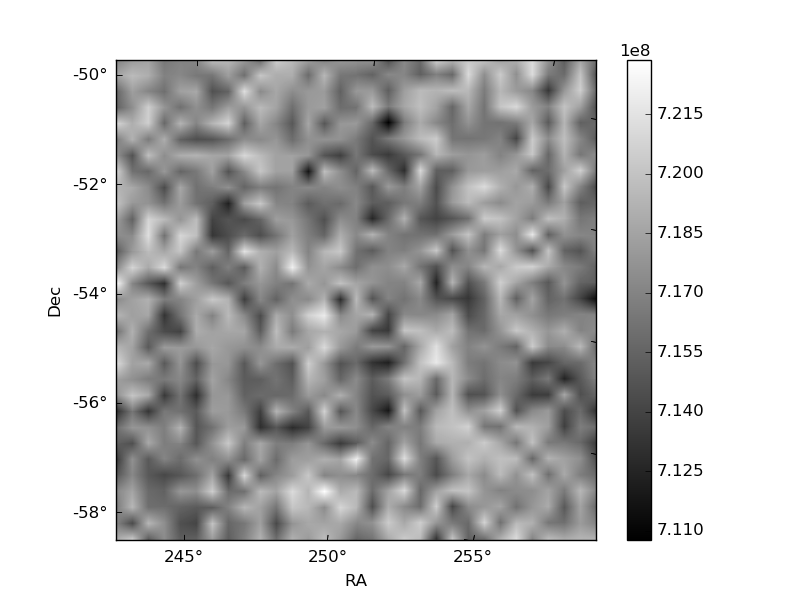
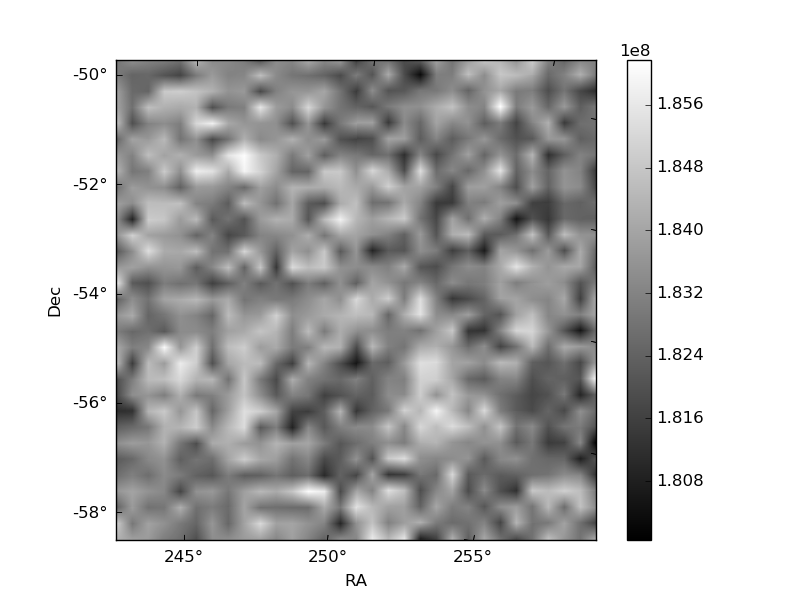
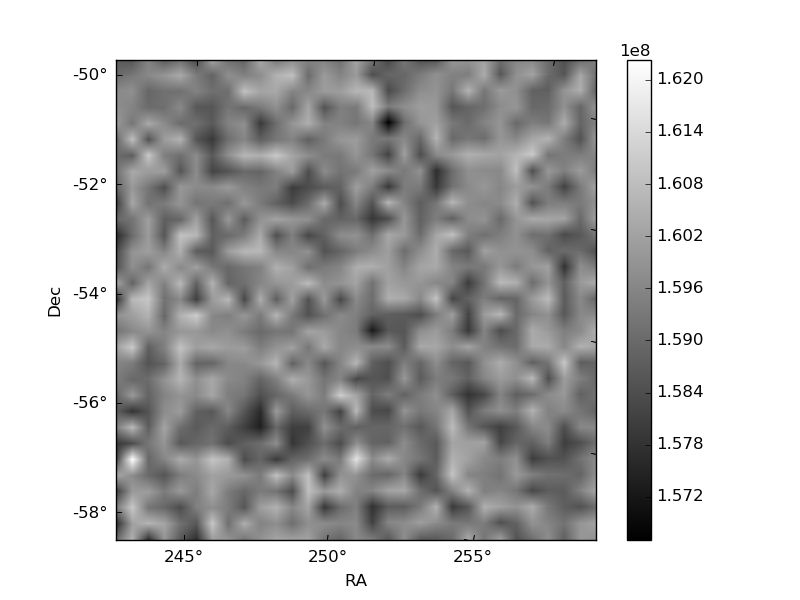
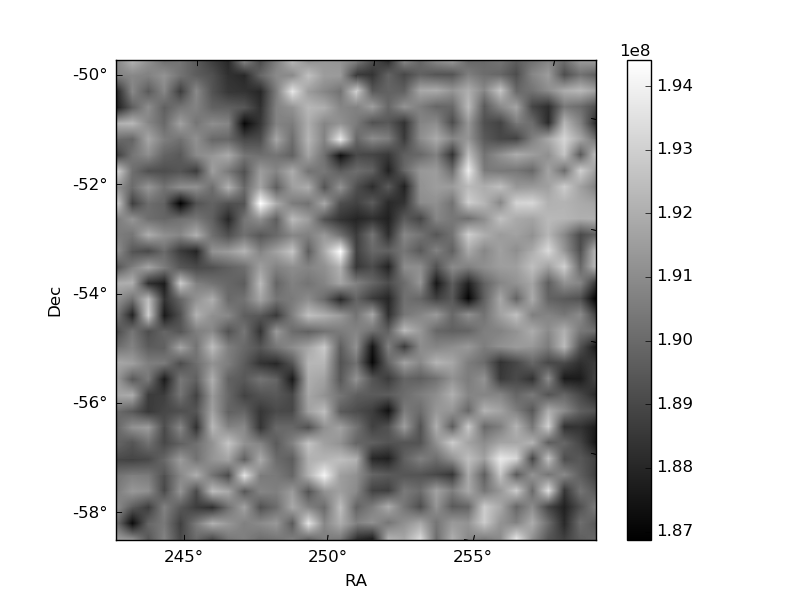
Histogram calculated using DETX and DETY for each event in the final _common_clean file
| Quadrant A | 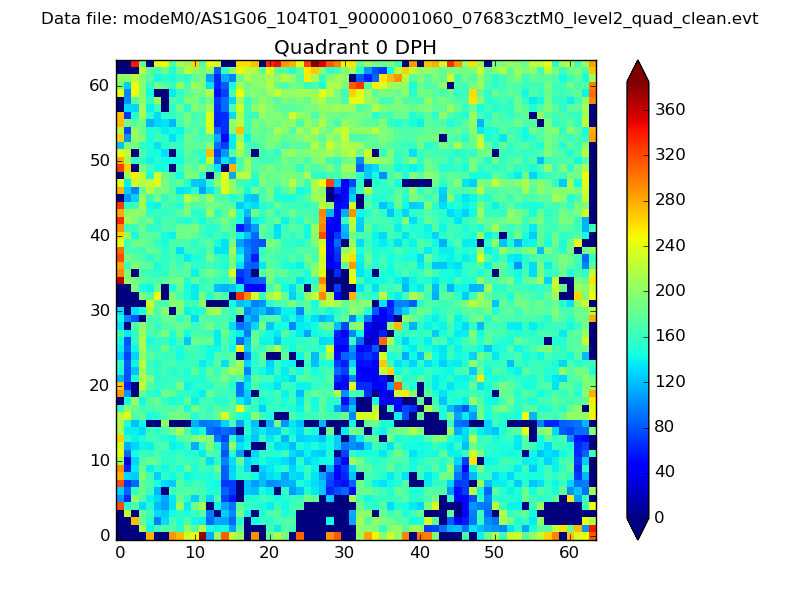 |
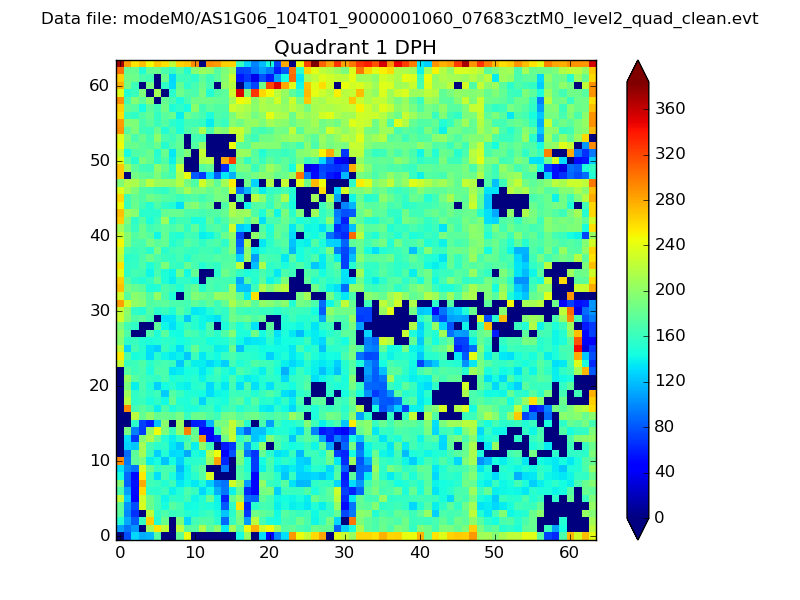 |
Quadrant B |
|---|---|---|---|
| Quadrant D | 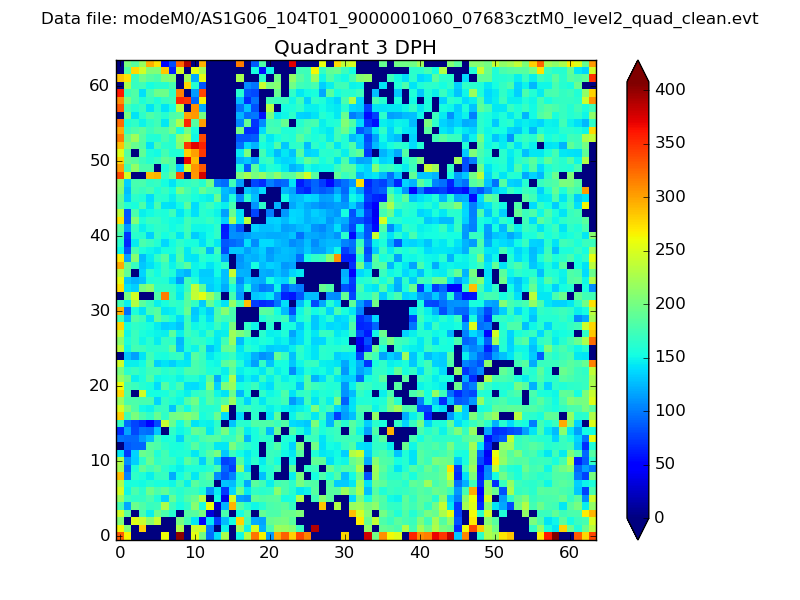 |
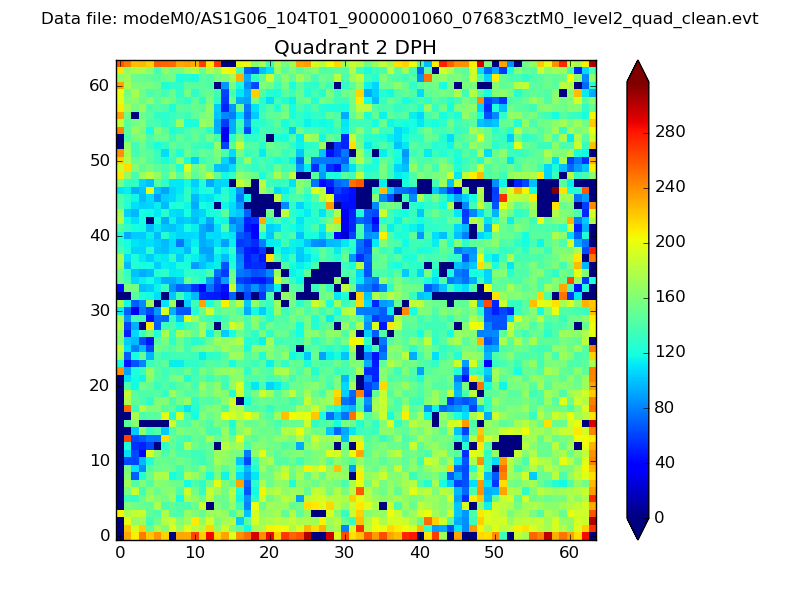 |
Quadrant C |
| Plot type | Count rate plots | Images |
|---|---|---|
| Comparison with Poisson distribution Blue bars denote a histogram of data divided into 1 sec bins. Red curve is a Poisson curve with rate = median count rate of data. |
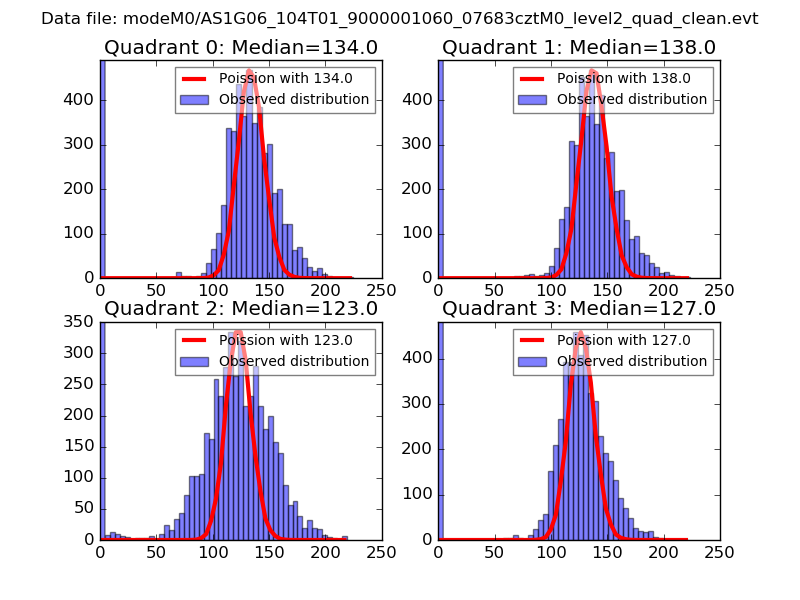 |
 |
| Quadrant-wise count rates Data is divided into 100 sec bins |
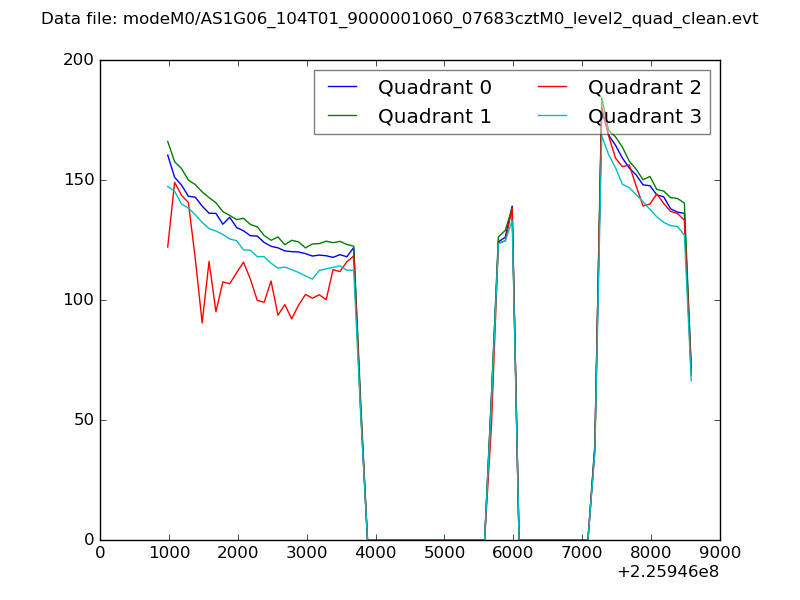 |
|
| Module-wise count rates for Quadrant A Data is divided into 100 sec bins |
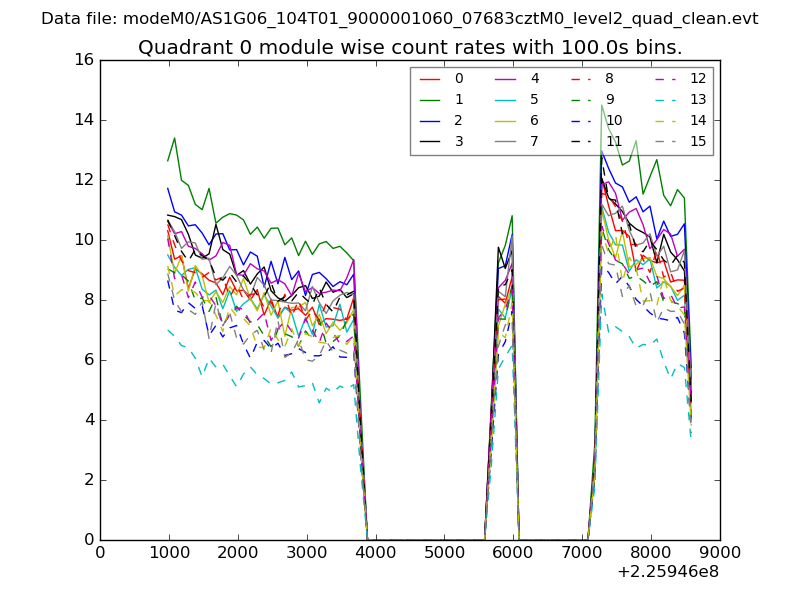 |
 |
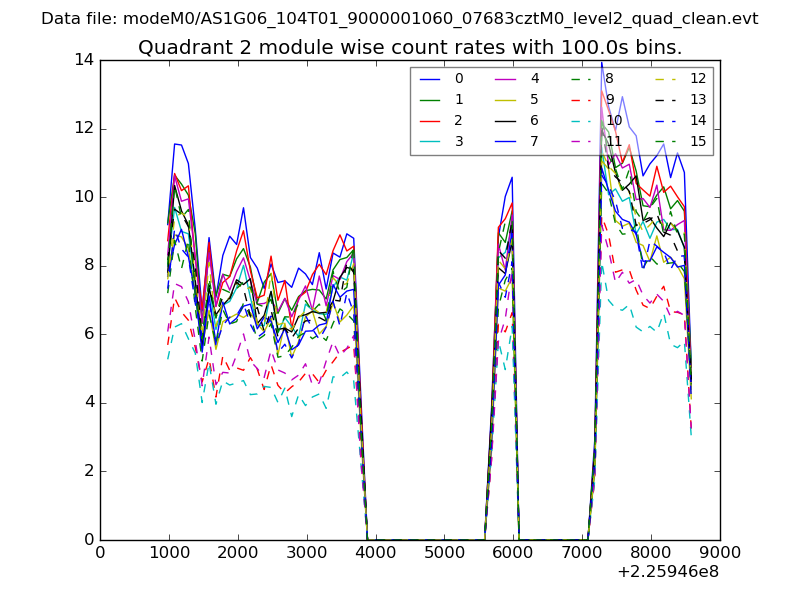
| Module-wise count rates for Quadrant B Data is divided into 100 sec bins |
 |
 |
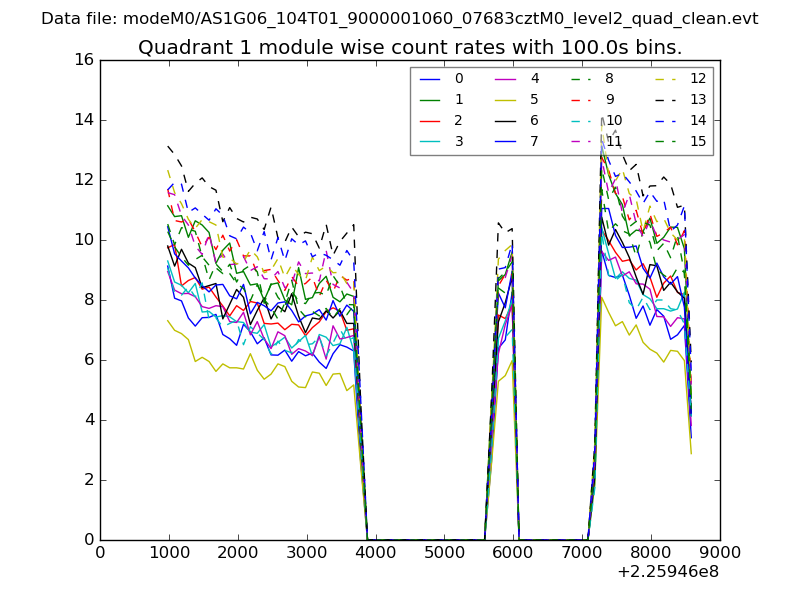
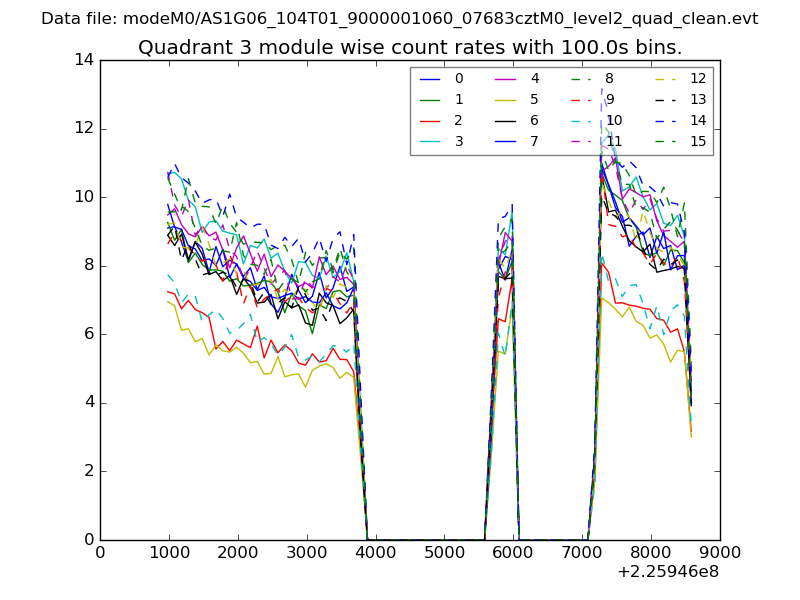
| Module-wise count rates for Quadrant C Data is divided into 100 sec bins |
 |
 |
| Module-wise count rates for Quadrant D Data is divided into 100 sec bins |
 |
 |
| Parameter | Plot |
|---|---|
| CZT HV Monitor |  |
| D_VDD | 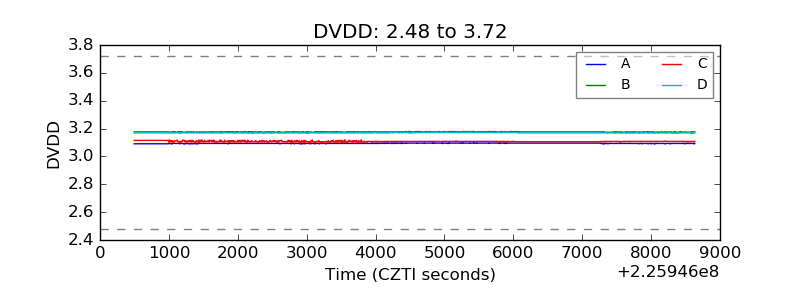 |
| Temperature 1 | 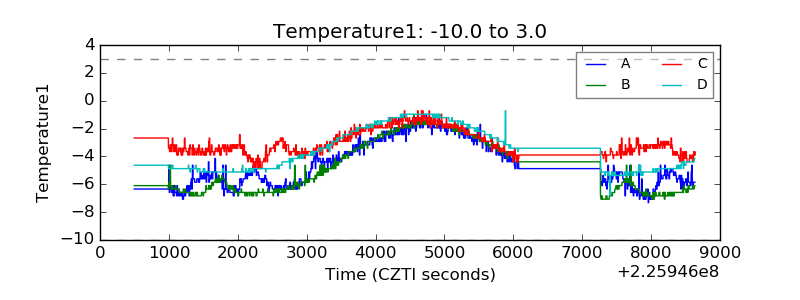 |
| Veto HV Monitor | 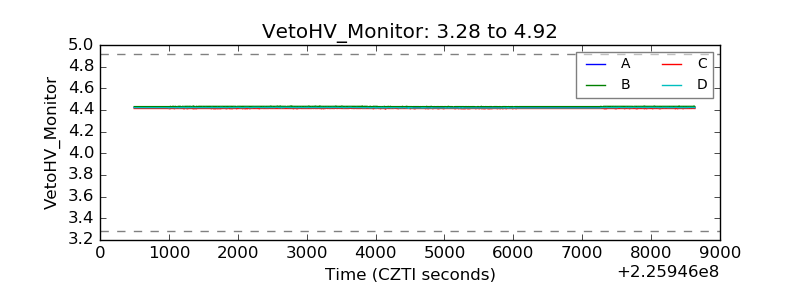 |
| Veto LLD | 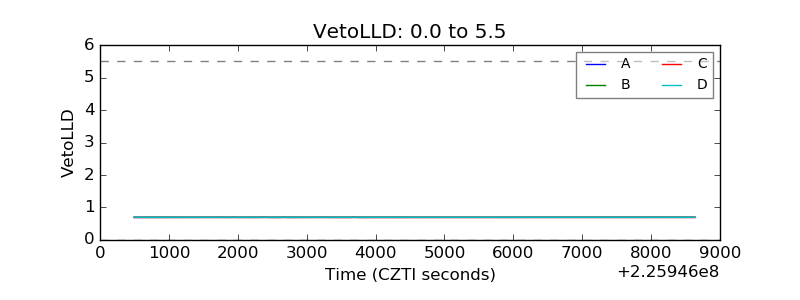 |
| Alpha Counter | 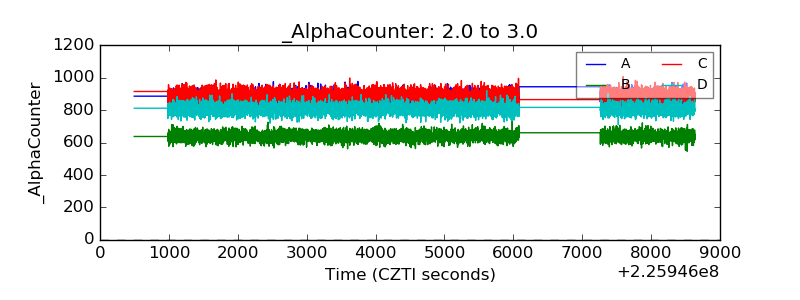 |
| _CPM_Rate | 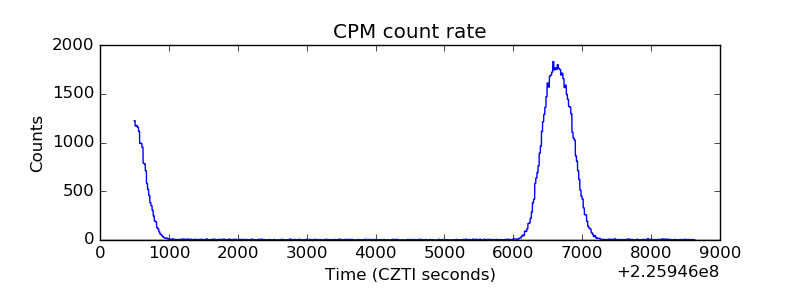 |
| CZT Counter | 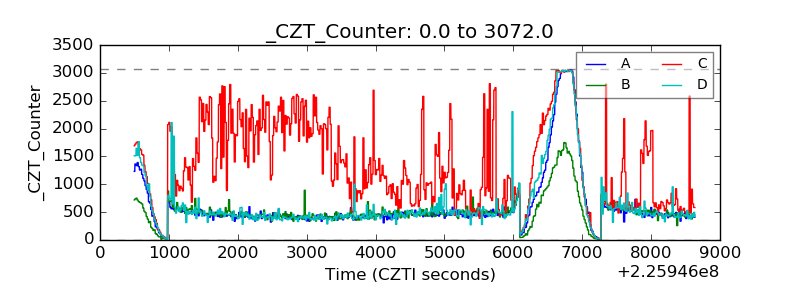 |
| +2.5 Volts monitor |  |
| +5 Volts monitor |  |
| _ROLL_ROT | 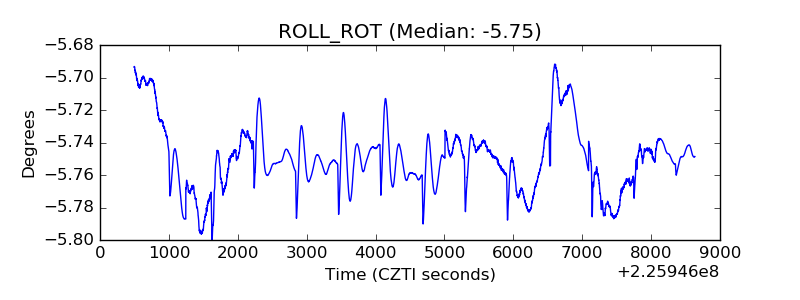 |
| _Roll_DEC | 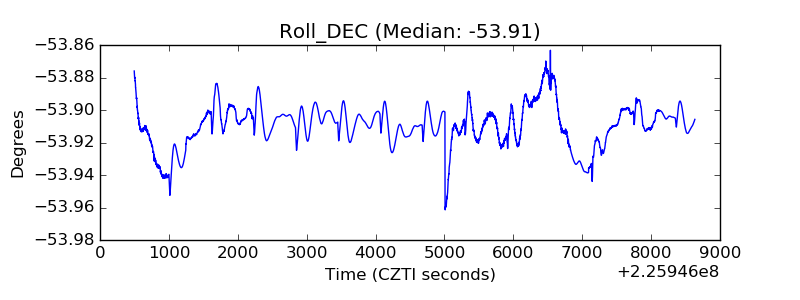 |
| _Roll_RA | 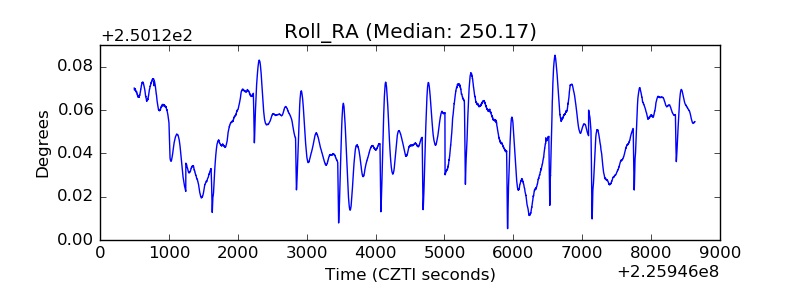 |
| Veto Counter | 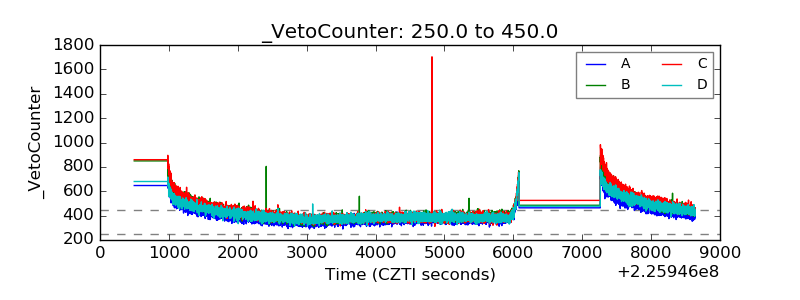 |