| Param | Original file | Final file |
|---|---|---|
| Filename | modeM0/AS1G06_104T01_9000001060_07684cztM0_level2.evt | modeM0/AS1G06_104T01_9000001060_07684cztM0_level2_quad_clean.evt |
| Size (bytes) | 459,976,320 | 85,584,960 |
| Size | 438.7 MB | 81.6 MB |
| Events in quadrant A | 2,766,415 | 554,648 |
| Events in quadrant B | 2,839,527 | 569,318 |
| Events in quadrant C | 4,862,407 | 537,825 |
| Events in quadrant D | 3,069,117 | 525,327 |
| Mode SS | |||
|---|---|---|---|
| Quadrant | BADHDUFLAG | Total packets | Discarded packets |
| A | 0 | 116 | 0 |
| B | 0 | 116 | 0 |
| C | 0 | 116 | 0 |
| D | 0 | 116 | 0 |
| Mode M9 | |||
|---|---|---|---|
| Quadrant | BADHDUFLAG | Total packets | Discarded packets |
| A | 0 | 13 | 0 |
| B | 0 | 13 | 0 |
| C | 0 | 13 | 0 |
| D | 0 | 13 | 0 |
| Mode M0 | |||
|---|---|---|---|
| Quadrant | BADHDUFLAG | Total packets | Discarded packets |
| A | 0 | 11895 | 2 |
| B | 0 | 12062 | 1 |
| C | 0 | 18358 | 1 |
| D | 0 | 12965 | 1 |
| Quadrant | Total seconds | Saturated seconds | Saturation percentage |
|---|---|---|---|
| A | 5794 | 29 | 0.500518% |
| B | 5794 | 33 | 0.569555% |
| C | 5794 | 396 | 6.834657% |
| D | 5794 | 67 | 1.156369% |
Noise dominated data is calculated using 1-second bins in cleaned event files. If a bin has >2000 counts, and if more than 50% of those come from <1% of pixels, then it is considered to be noise-dominated and hence unusable.
| Quadrant | # 1 sec bins | Bins with >0 counts | Bins with >2000 counts | High rate bins dominated by noise | Noise dominated (total time) | Noise dominated (detector-on time) | Marked lightcurve |
|---|---|---|---|---|---|---|---|
| A | 7049 | 5795 | 0 | 0 | 0.00% | 0.00% | 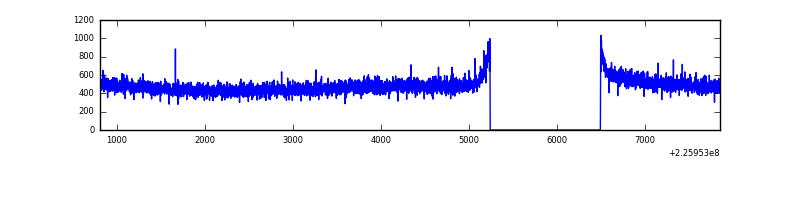 |
| B | 7049 | 5795 | 1 | 1 | 0.01% | 0.02% | 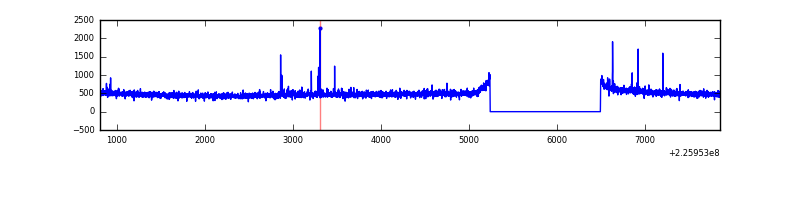 |
| C | 7049 | 5795 | 351 | 351 | 4.98% | 6.06% | 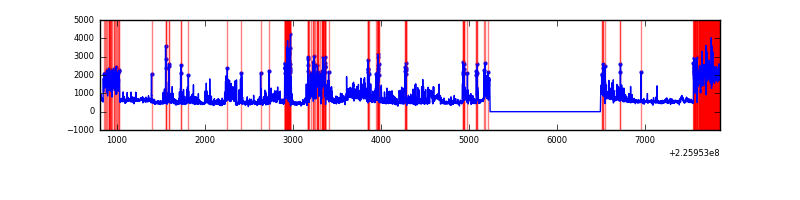 |
| D | 7049 | 5795 | 38 | 38 | 0.54% | 0.66% | 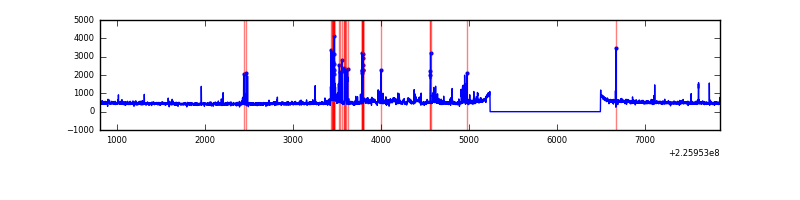 |
Top three noisy pixels from each quadrant. If the there are fewer than three noisy pixels in the level2.evt file, extra rows are filled as -1
| Pixel properties | Quadrant properties | ||||||
|---|---|---|---|---|---|---|---|
| Quadrant | DetID | PixID | Counts | Sigma | Mean | Median | Sigma |
| A | 0 | 226 | 6705 | 41.17 | 718 | 703 | 145.8 |
| A | 12 | 194 | 6352 | 38.74 | 718 | 703 | 145.8 |
| A | 13 | 254 | 2733 | 13.92 | 718 | 703 | 145.8 |
| B | 12 | 111 | 13041 | 91.42 | 720 | 703 | 135.0 |
| B | 4 | 239 | 11875 | 82.78 | 720 | 703 | 135.0 |
| B | 0 | 219 | 11620 | 80.89 | 720 | 703 | 135.0 |
| C | 9 | 68 | 1816388 | 11363.46 | 696 | 700 | 159.8 |
| C | 8 | 208 | 321165 | 2005.62 | 696 | 700 | 159.8 |
| C | 13 | 61 | 5234 | 28.37 | 696 | 700 | 159.8 |
| D | 13 | 104 | 174514 | 1013.34 | 706 | 685 | 171.5 |
| D | 1 | 83 | 132634 | 769.2 | 706 | 685 | 171.5 |
| D | 2 | 152 | 35992 | 205.82 | 706 | 685 | 171.5 |
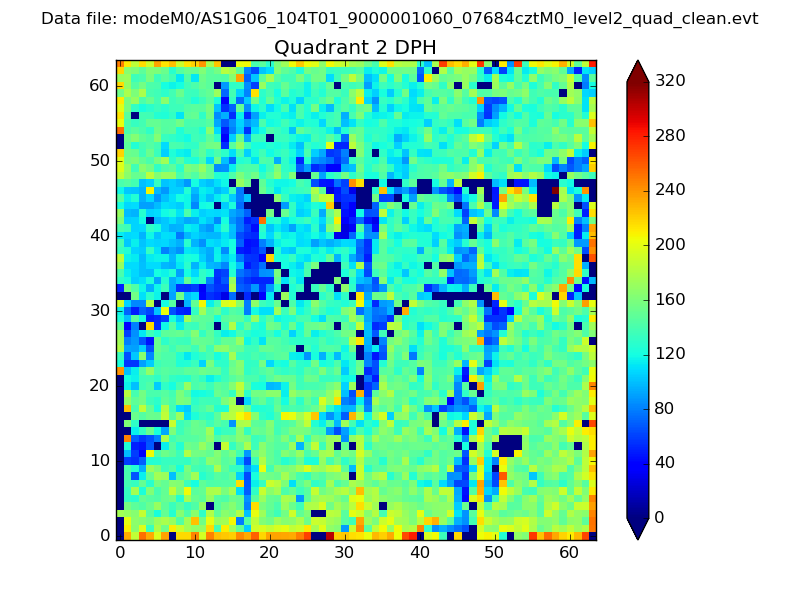
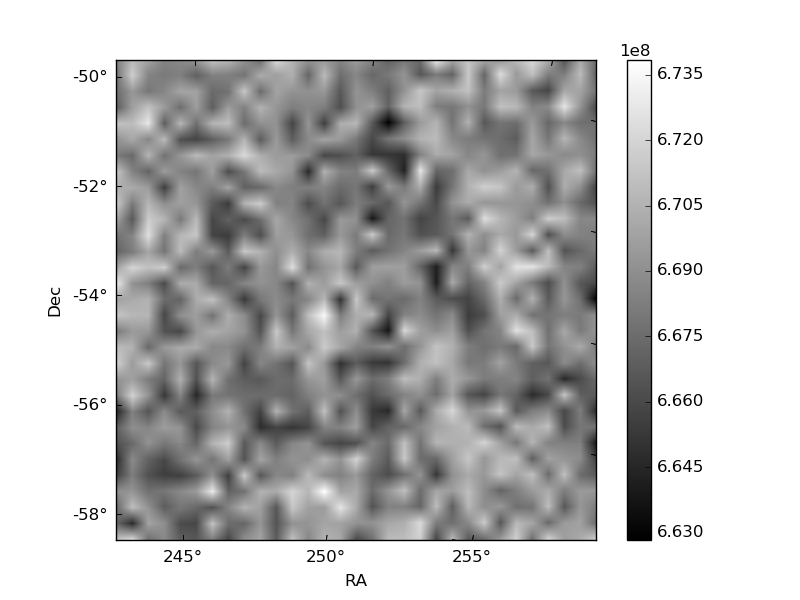
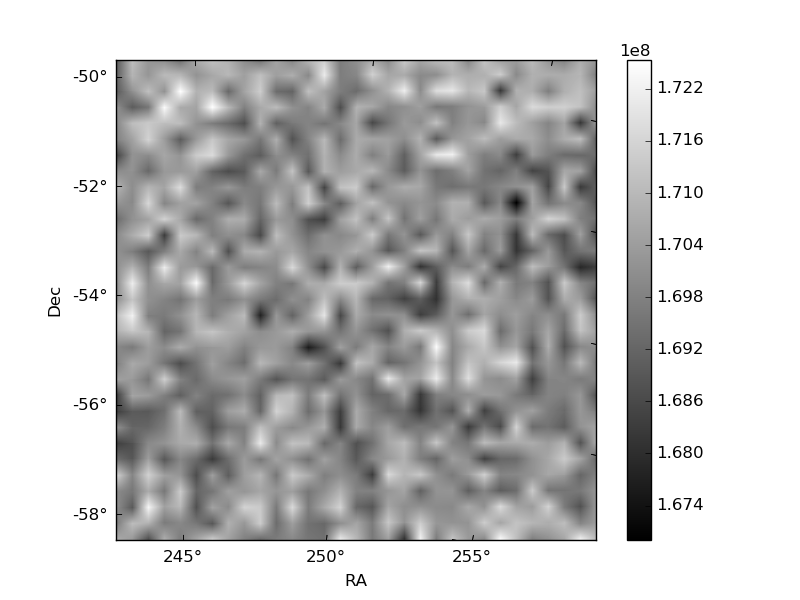
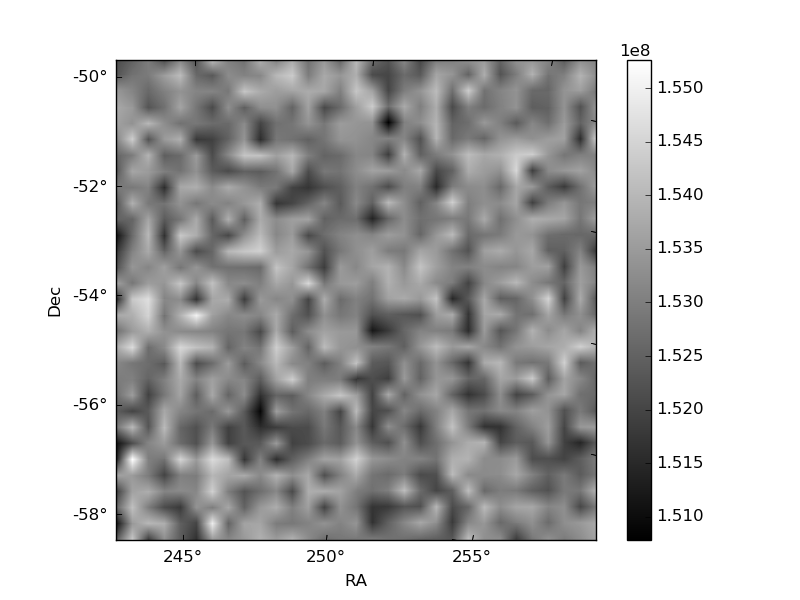
Histogram calculated using DETX and DETY for each event in the final _common_clean file
| Quadrant A | 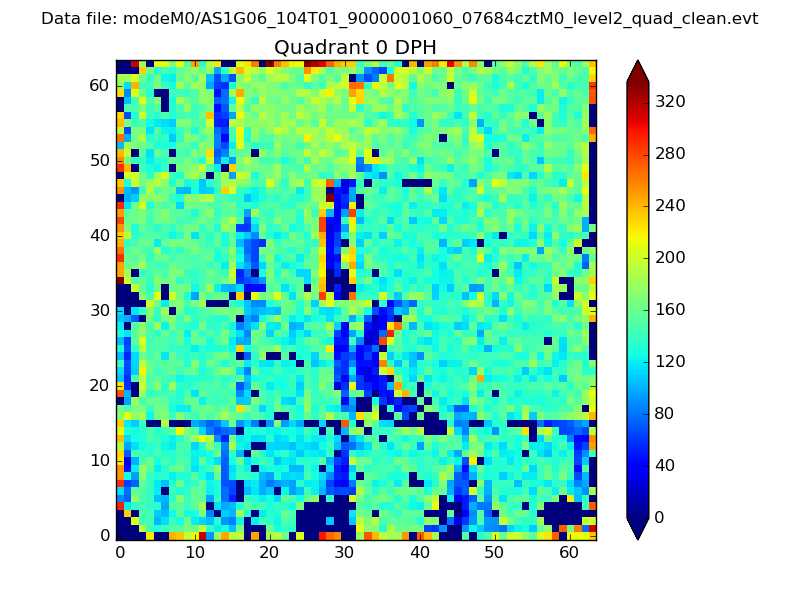 |
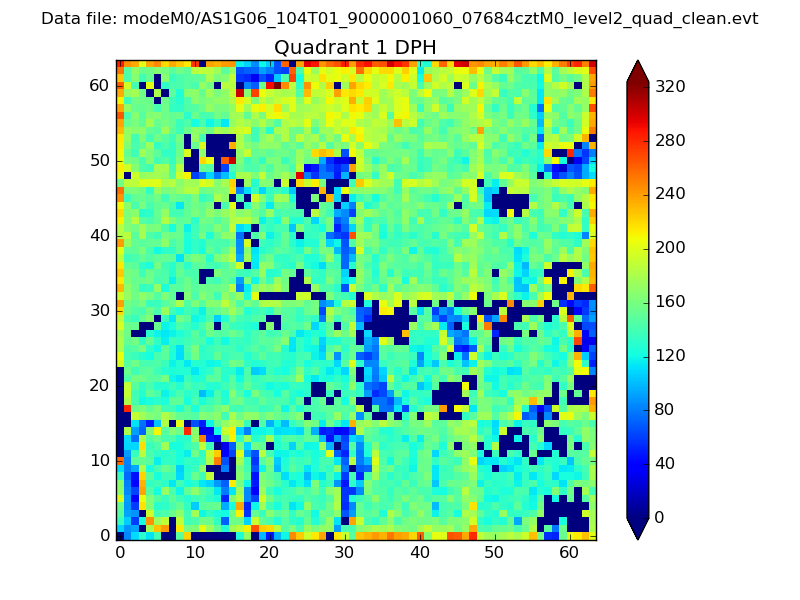 |
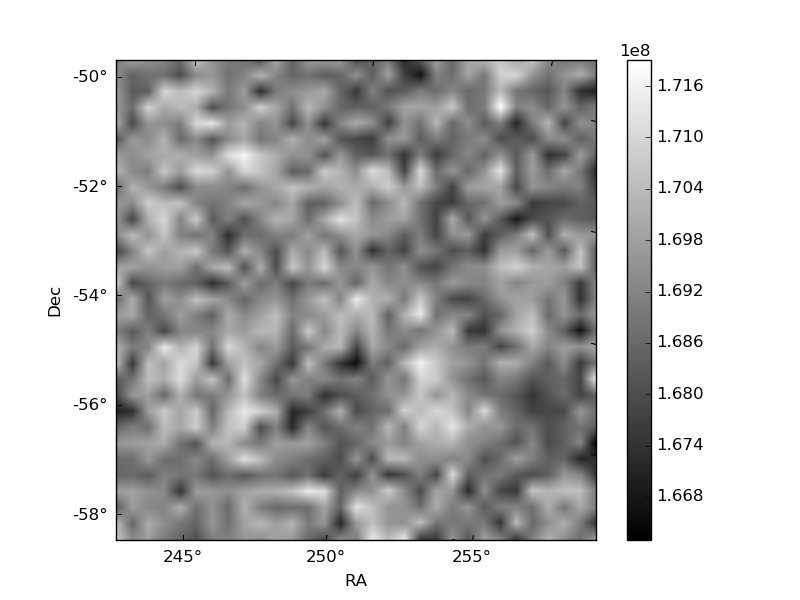
Quadrant B |
|---|---|---|---|
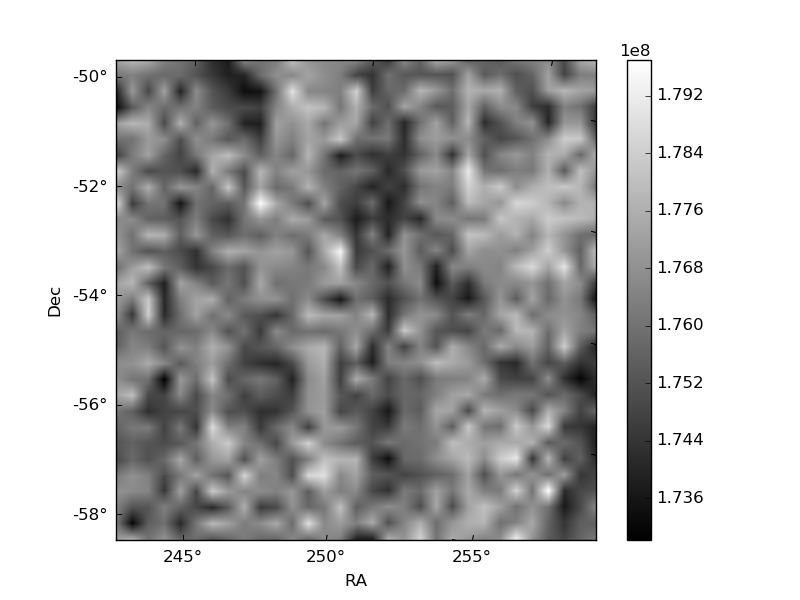
| Quadrant D | 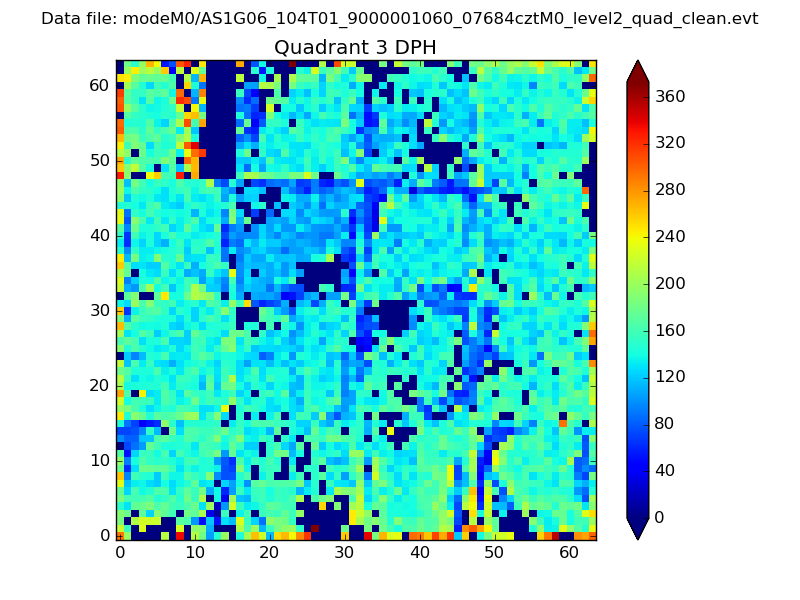 |
 |
Quadrant C |
| Plot type | Count rate plots | Images |
|---|---|---|
| Comparison with Poisson distribution Blue bars denote a histogram of data divided into 1 sec bins. Red curve is a Poisson curve with rate = median count rate of data. |
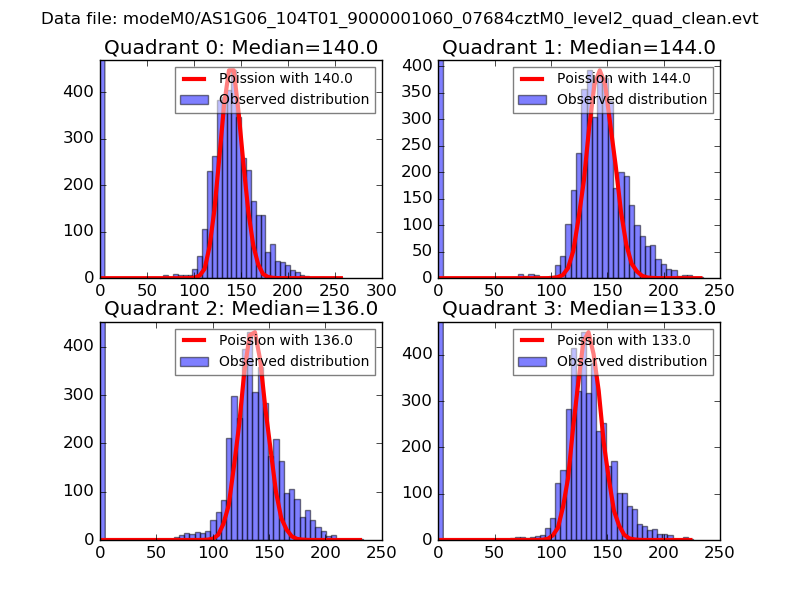 |
 |
| Quadrant-wise count rates Data is divided into 100 sec bins |
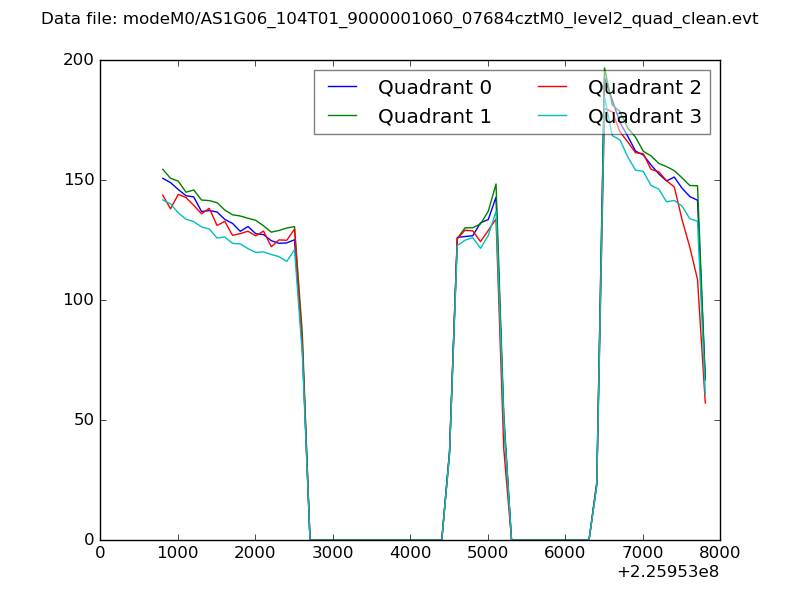 |
|
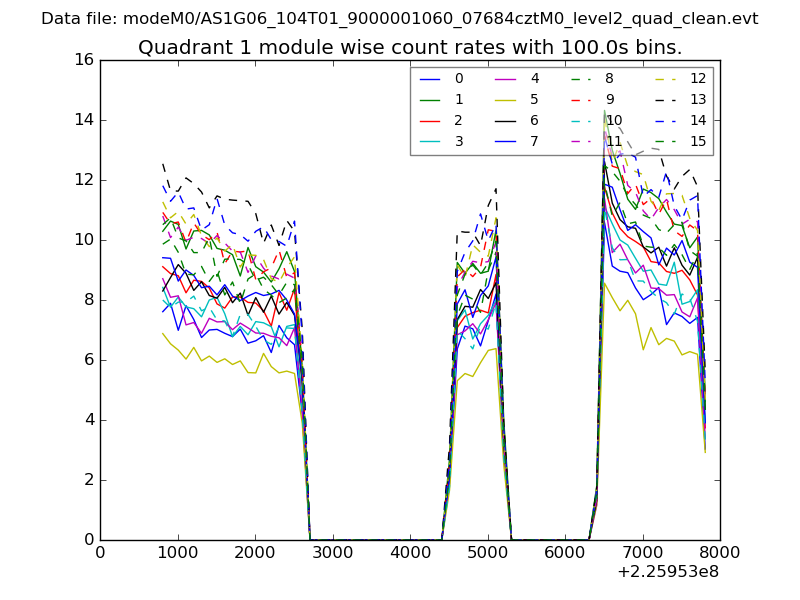
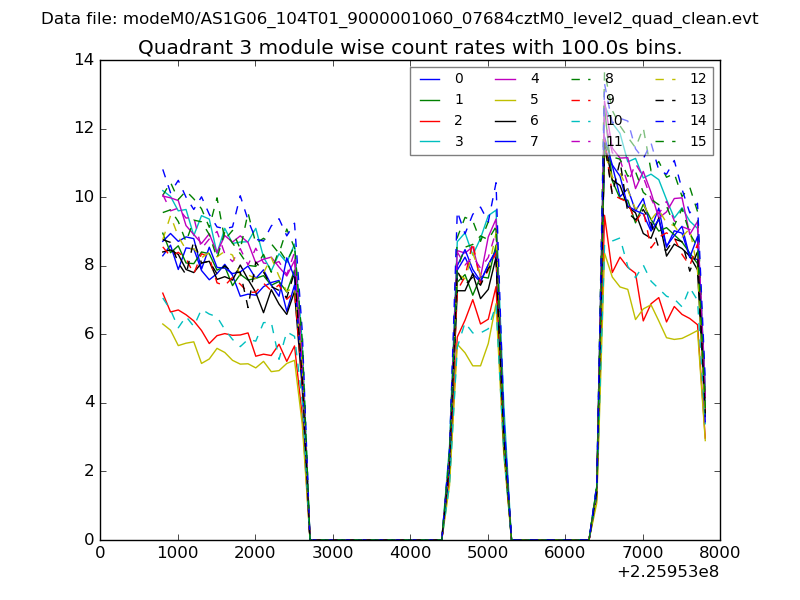
| Module-wise count rates for Quadrant A Data is divided into 100 sec bins |
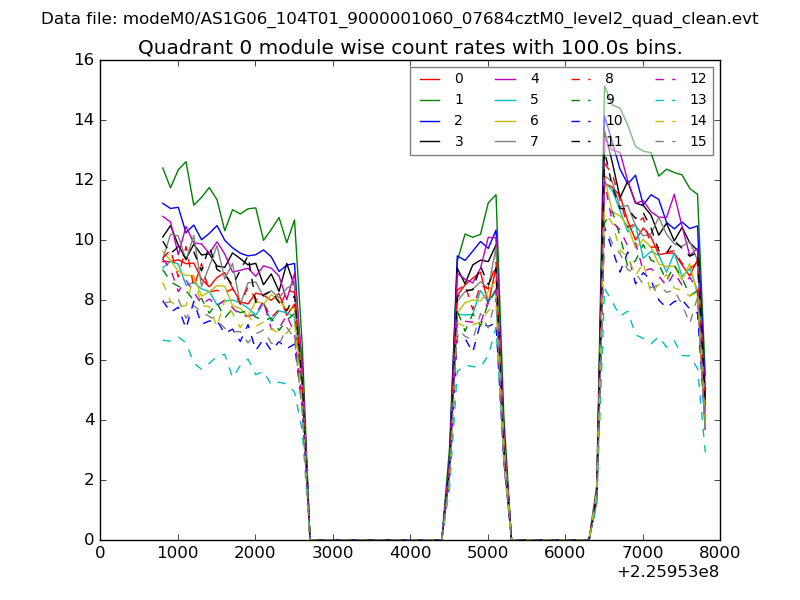 |
 |
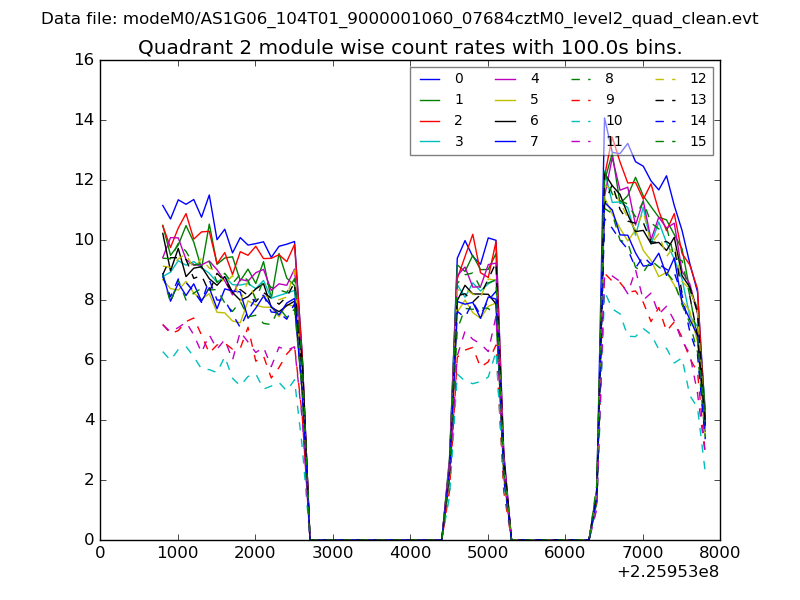
| Module-wise count rates for Quadrant B Data is divided into 100 sec bins |
 |
 |
| Module-wise count rates for Quadrant C Data is divided into 100 sec bins |
 |
 |
| Module-wise count rates for Quadrant D Data is divided into 100 sec bins |
 |
 |
| Parameter | Plot |
|---|---|
| CZT HV Monitor | 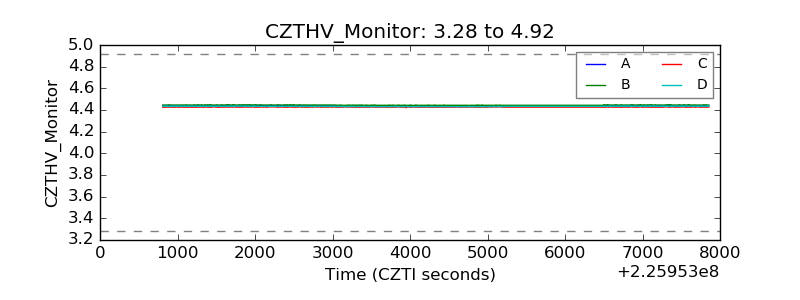 |
| D_VDD | 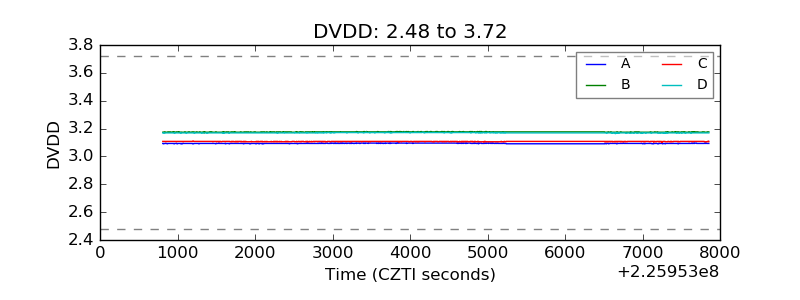 |
| Temperature 1 | 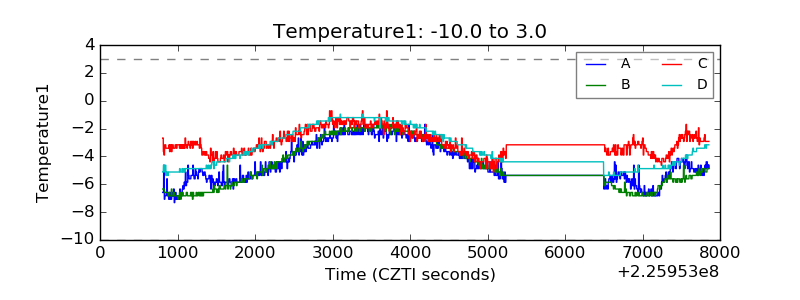 |
| Veto HV Monitor | 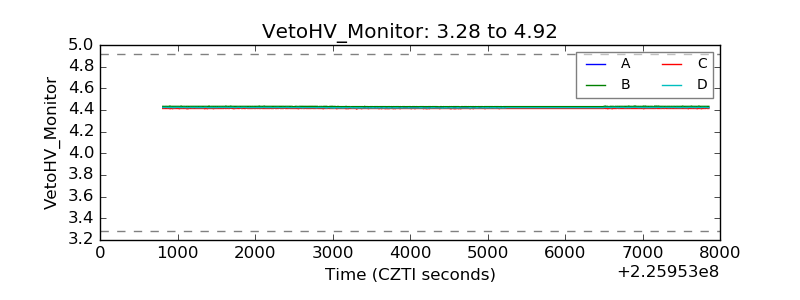 |
| Veto LLD | 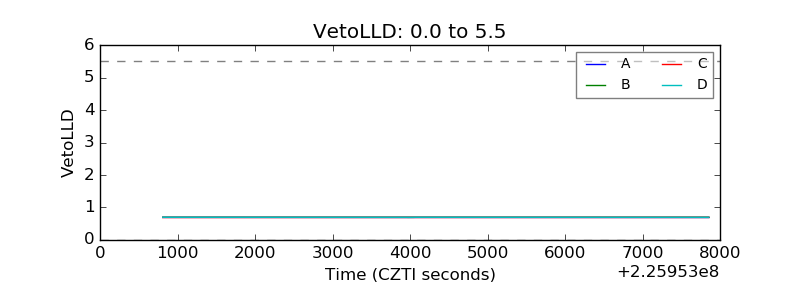 |
| Alpha Counter | 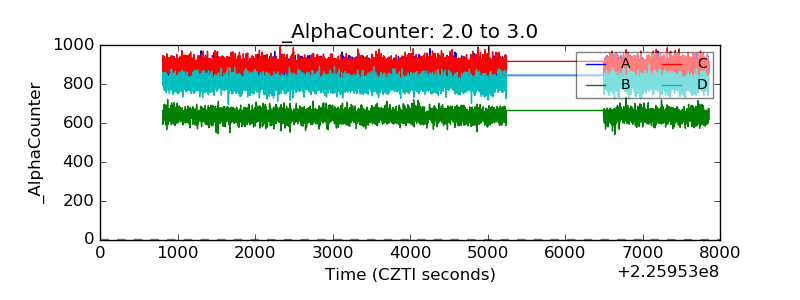 |
| _CPM_Rate | 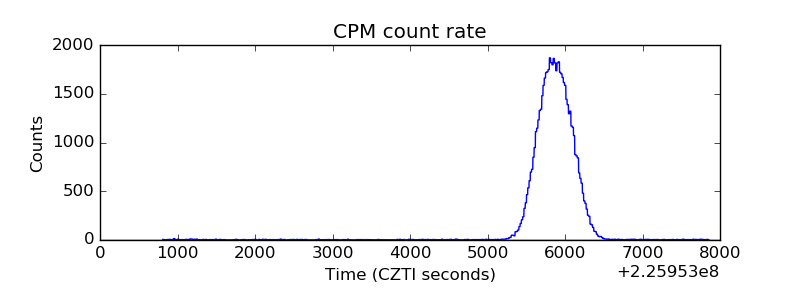 |
| CZT Counter | 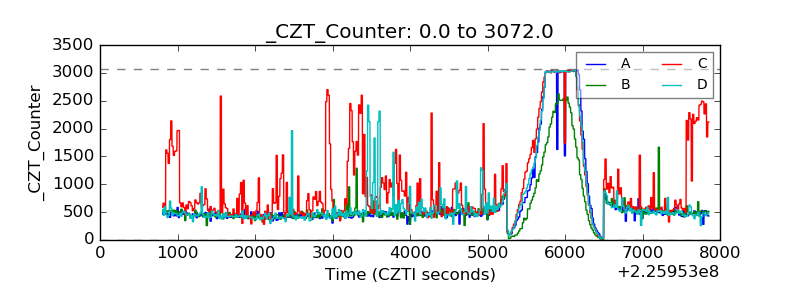 |
| +2.5 Volts monitor |  |
| +5 Volts monitor | 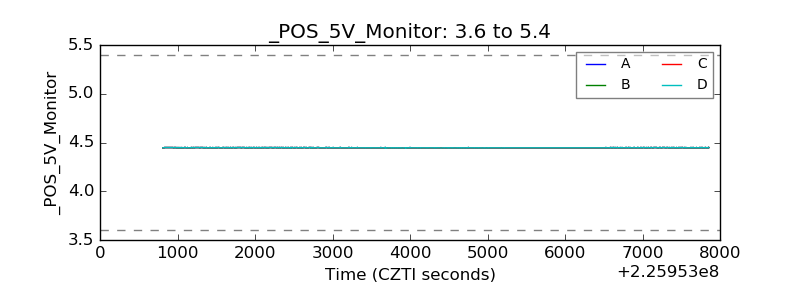 |
| _ROLL_ROT | 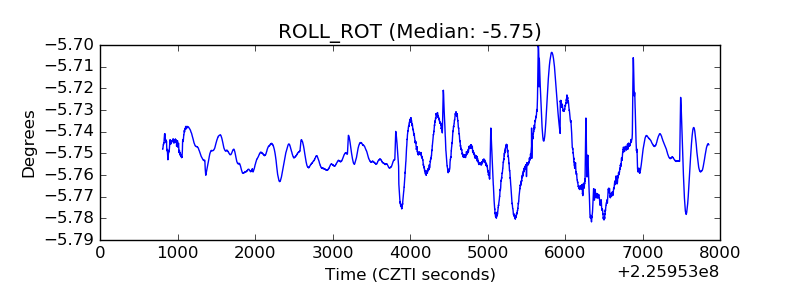 |
| _Roll_DEC |  |
| _Roll_RA | 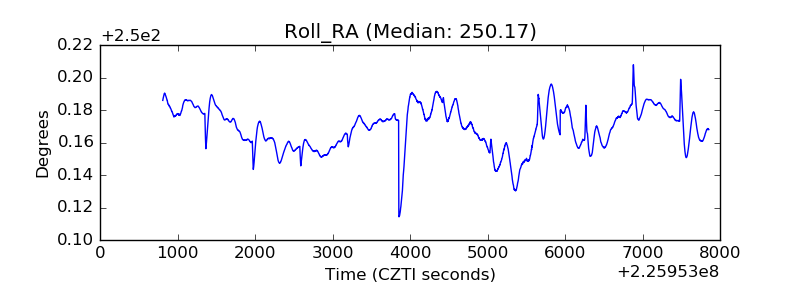 |
| Veto Counter | 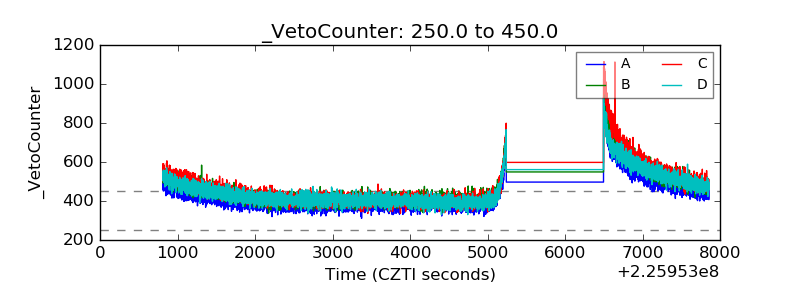 |