| Param | Original file | Final file |
|---|---|---|
| Filename | modeM0/AS1G06_104T01_9000001060_07685cztM0_level2.evt | modeM0/AS1G06_104T01_9000001060_07685cztM0_level2_quad_clean.evt |
| Size (bytes) | 632,165,760 | 86,757,120 |
| Size | 602.9 MB | 82.7 MB |
| Events in quadrant A | 2,900,402 | 582,500 |
| Events in quadrant B | 3,011,502 | 594,721 |
| Events in quadrant C | 9,668,057 | 491,447 |
| Events in quadrant D | 3,168,857 | 548,110 |
| Mode SS | |||
|---|---|---|---|
| Quadrant | BADHDUFLAG | Total packets | Discarded packets |
| A | 0 | 120 | 0 |
| B | 0 | 120 | 0 |
| C | 0 | 120 | 0 |
| D | 0 | 120 | 0 |
| Mode M9 | |||
|---|---|---|---|
| Quadrant | BADHDUFLAG | Total packets | Discarded packets |
| A | 0 | 13 | 0 |
| B | 0 | 13 | 0 |
| C | 0 | 13 | 0 |
| D | 0 | 13 | 0 |
| Mode M0 | |||
|---|---|---|---|
| Quadrant | BADHDUFLAG | Total packets | Discarded packets |
| A | 0 | 12169 | 2 |
| B | 0 | 12467 | 1 |
| C | 0 | 32732 | 1 |
| D | 0 | 13033 | 1 |
| Quadrant | Total seconds | Saturated seconds | Saturation percentage |
|---|---|---|---|
| A | 5862 | 57 | 0.972364% |
| B | 5862 | 56 | 0.955305% |
| C | 5862 | 1817 | 30.996247% |
| D | 5862 | 62 | 1.057660% |
Noise dominated data is calculated using 1-second bins in cleaned event files. If a bin has >2000 counts, and if more than 50% of those come from <1% of pixels, then it is considered to be noise-dominated and hence unusable.
| Quadrant | # 1 sec bins | Bins with >0 counts | Bins with >2000 counts | High rate bins dominated by noise | Noise dominated (total time) | Noise dominated (detector-on time) | Marked lightcurve |
|---|---|---|---|---|---|---|---|
| A | 7167 | 5863 | 3 | 3 | 0.04% | 0.05% | 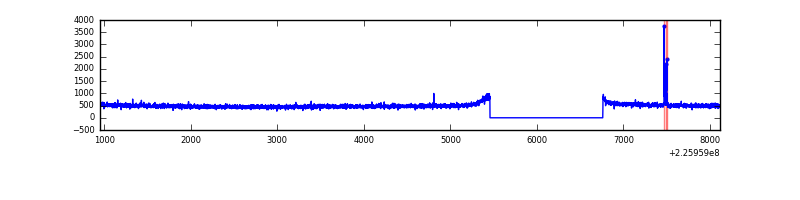 |
| B | 7167 | 5863 | 3 | 3 | 0.04% | 0.05% | 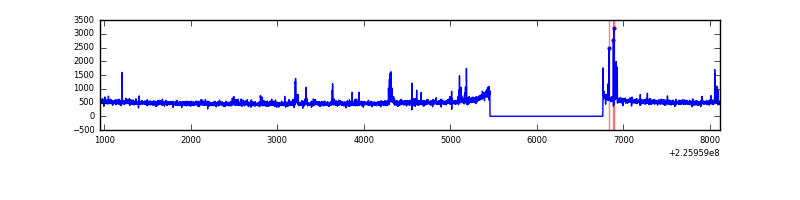 |
| C | 7167 | 5862 | 1655 | 1655 | 23.09% | 28.23% | 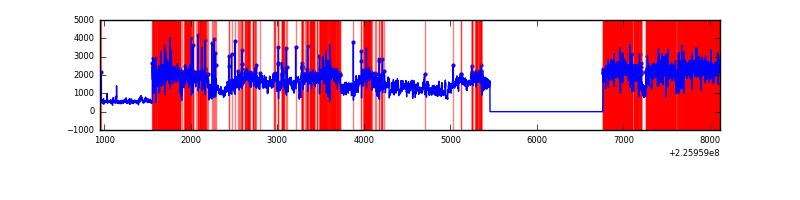 |
| D | 7167 | 5863 | 12 | 12 | 0.17% | 0.20% | 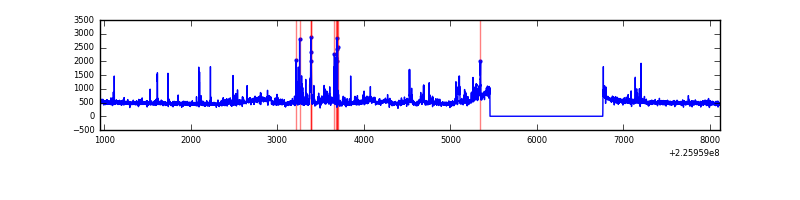 |
Top three noisy pixels from each quadrant. If the there are fewer than three noisy pixels in the level2.evt file, extra rows are filled as -1
| Pixel properties | Quadrant properties | ||||||
|---|---|---|---|---|---|---|---|
| Quadrant | DetID | PixID | Counts | Sigma | Mean | Median | Sigma |
| A | 13 | 248 | 30480 | 199.02 | 745 | 729 | 149.5 |
| A | 0 | 226 | 7188 | 43.21 | 745 | 729 | 149.5 |
| A | 12 | 194 | 6551 | 38.95 | 745 | 729 | 149.5 |
| B | 4 | 173 | 25228 | 177.3 | 744 | 727 | 138.2 |
| B | 4 | 81 | 21916 | 153.34 | 744 | 727 | 138.2 |
| B | 0 | 230 | 20019 | 139.61 | 744 | 727 | 138.2 |
| C | 9 | 68 | 6900599 | 44752.64 | 673 | 677 | 154.2 |
| C | 8 | 208 | 133243 | 859.82 | 673 | 677 | 154.2 |
| C | 13 | 61 | 5068 | 28.48 | 673 | 677 | 154.2 |
| D | 1 | 83 | 144003 | 806.17 | 731 | 708 | 177.7 |
| D | 2 | 152 | 105234 | 588.06 | 731 | 708 | 177.7 |
| D | 13 | 104 | 70914 | 394.98 | 731 | 708 | 177.7 |
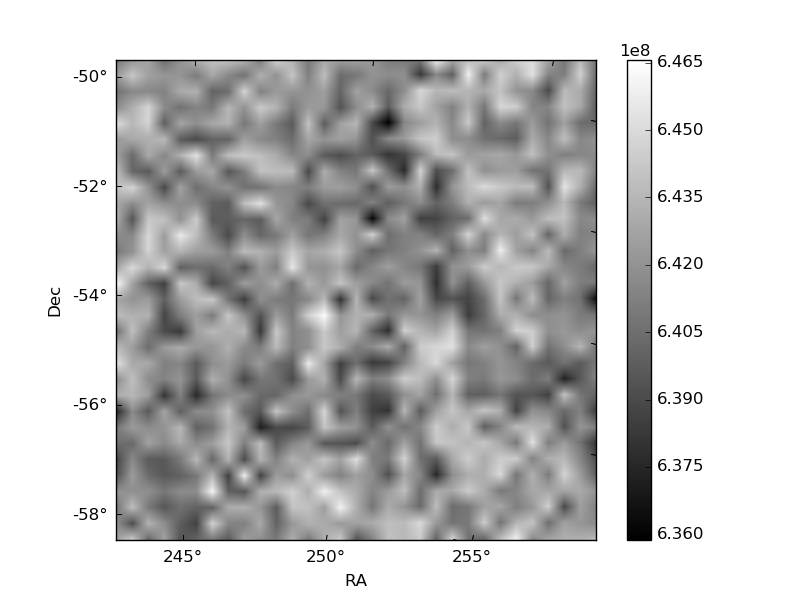
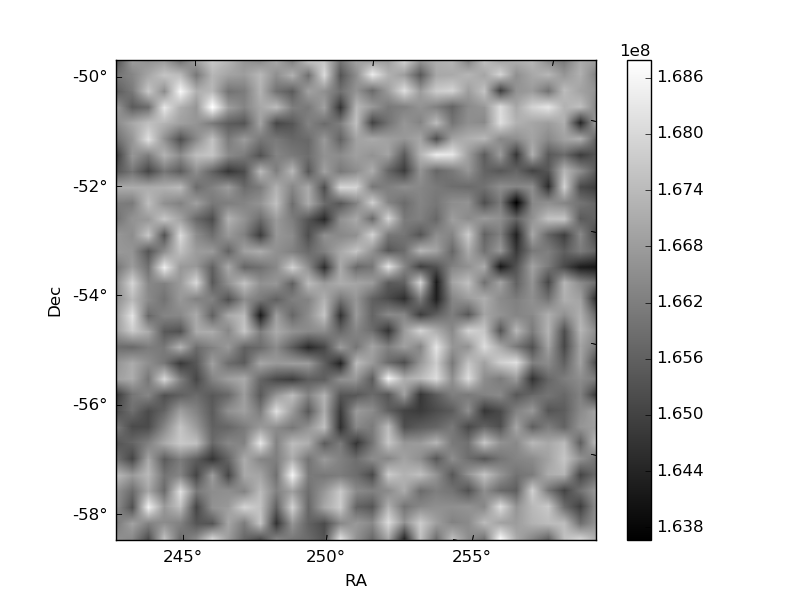
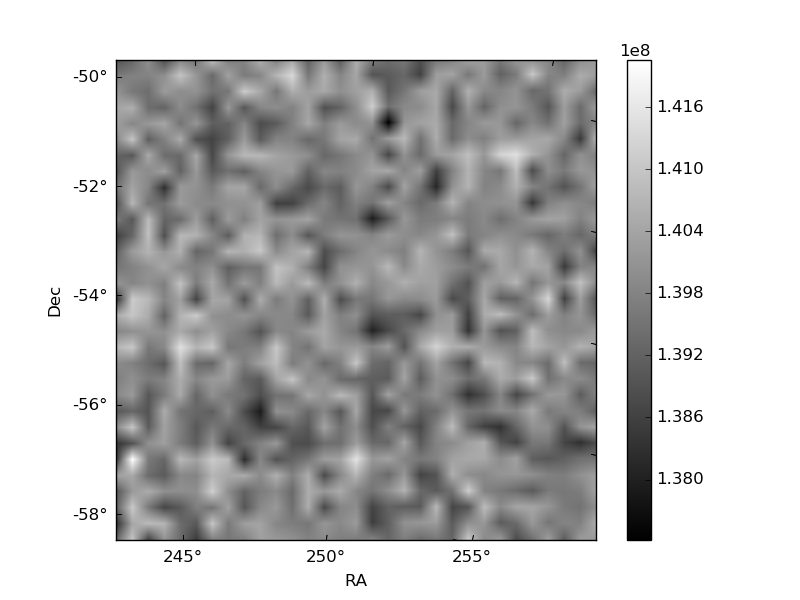
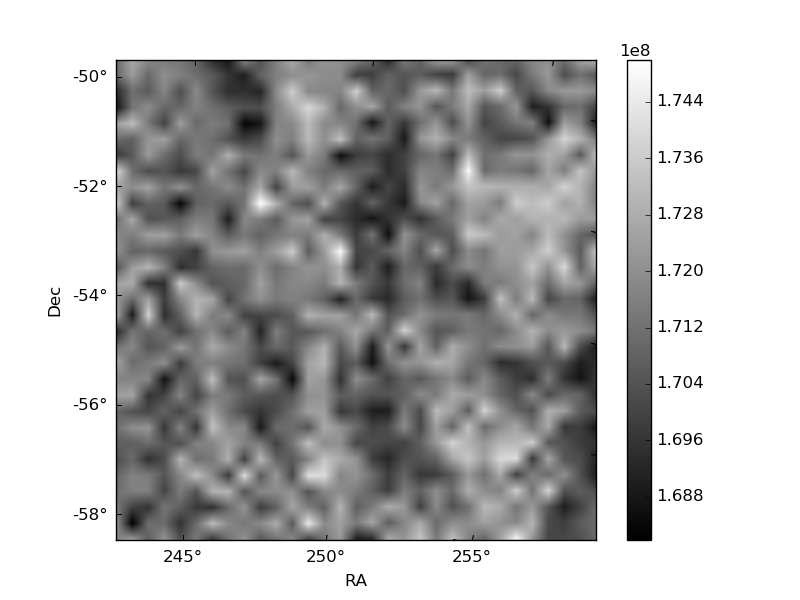
Histogram calculated using DETX and DETY for each event in the final _common_clean file
| Quadrant A | 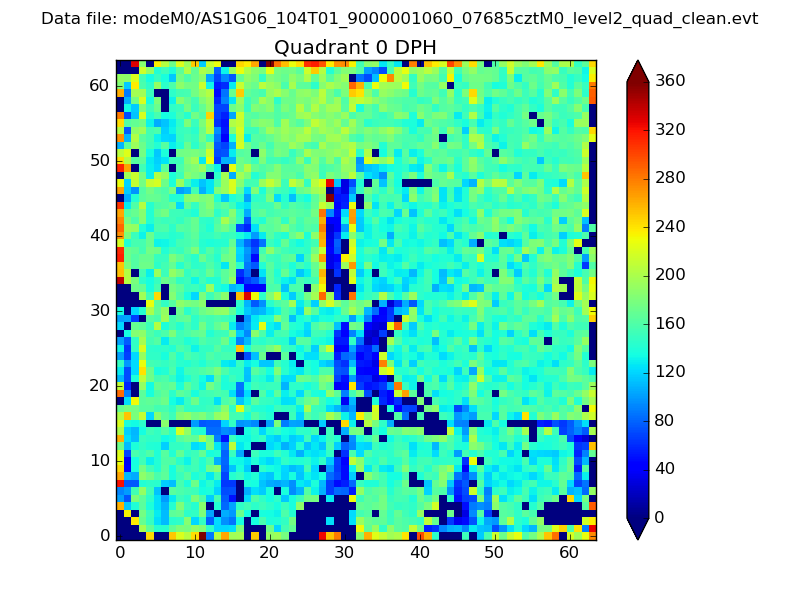 |
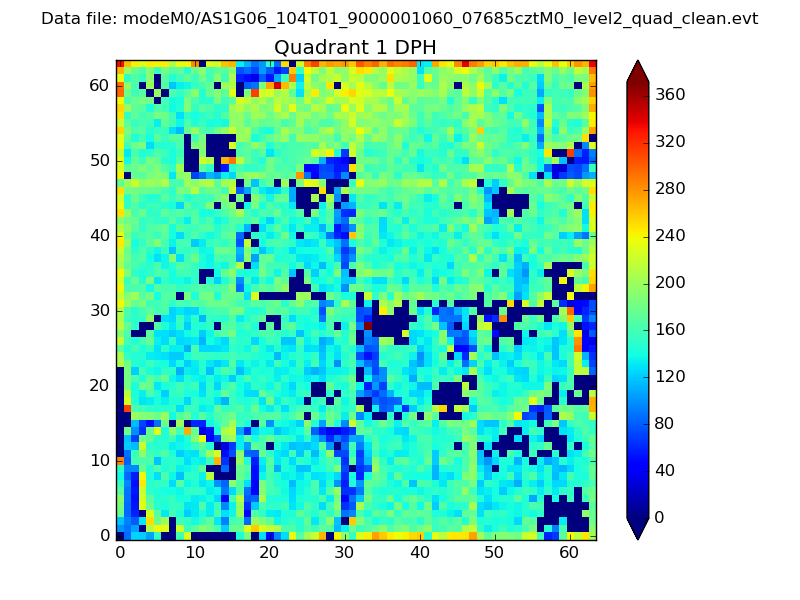 |
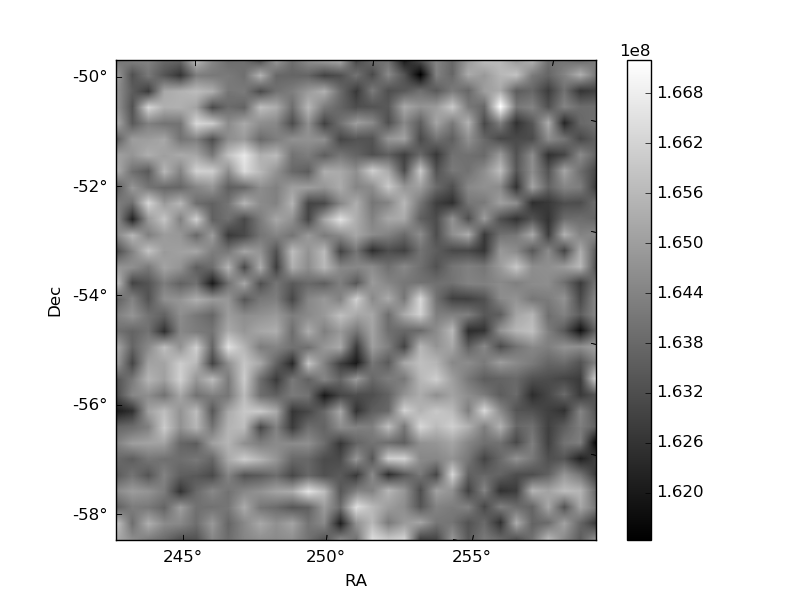
Quadrant B |
|---|---|---|---|
| Quadrant D | 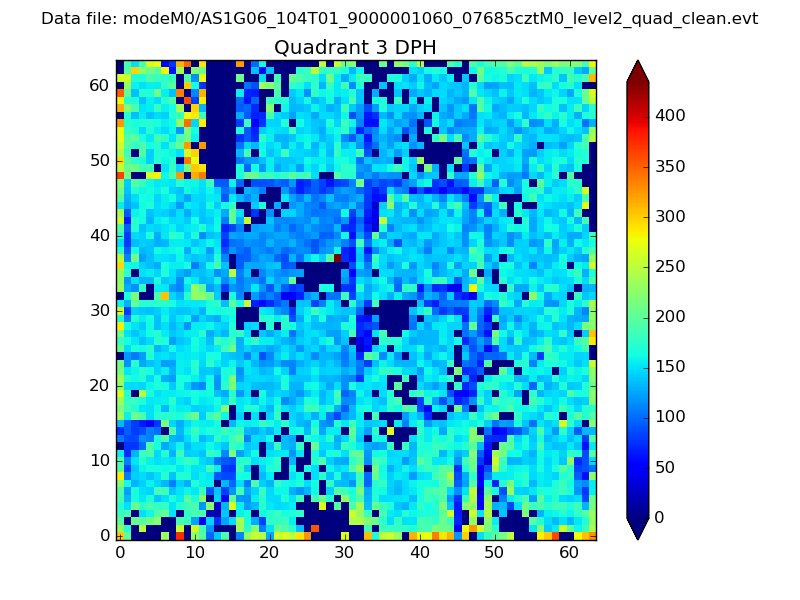 |
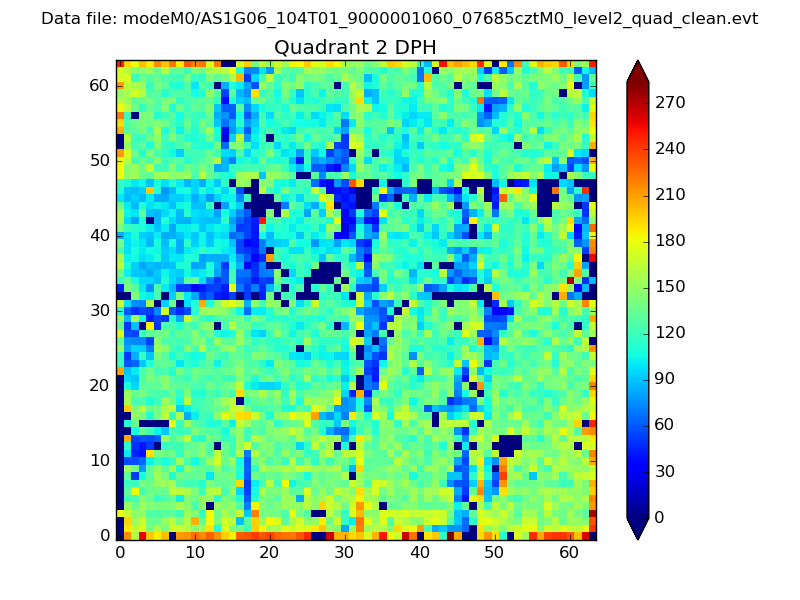 |
Quadrant C |
| Plot type | Count rate plots | Images |
|---|---|---|
| Comparison with Poisson distribution Blue bars denote a histogram of data divided into 1 sec bins. Red curve is a Poisson curve with rate = median count rate of data. |
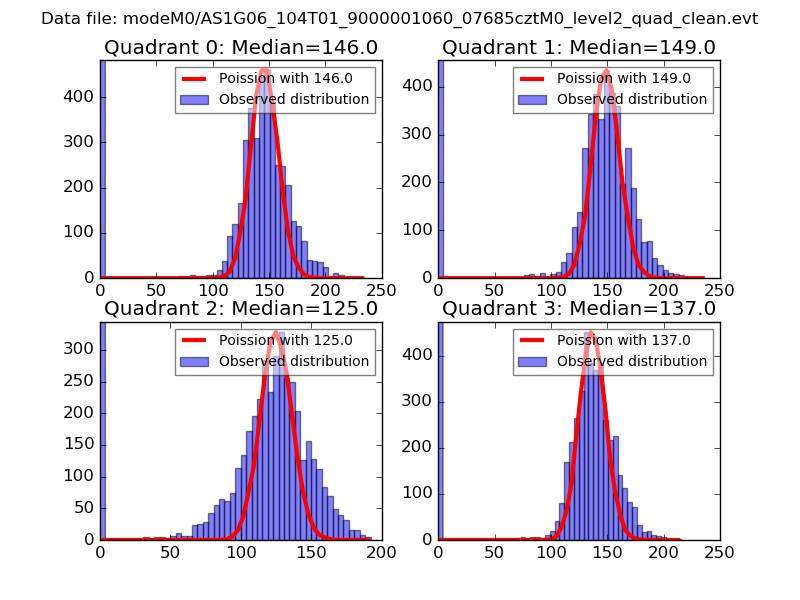 |
 |
| Quadrant-wise count rates Data is divided into 100 sec bins |
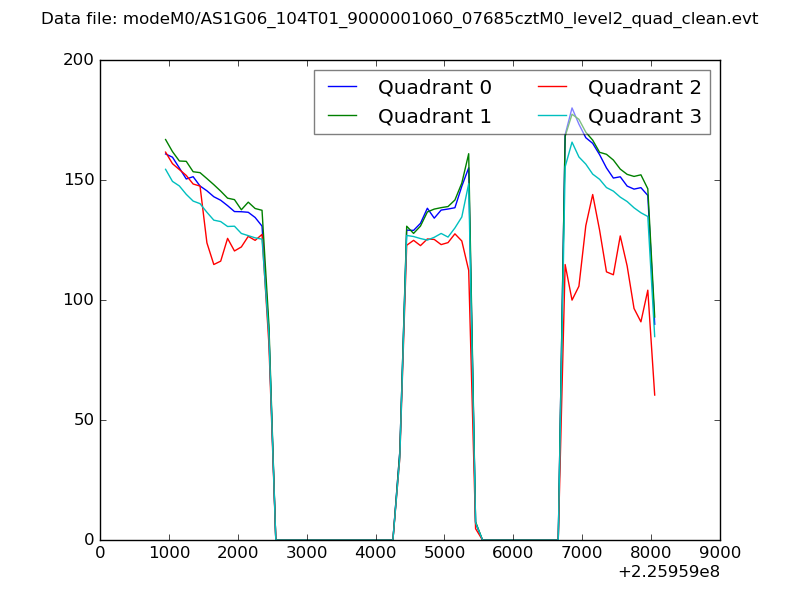 |
|
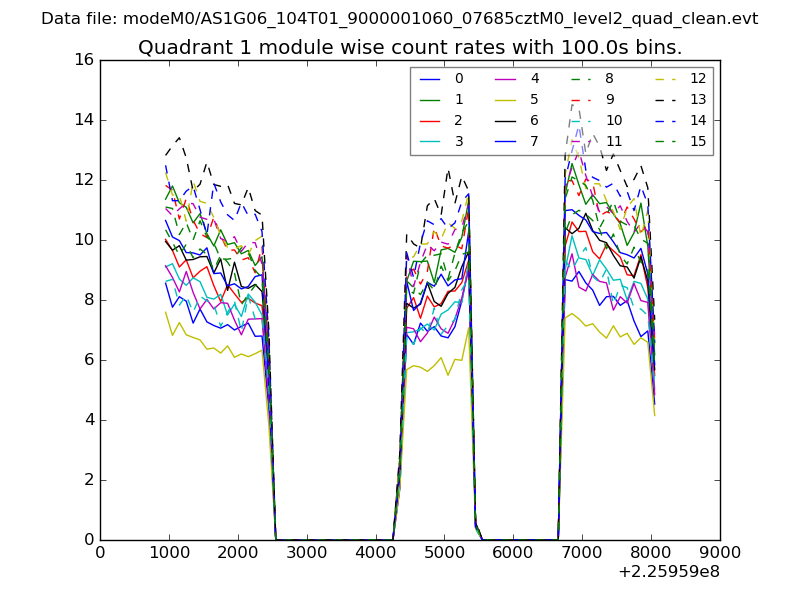
| Module-wise count rates for Quadrant A Data is divided into 100 sec bins |
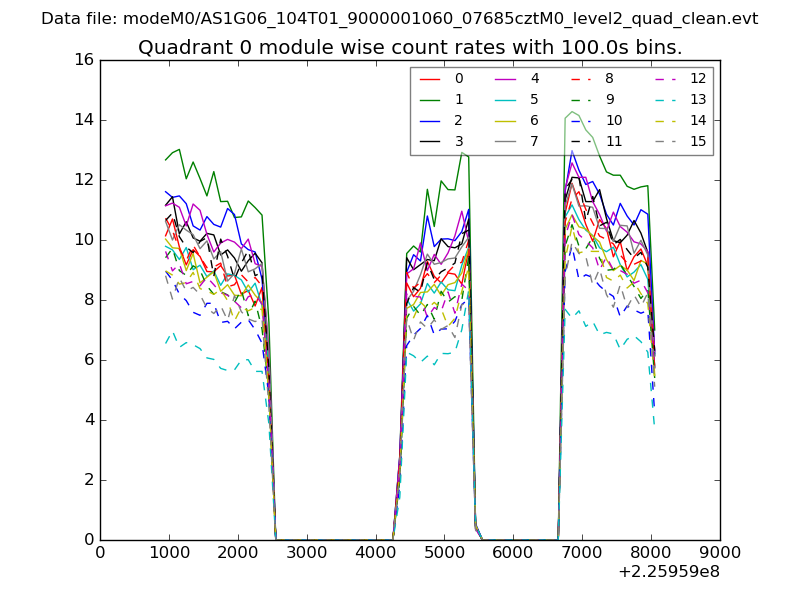 |
 |
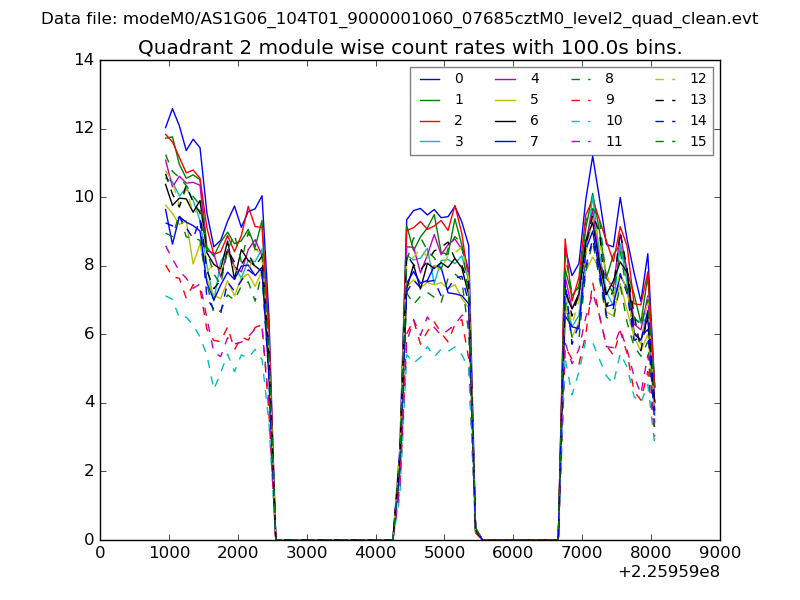
| Module-wise count rates for Quadrant B Data is divided into 100 sec bins |
 |
 |
| Module-wise count rates for Quadrant C Data is divided into 100 sec bins |
 |
 |
| Module-wise count rates for Quadrant D Data is divided into 100 sec bins |
 |
 |
| Parameter | Plot |
|---|---|
| CZT HV Monitor | 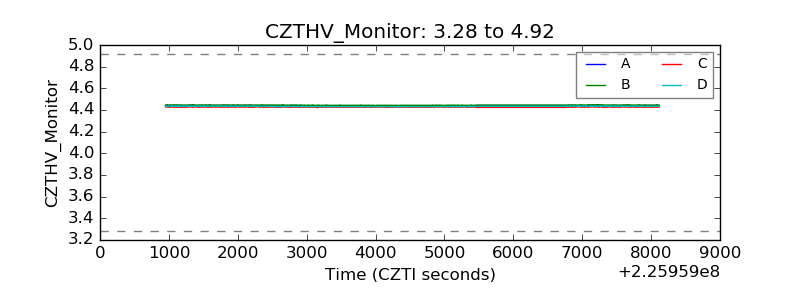 |
| D_VDD | 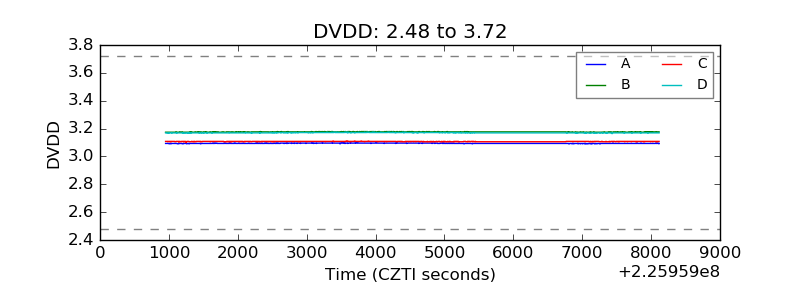 |
| Temperature 1 |  |
| Veto HV Monitor | 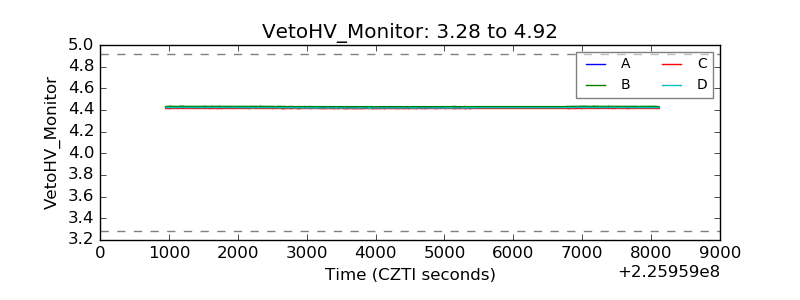 |
| Veto LLD | 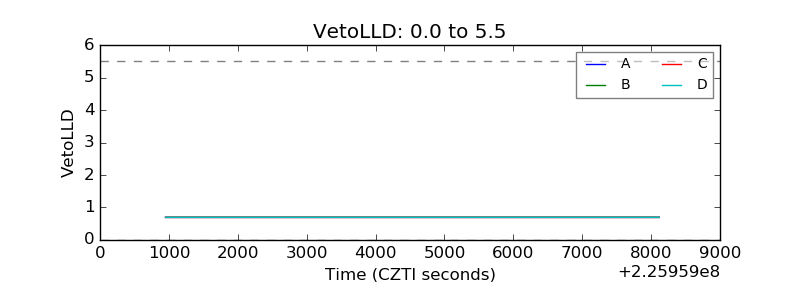 |
| Alpha Counter | 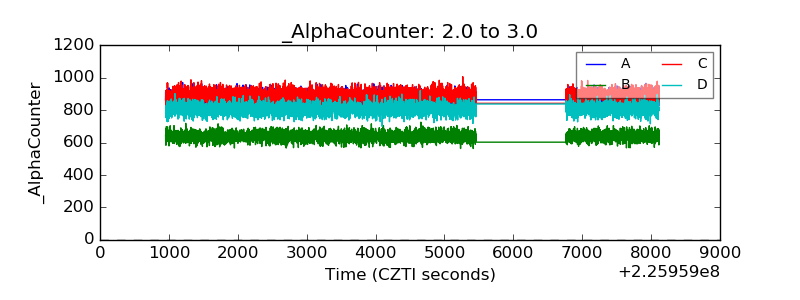 |
| _CPM_Rate | 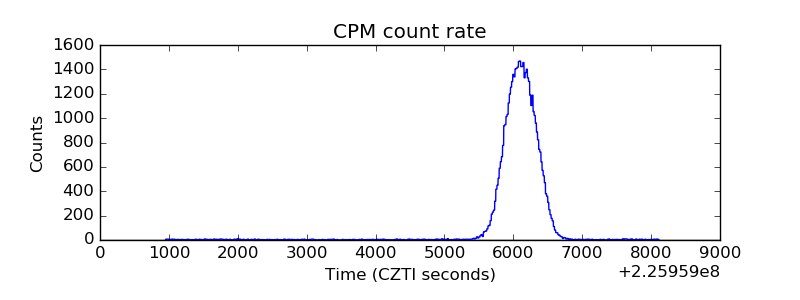 |
| CZT Counter | 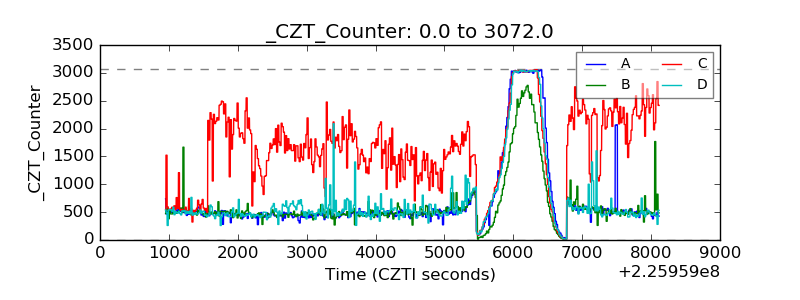 |
| +2.5 Volts monitor |  |
| +5 Volts monitor |  |
| _ROLL_ROT |  |
| _Roll_DEC |  |
| _Roll_RA | 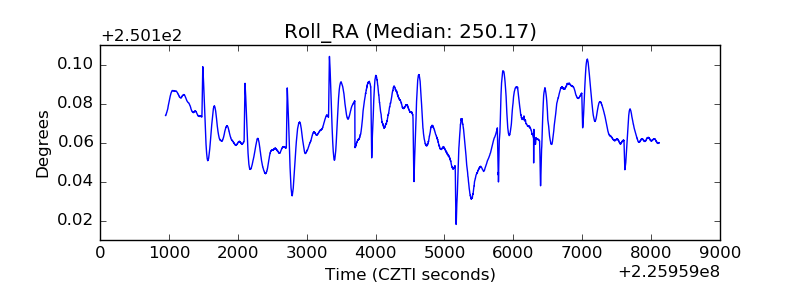 |
| Veto Counter | 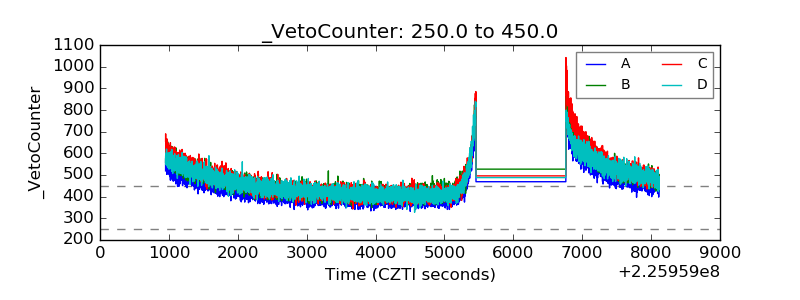 |