| Param | Original file | Final file |
|---|---|---|
| Filename | modeM0/AS1G06_104T01_9000001060_07687cztM0_level2.evt | modeM0/AS1G06_104T01_9000001060_07687cztM0_level2_quad_clean.evt |
| Size (bytes) | 592,243,200 | 81,838,080 |
| Size | 564.8 MB | 78.0 MB |
| Events in quadrant A | 3,130,488 | 519,473 |
| Events in quadrant B | 3,300,780 | 529,127 |
| Events in quadrant C | 7,137,290 | 489,114 |
| Events in quadrant D | 3,923,535 | 483,292 |
| Mode SS | |||
|---|---|---|---|
| Quadrant | BADHDUFLAG | Total packets | Discarded packets |
| A | 0 | 134 | 0 |
| B | 0 | 134 | 0 |
| C | 0 | 134 | 0 |
| D | 0 | 134 | 0 |
| Mode M9 | |||
|---|---|---|---|
| Quadrant | BADHDUFLAG | Total packets | Discarded packets |
| A | 0 | 11 | 0 |
| B | 0 | 11 | 0 |
| C | 0 | 11 | 0 |
| D | 0 | 11 | 0 |
| Mode M0 | |||
|---|---|---|---|
| Quadrant | BADHDUFLAG | Total packets | Discarded packets |
| A | 0 | 13456 | 2 |
| B | 0 | 13774 | 1 |
| C | 0 | 25616 | 1 |
| D | 0 | 15900 | 1 |
| Quadrant | Total seconds | Saturated seconds | Saturation percentage |
|---|---|---|---|
| A | 6550 | 123 | 1.877863% |
| B | 6550 | 113 | 1.725191% |
| C | 6550 | 1110 | 16.946565% |
| D | 6550 | 156 | 2.381679% |
Noise dominated data is calculated using 1-second bins in cleaned event files. If a bin has >2000 counts, and if more than 50% of those come from <1% of pixels, then it is considered to be noise-dominated and hence unusable.
| Quadrant | # 1 sec bins | Bins with >0 counts | Bins with >2000 counts | High rate bins dominated by noise | Noise dominated (total time) | Noise dominated (detector-on time) | Marked lightcurve |
|---|---|---|---|---|---|---|---|
| A | 7655 | 6550 | 0 | 0 | 0.00% | 0.00% | 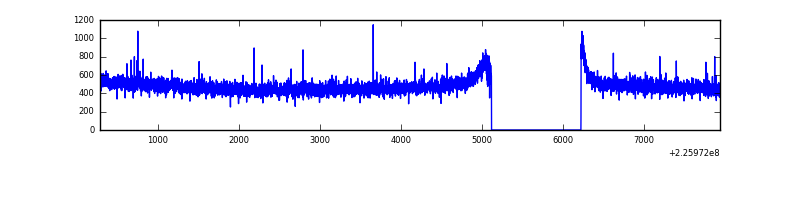 |
| B | 7655 | 6551 | 1 | 1 | 0.01% | 0.02% | 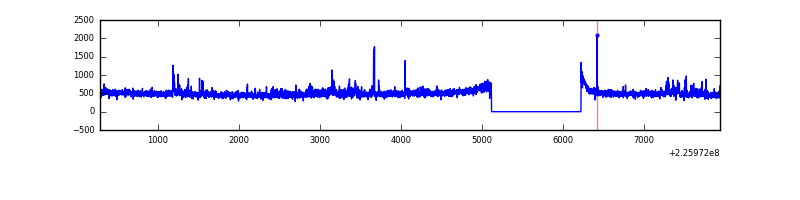 |
| C | 7655 | 6550 | 1125 | 1125 | 14.70% | 17.18% | 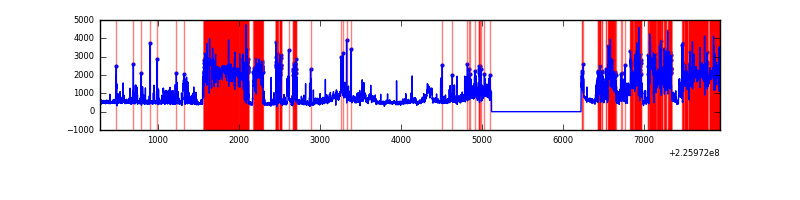 |
| D | 7655 | 6551 | 26 | 26 | 0.34% | 0.40% | 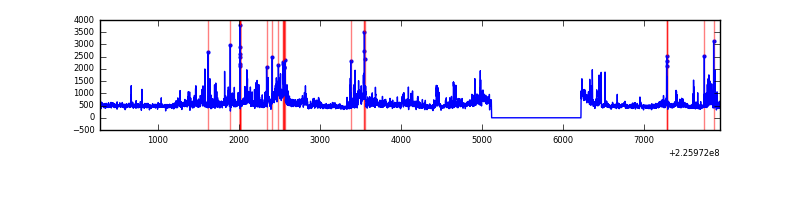 |
Top three noisy pixels from each quadrant. If the there are fewer than three noisy pixels in the level2.evt file, extra rows are filled as -1
| Pixel properties | Quadrant properties | ||||||
|---|---|---|---|---|---|---|---|
| Quadrant | DetID | PixID | Counts | Sigma | Mean | Median | Sigma |
| A | 3 | 1 | 8612 | 48.2 | 807 | 790 | 162.3 |
| A | 0 | 226 | 7639 | 42.2 | 807 | 790 | 162.3 |
| A | 12 | 194 | 7212 | 39.57 | 807 | 790 | 162.3 |
| B | 0 | 219 | 80393 | 526.94 | 807 | 789 | 151.1 |
| B | 0 | 214 | 30501 | 196.68 | 807 | 789 | 151.1 |
| B | 10 | 245 | 14888 | 93.33 | 807 | 789 | 151.1 |
| C | 9 | 68 | 4216852 | 24685.21 | 744 | 748 | 170.8 |
| C | 8 | 208 | 9068 | 48.71 | 744 | 748 | 170.8 |
| C | 13 | 61 | 5765 | 29.37 | 744 | 748 | 170.8 |
| D | 2 | 152 | 640309 | 3349.31 | 787 | 763 | 190.9 |
| D | 12 | 233 | 83977 | 435.79 | 787 | 763 | 190.9 |
| D | 5 | 233 | 75239 | 390.03 | 787 | 763 | 190.9 |
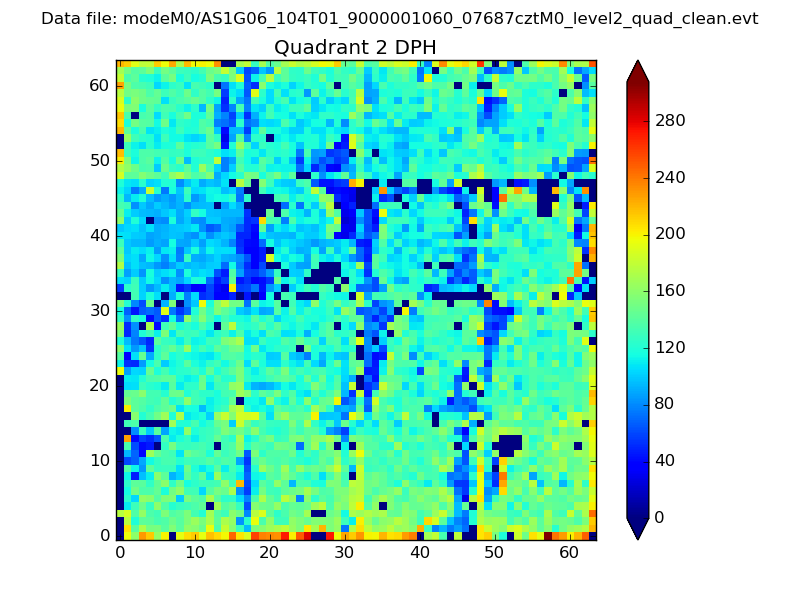
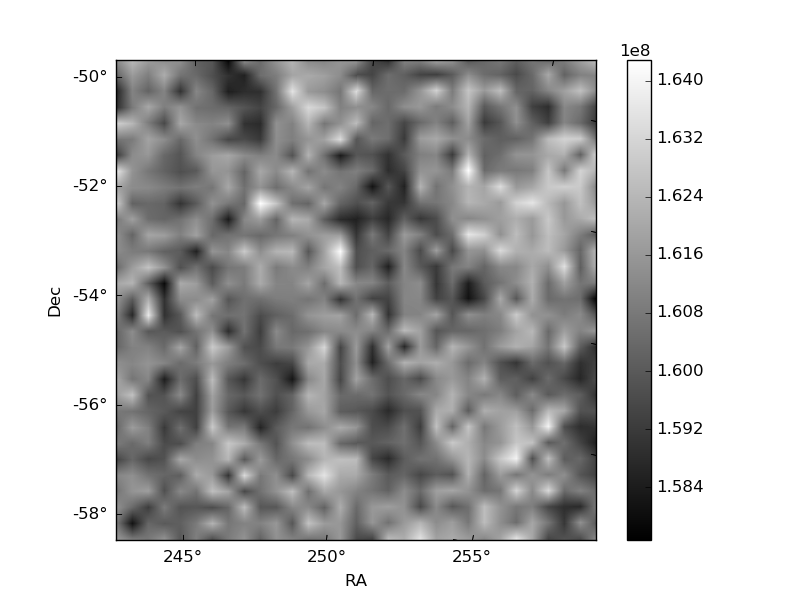
Histogram calculated using DETX and DETY for each event in the final _common_clean file
| Quadrant A | 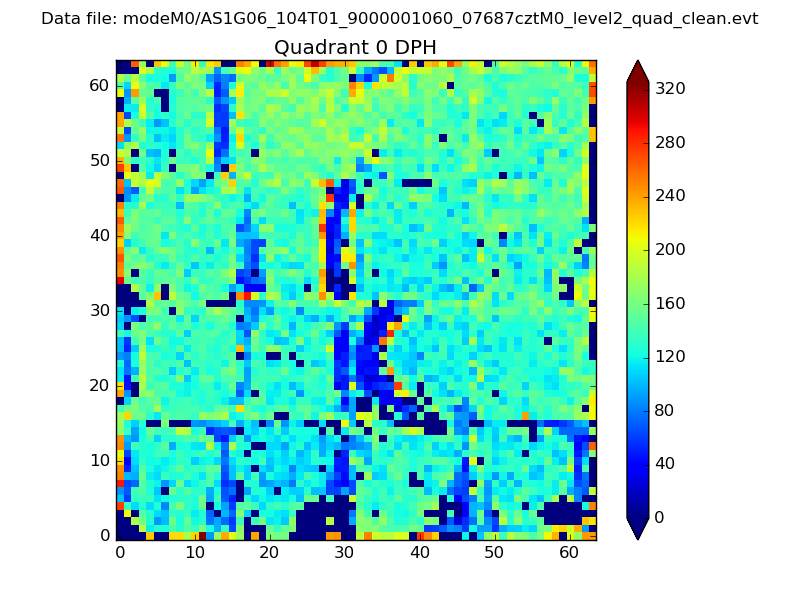 |
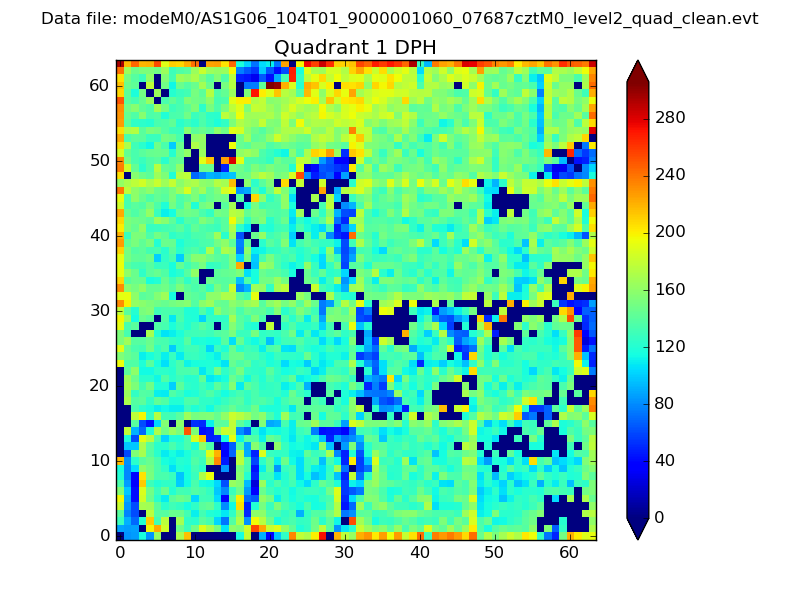 |
Quadrant B |
|---|---|---|---|
| Quadrant D | 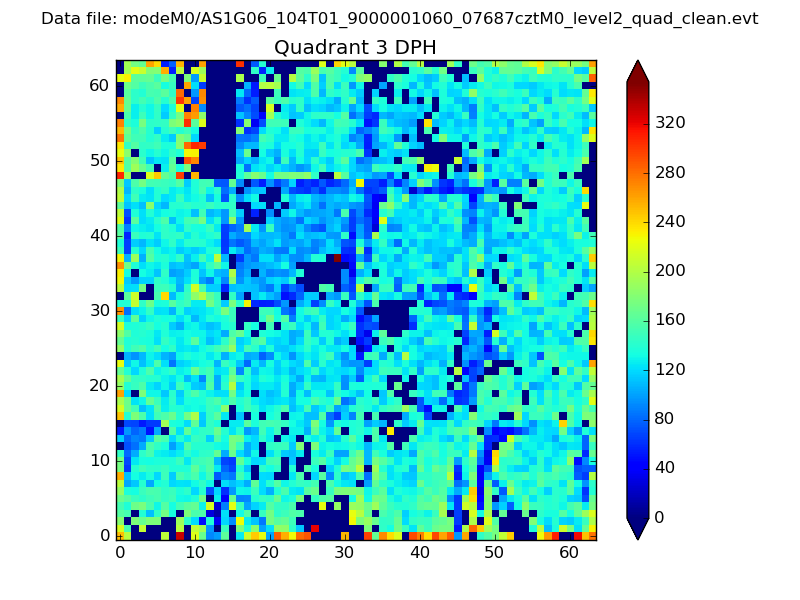 |
 |
Quadrant C |
| Plot type | Count rate plots | Images |
|---|---|---|
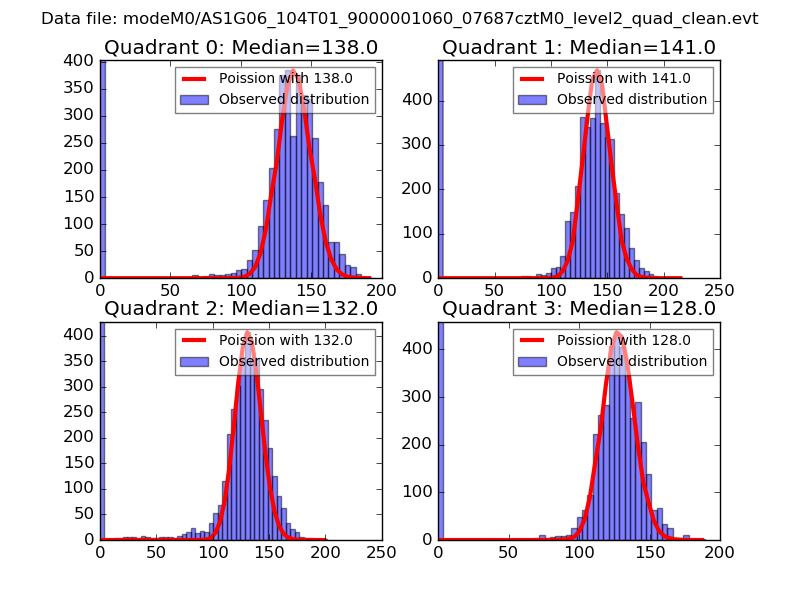
| Comparison with Poisson distribution Blue bars denote a histogram of data divided into 1 sec bins. Red curve is a Poisson curve with rate = median count rate of data. |
 |
 |
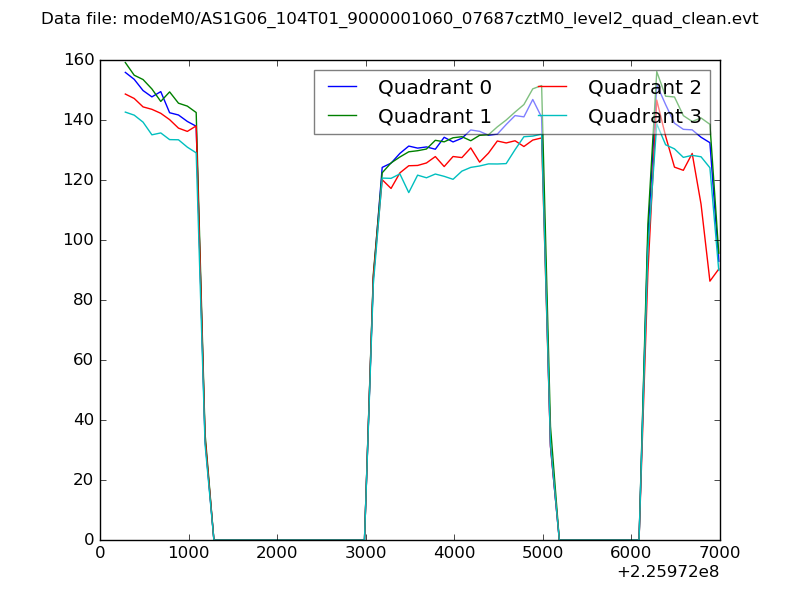
| Quadrant-wise count rates Data is divided into 100 sec bins |
 |
|
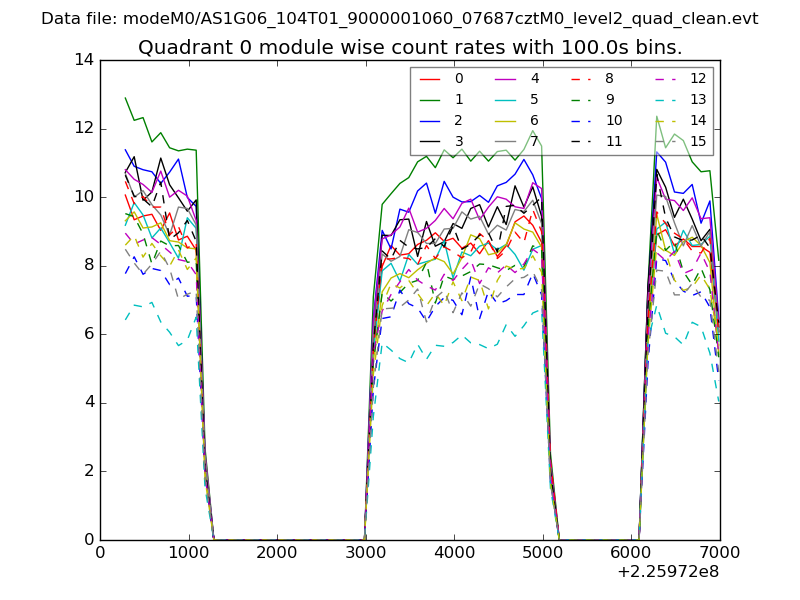
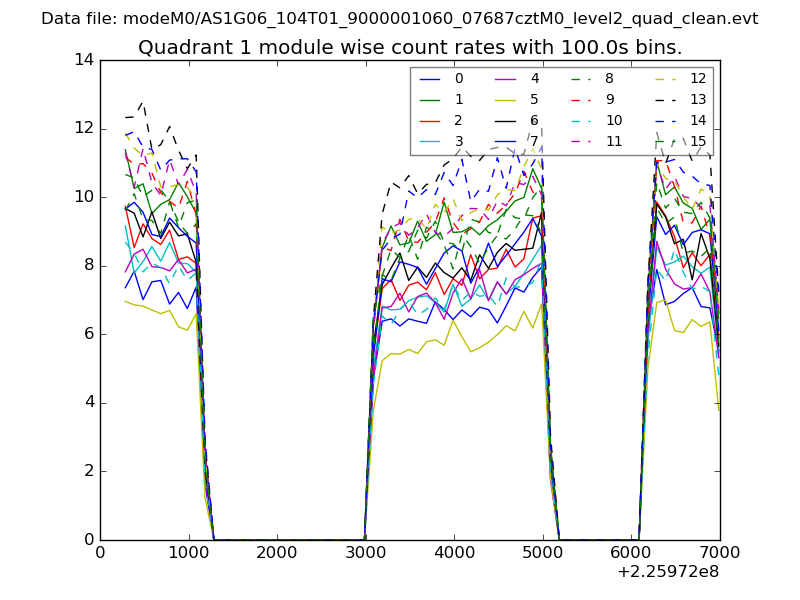
| Module-wise count rates for Quadrant A Data is divided into 100 sec bins |
 |
 |
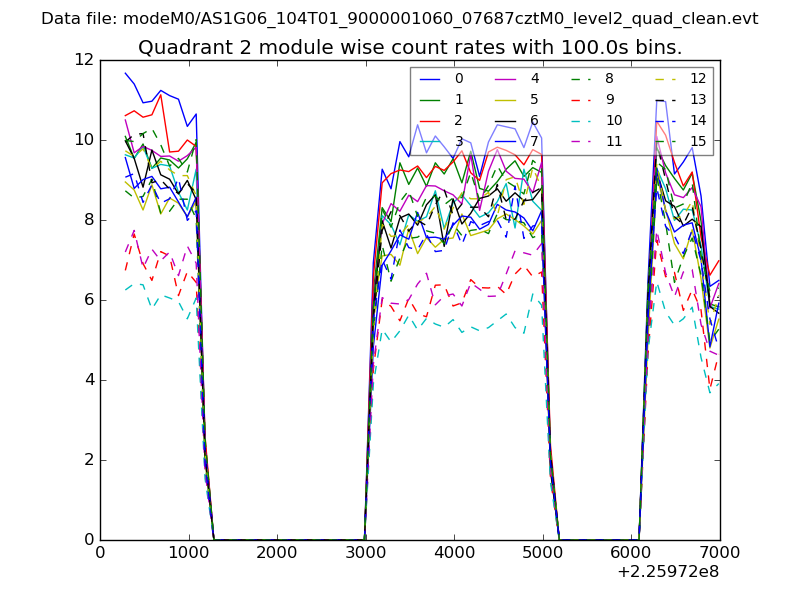
| Module-wise count rates for Quadrant B Data is divided into 100 sec bins |
 |
 |
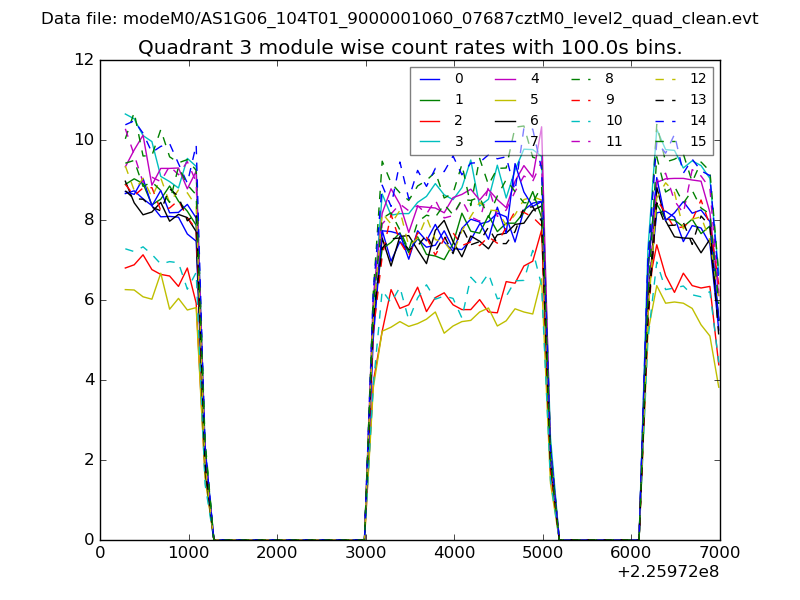
| Module-wise count rates for Quadrant C Data is divided into 100 sec bins |
 |
 |
| Module-wise count rates for Quadrant D Data is divided into 100 sec bins |
 |
 |
| Parameter | Plot |
|---|---|
| CZT HV Monitor | 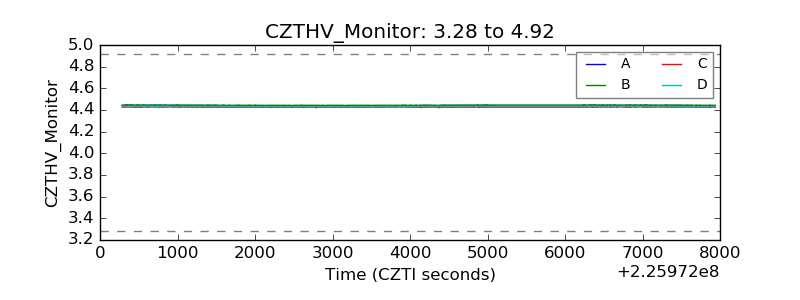 |
| D_VDD | 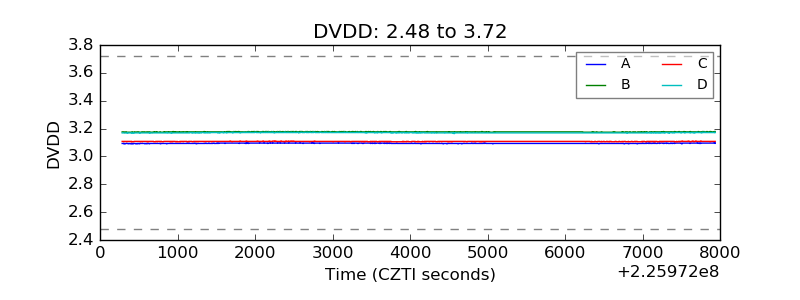 |
| Temperature 1 | 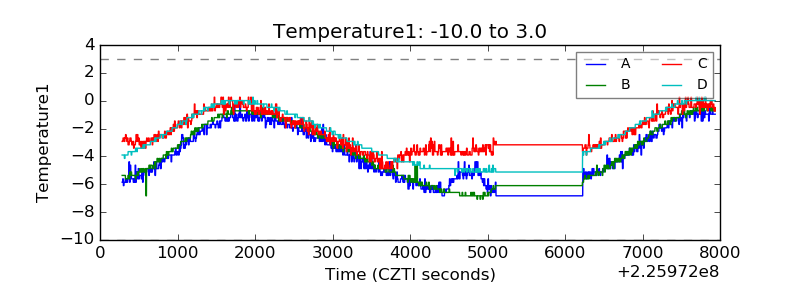 |
| Veto HV Monitor | 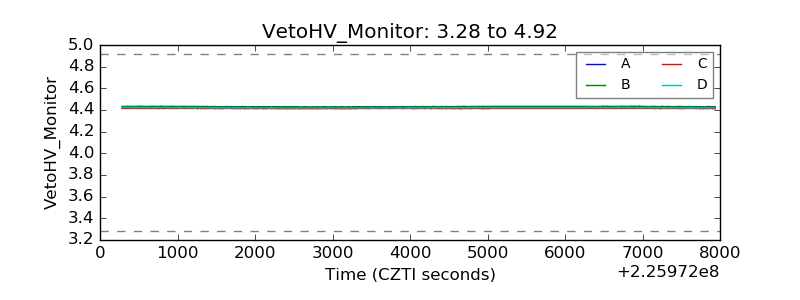 |
| Veto LLD | 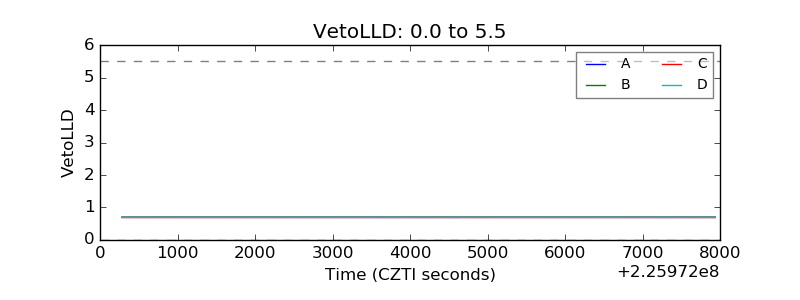 |
| Alpha Counter | 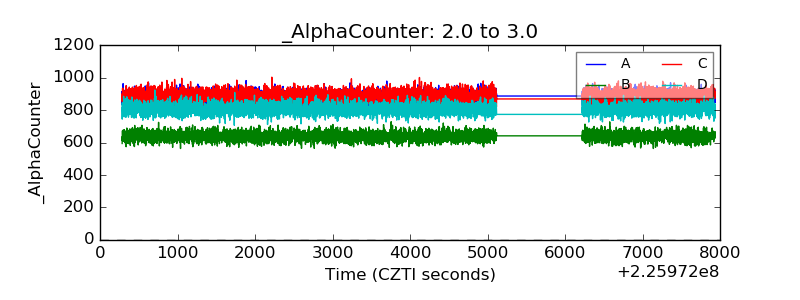 |
| _CPM_Rate | 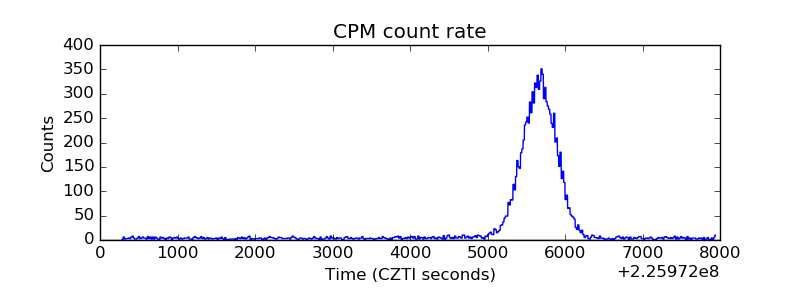 |
| CZT Counter |  |
| +2.5 Volts monitor |  |
| +5 Volts monitor | 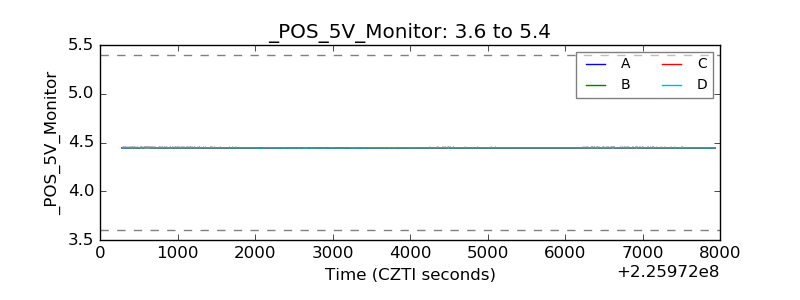 |
| _ROLL_ROT | 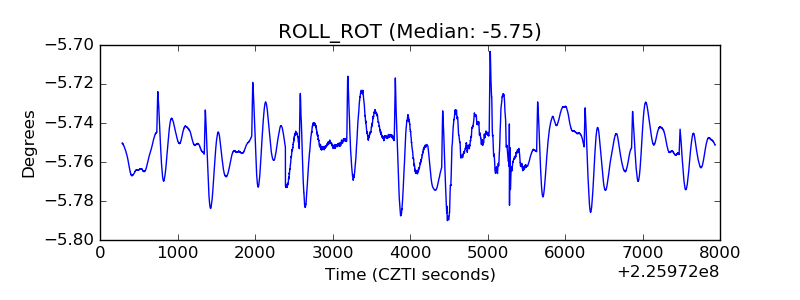 |
| _Roll_DEC | 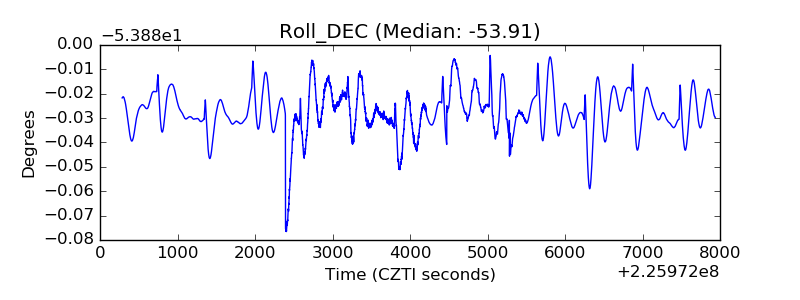 |
| _Roll_RA | 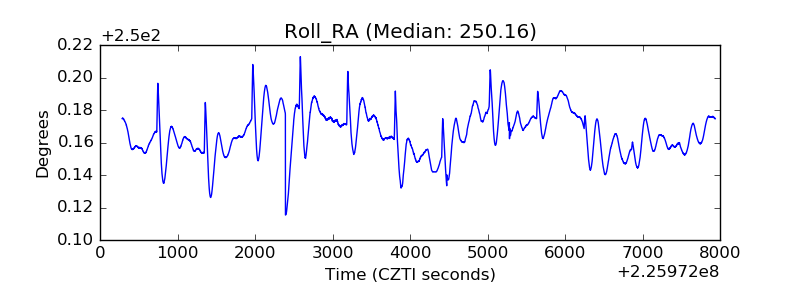 |
| Veto Counter | 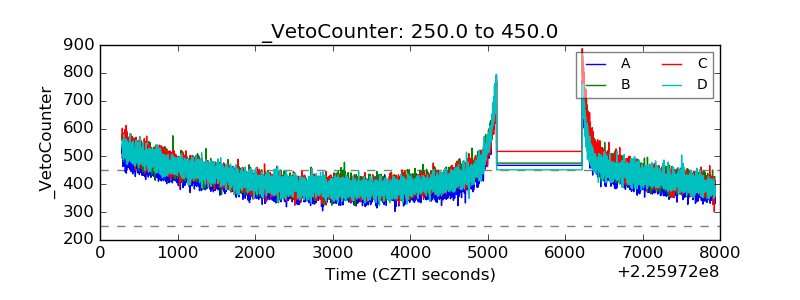 |