| Param | Original file | Final file |
|---|---|---|
| Filename | modeM0/AS1G06_104T01_9000001060_07688cztM0_level2.evt | modeM0/AS1G06_104T01_9000001060_07688cztM0_level2_quad_clean.evt |
| Size (bytes) | 706,472,640 | 71,752,320 |
| Size | 673.7 MB | 68.4 MB |
| Events in quadrant A | 3,066,044 | 450,446 |
| Events in quadrant B | 3,267,701 | 454,383 |
| Events in quadrant C | 11,165,407 | 384,272 |
| Events in quadrant D | 3,448,519 | 421,137 |
| Mode SS | |||
|---|---|---|---|
| Quadrant | BADHDUFLAG | Total packets | Discarded packets |
| A | 0 | 134 | 0 |
| B | 0 | 134 | 0 |
| C | 0 | 134 | 0 |
| D | 0 | 134 | 0 |
| Mode M9 | |||
|---|---|---|---|
| Quadrant | BADHDUFLAG | Total packets | Discarded packets |
| A | 0 | 8 | 0 |
| B | 0 | 8 | 0 |
| C | 0 | 8 | 0 |
| D | 0 | 8 | 0 |
| Mode M0 | |||
|---|---|---|---|
| Quadrant | BADHDUFLAG | Total packets | Discarded packets |
| A | 0 | 13612 | 2 |
| B | 0 | 13901 | 1 |
| C | 0 | 37731 | 1 |
| D | 0 | 14750 | 1 |
| Quadrant | Total seconds | Saturated seconds | Saturation percentage |
|---|---|---|---|
| A | 6625 | 135 | 2.037736% |
| B | 6625 | 141 | 2.128302% |
| C | 6625 | 2280 | 34.415094% |
| D | 6625 | 139 | 2.098113% |
Noise dominated data is calculated using 1-second bins in cleaned event files. If a bin has >2000 counts, and if more than 50% of those come from <1% of pixels, then it is considered to be noise-dominated and hence unusable.
| Quadrant | # 1 sec bins | Bins with >0 counts | Bins with >2000 counts | High rate bins dominated by noise | Noise dominated (total time) | Noise dominated (detector-on time) | Marked lightcurve |
|---|---|---|---|---|---|---|---|
| A | 7440 | 6626 | 0 | 0 | 0.00% | 0.00% | 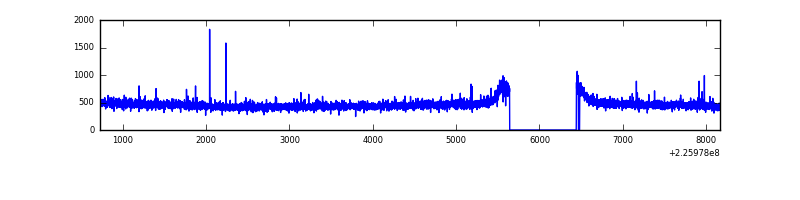 |
| B | 7440 | 6626 | 4 | 4 | 0.05% | 0.06% | 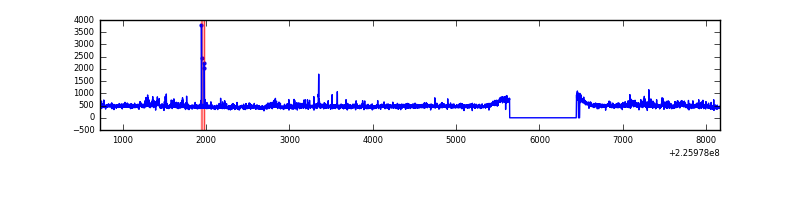 |
| C | 7440 | 6626 | 2156 | 2156 | 28.98% | 32.54% | 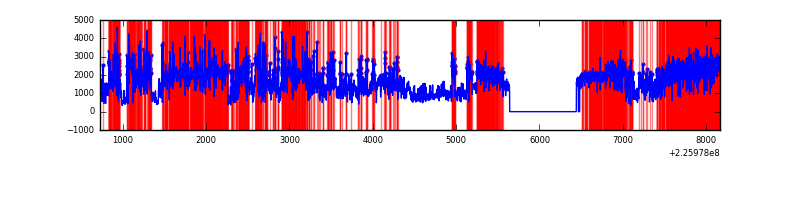 |
| D | 7440 | 6626 | 21 | 21 | 0.28% | 0.32% | 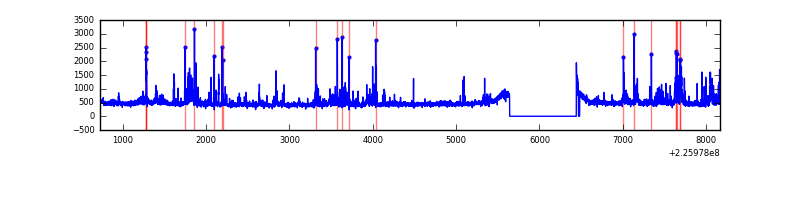 |
Top three noisy pixels from each quadrant. If the there are fewer than three noisy pixels in the level2.evt file, extra rows are filled as -1
| Pixel properties | Quadrant properties | ||||||
|---|---|---|---|---|---|---|---|
| Quadrant | DetID | PixID | Counts | Sigma | Mean | Median | Sigma |
| A | 3 | 1 | 10527 | 60.88 | 789 | 770 | 160.3 |
| A | 0 | 226 | 7491 | 41.93 | 789 | 770 | 160.3 |
| A | 12 | 194 | 7015 | 38.96 | 789 | 770 | 160.3 |
| B | 0 | 219 | 124519 | 827.04 | 789 | 770 | 149.6 |
| B | 0 | 214 | 29535 | 192.24 | 789 | 770 | 149.6 |
| B | 15 | 204 | 16001 | 101.79 | 789 | 770 | 149.6 |
| C | 9 | 68 | 8388743 | 52052.25 | 695 | 698 | 161.1 |
| C | 1 | 16 | 26878 | 162.46 | 695 | 698 | 161.1 |
| C | 8 | 208 | 26162 | 158.02 | 695 | 698 | 161.1 |
| D | 2 | 152 | 193638 | 1028.92 | 770 | 747 | 187.5 |
| D | 12 | 233 | 136419 | 723.7 | 770 | 747 | 187.5 |
| D | 1 | 83 | 87732 | 464.0 | 770 | 747 | 187.5 |
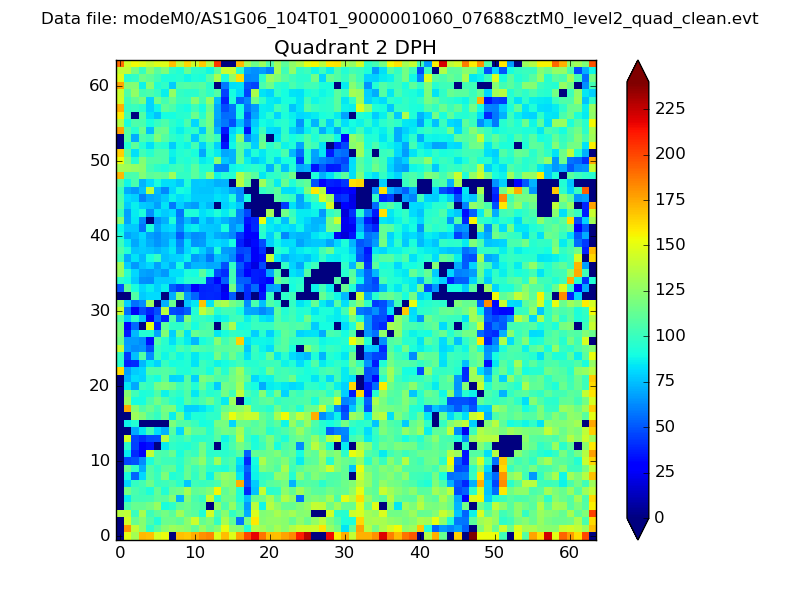
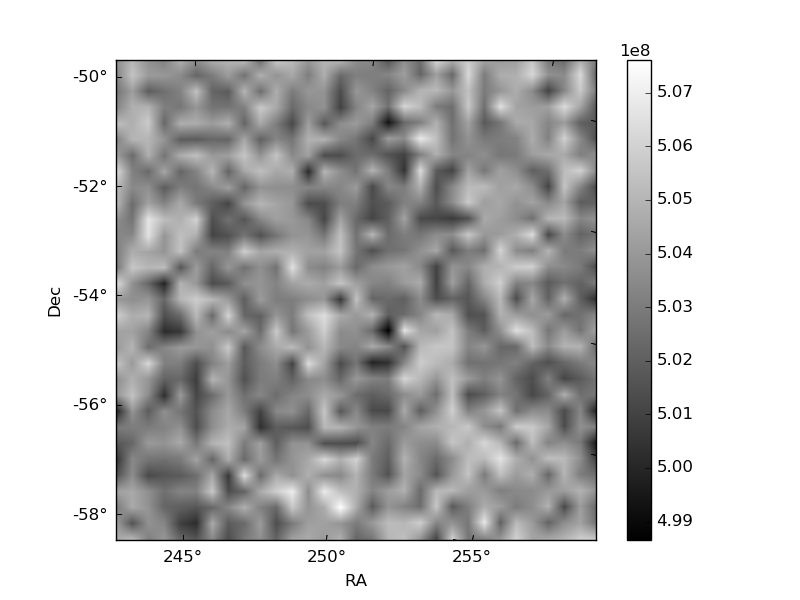
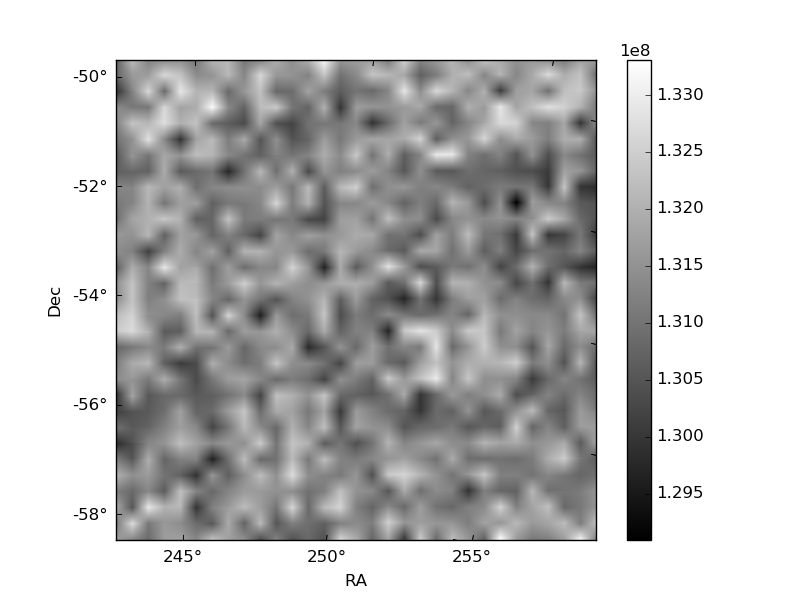
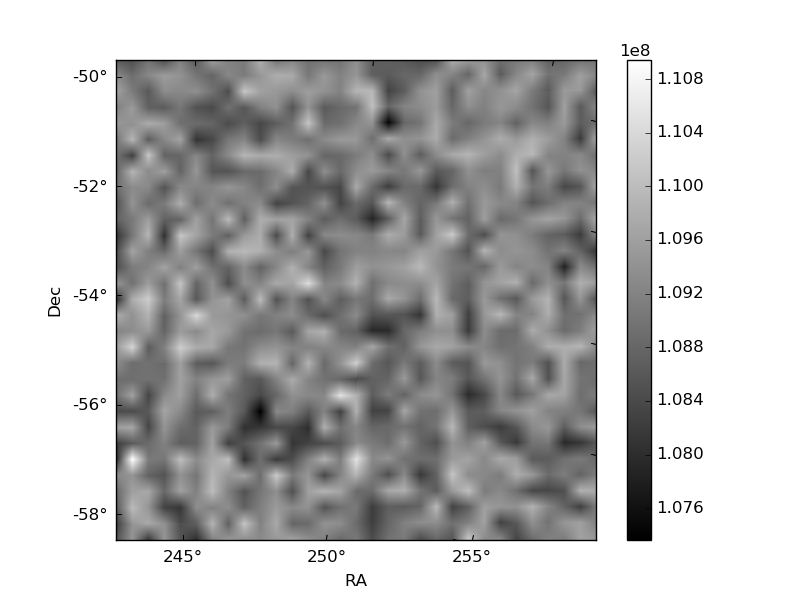
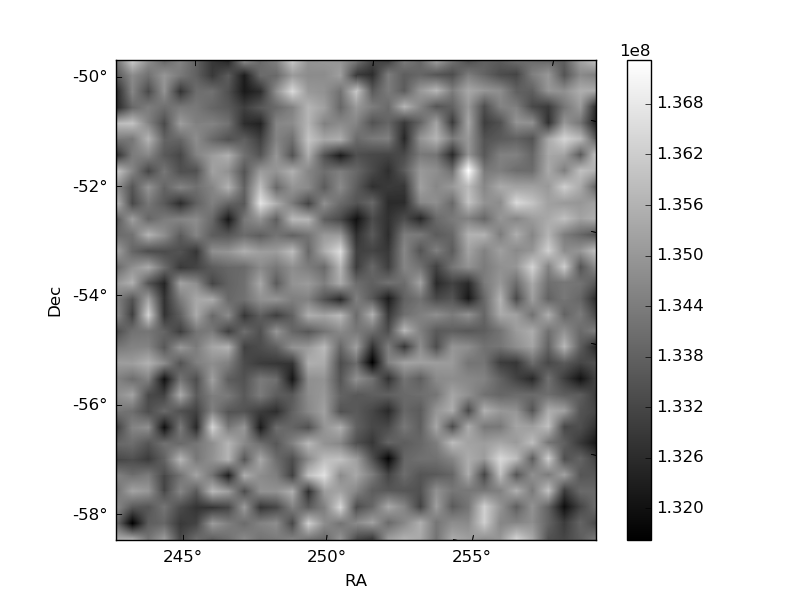
Histogram calculated using DETX and DETY for each event in the final _common_clean file
| Quadrant A | 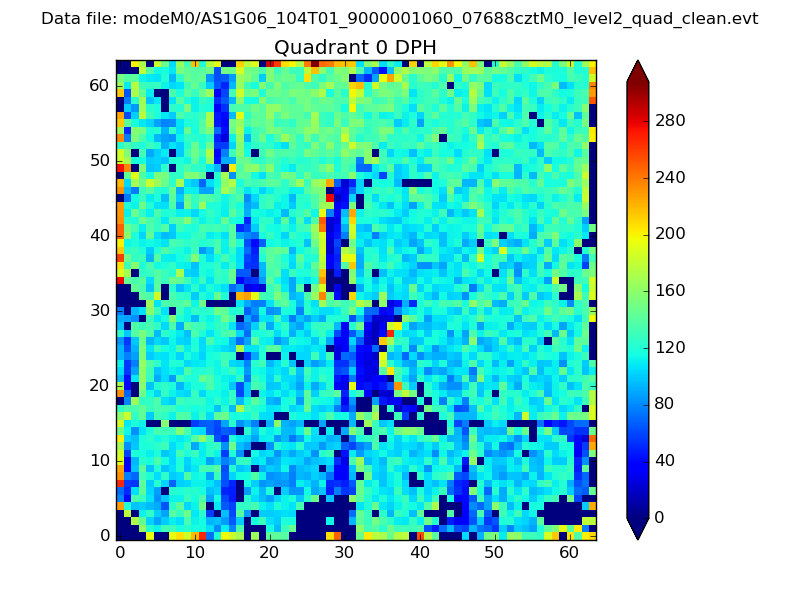 |
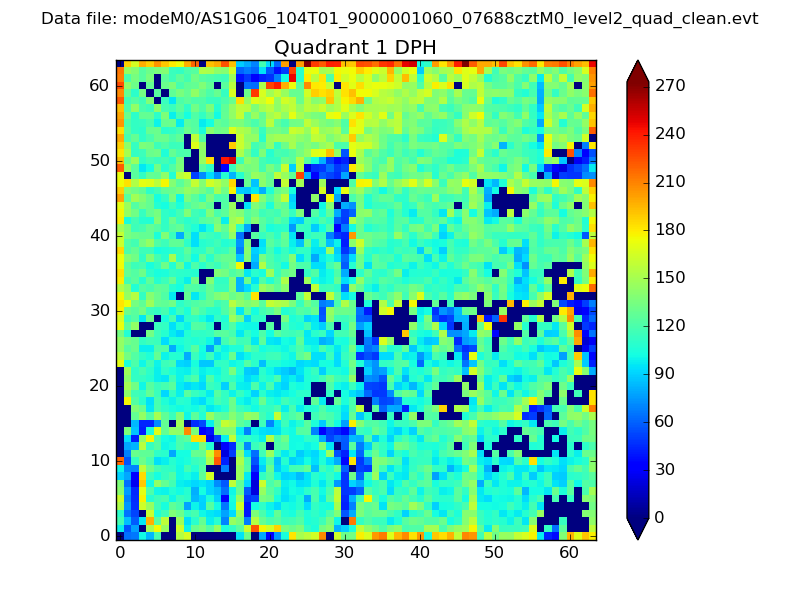 |
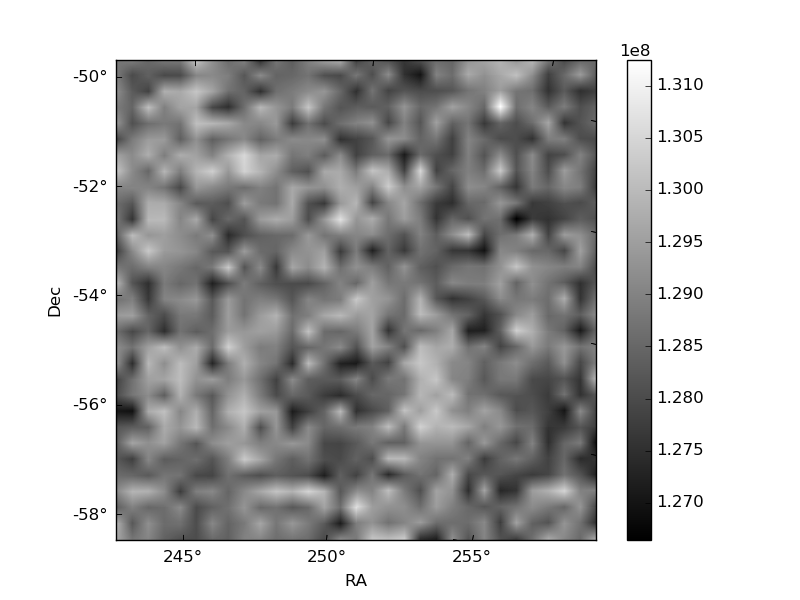
Quadrant B |
|---|---|---|---|
| Quadrant D | 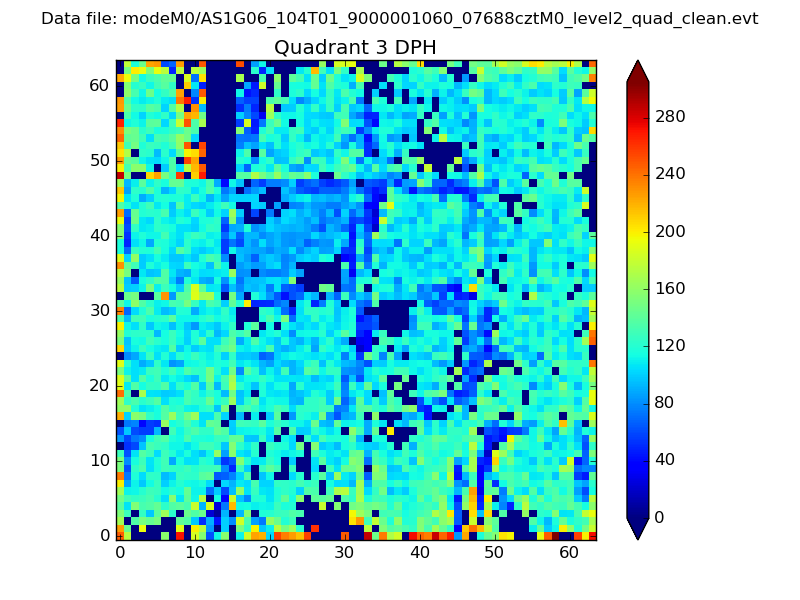 |
 |
Quadrant C |
| Plot type | Count rate plots | Images |
|---|---|---|
| Comparison with Poisson distribution Blue bars denote a histogram of data divided into 1 sec bins. Red curve is a Poisson curve with rate = median count rate of data. |
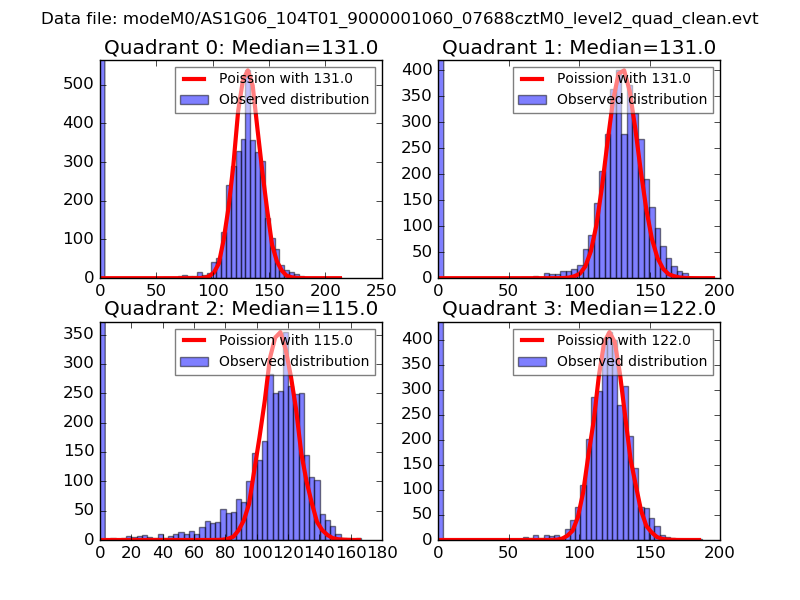 |
 |
| Quadrant-wise count rates Data is divided into 100 sec bins |
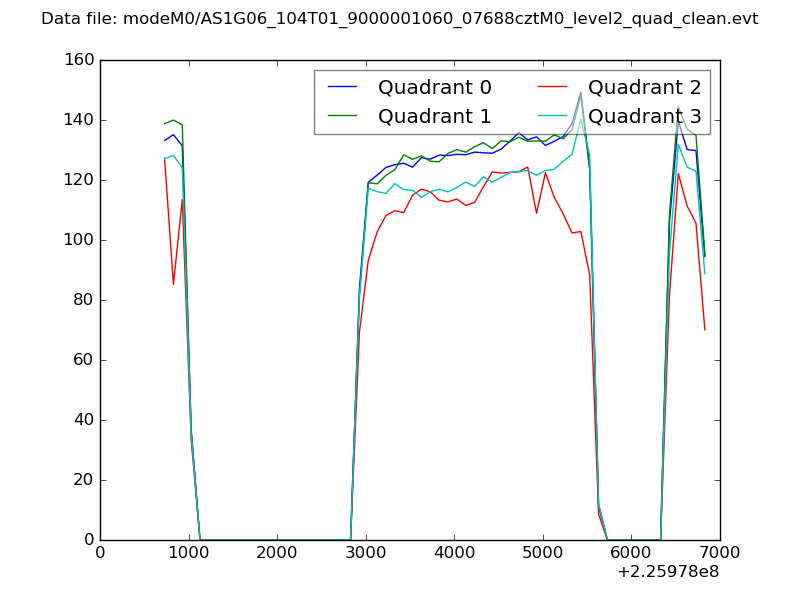 |
|
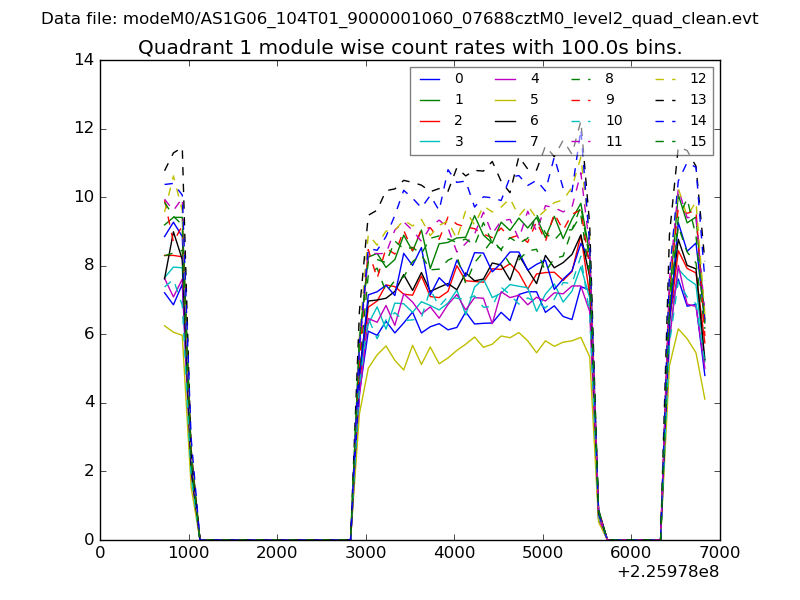
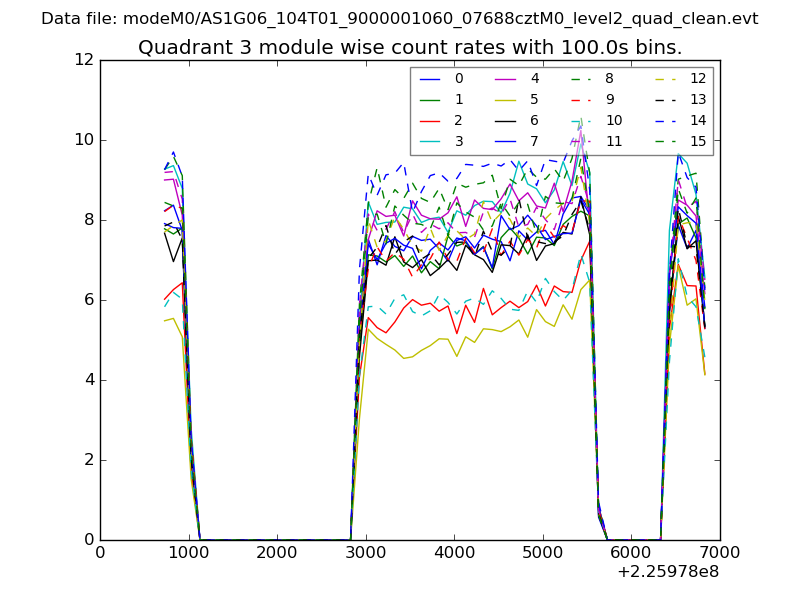
| Module-wise count rates for Quadrant A Data is divided into 100 sec bins |
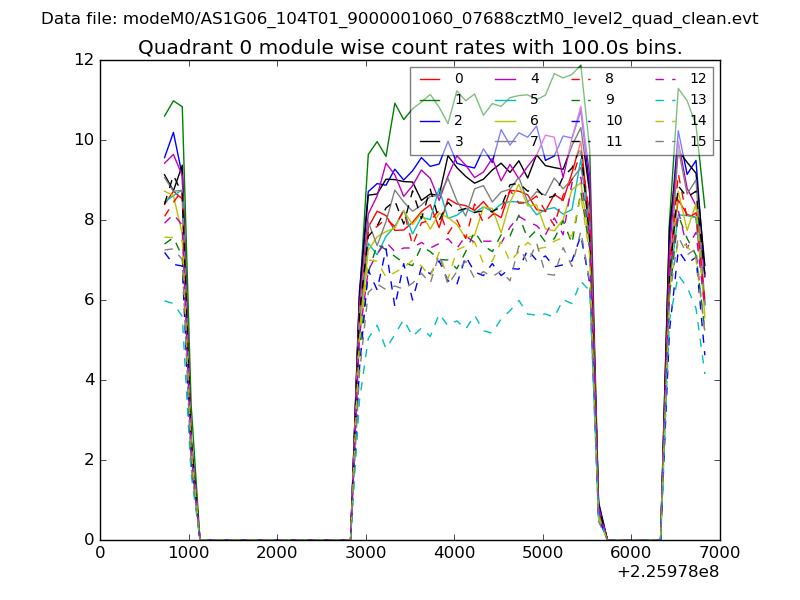 |
 |
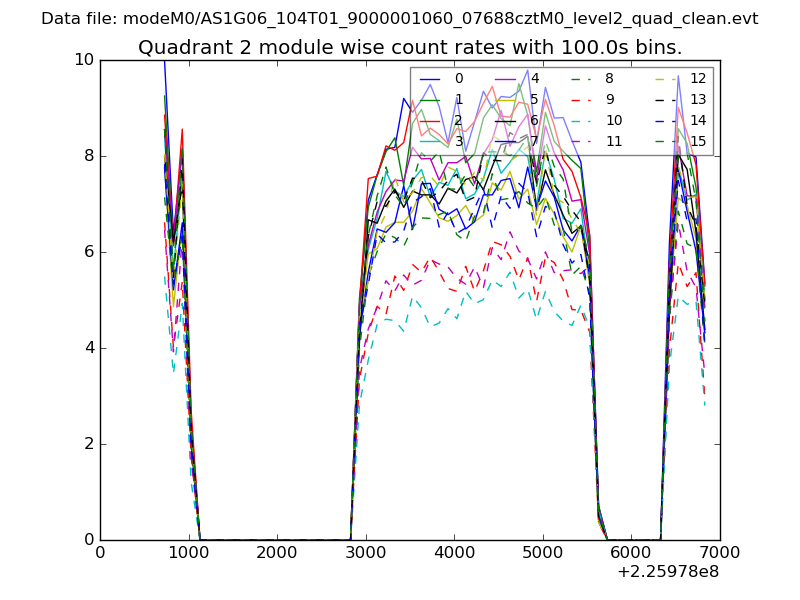
| Module-wise count rates for Quadrant B Data is divided into 100 sec bins |
 |
 |
| Module-wise count rates for Quadrant C Data is divided into 100 sec bins |
 |
 |
| Module-wise count rates for Quadrant D Data is divided into 100 sec bins |
 |
 |
| Parameter | Plot |
|---|---|
| CZT HV Monitor | 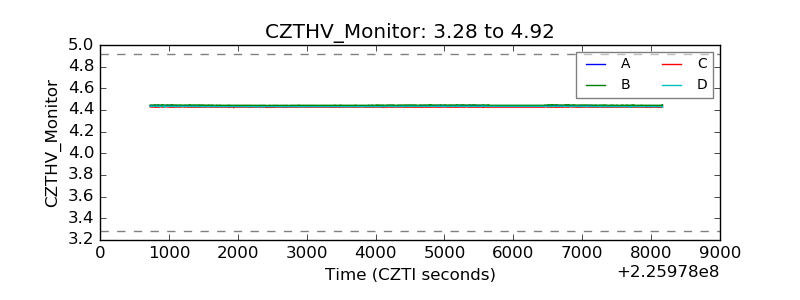 |
| D_VDD | 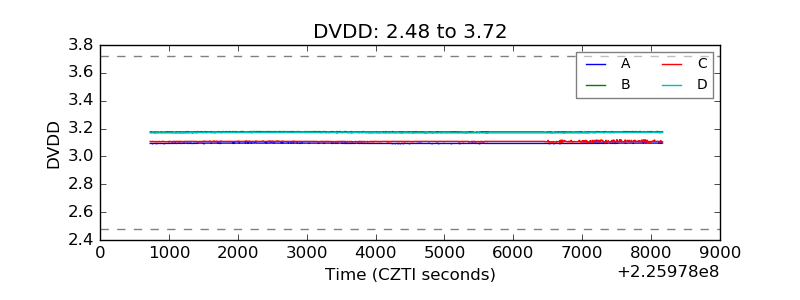 |
| Temperature 1 | 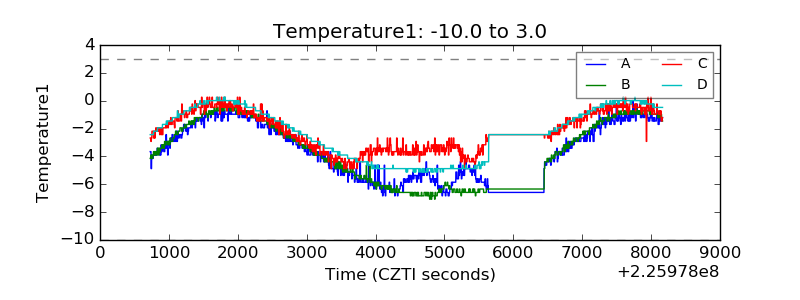 |
| Veto HV Monitor |  |
| Veto LLD | 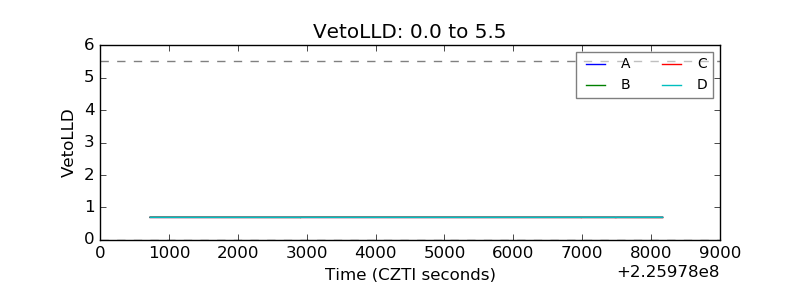 |
| Alpha Counter |  |
| _CPM_Rate | 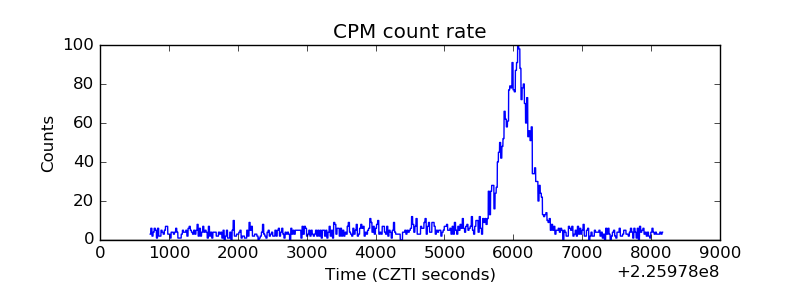 |
| CZT Counter |  |
| +2.5 Volts monitor |  |
| +5 Volts monitor |  |
| _ROLL_ROT | 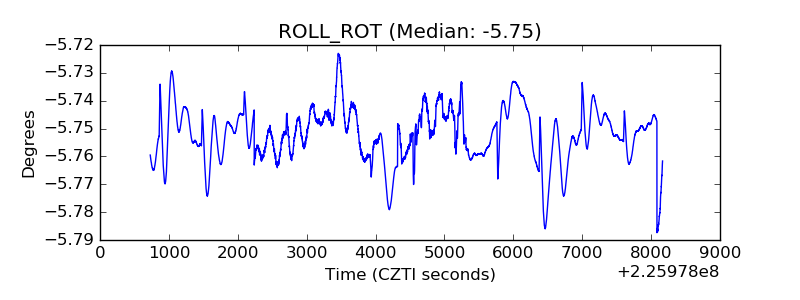 |
| _Roll_DEC | 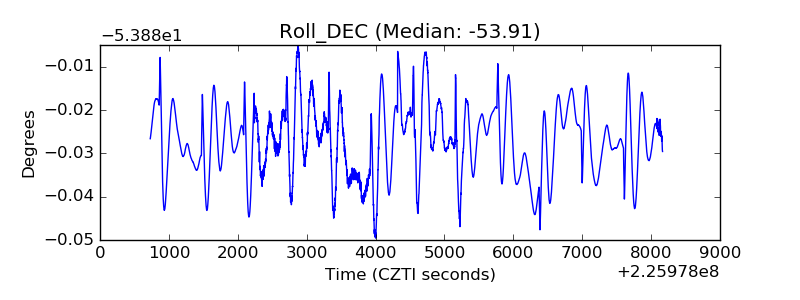 |
| _Roll_RA | 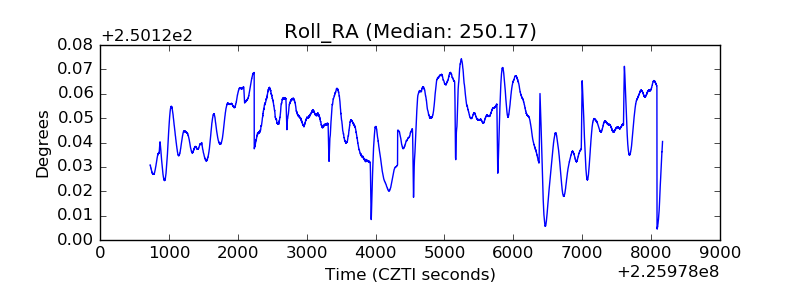 |
| Veto Counter | 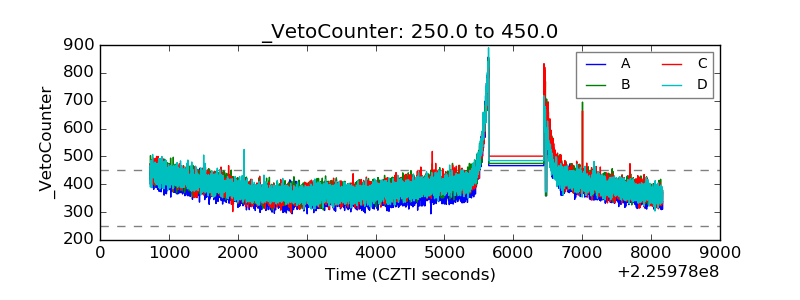 |