| Param | Original file | Final file |
|---|---|---|
| Filename | modeM0/AS1G06_104T01_9000001060_07689cztM0_level2.evt | modeM0/AS1G06_104T01_9000001060_07689cztM0_level2_quad_clean.evt |
| Size (bytes) | 634,484,160 | 73,313,280 |
| Size | 605.1 MB | 69.9 MB |
| Events in quadrant A | 3,215,186 | 446,107 |
| Events in quadrant B | 3,604,290 | 454,070 |
| Events in quadrant C | 8,108,091 | 412,351 |
| Events in quadrant D | 3,814,210 | 420,360 |
| Mode SS | |||
|---|---|---|---|
| Quadrant | BADHDUFLAG | Total packets | Discarded packets |
| A | 0 | 142 | 0 |
| B | 0 | 142 | 0 |
| C | 0 | 142 | 0 |
| D | 0 | 142 | 0 |
| Mode M9 | |||
|---|---|---|---|
| Quadrant | BADHDUFLAG | Total packets | Discarded packets |
| A | 0 | 3 | 0 |
| B | 0 | 3 | 0 |
| C | 0 | 3 | 0 |
| D | 0 | 3 | 0 |
| Mode M0 | |||
|---|---|---|---|
| Quadrant | BADHDUFLAG | Total packets | Discarded packets |
| A | 0 | 14400 | 3 |
| B | 0 | 15207 | 2 |
| C | 0 | 28816 | 2 |
| D | 0 | 16153 | 2 |
| Quadrant | Total seconds | Saturated seconds | Saturation percentage |
|---|---|---|---|
| A | 6986 | 151 | 2.161466% |
| B | 6986 | 181 | 2.590896% |
| C | 6986 | 1712 | 24.506155% |
| D | 6986 | 154 | 2.204409% |
Noise dominated data is calculated using 1-second bins in cleaned event files. If a bin has >2000 counts, and if more than 50% of those come from <1% of pixels, then it is considered to be noise-dominated and hence unusable.
| Quadrant | # 1 sec bins | Bins with >0 counts | Bins with >2000 counts | High rate bins dominated by noise | Noise dominated (total time) | Noise dominated (detector-on time) | Marked lightcurve |
|---|---|---|---|---|---|---|---|
| A | 7361 | 6987 | 0 | 0 | 0.00% | 0.00% | 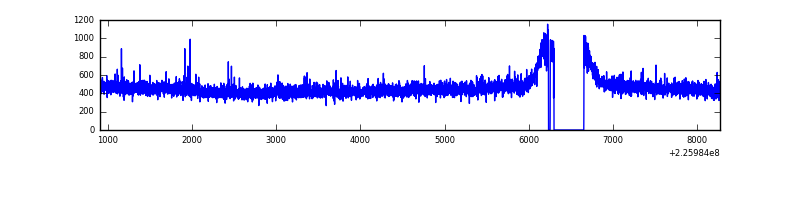 |
| B | 7361 | 6987 | 19 | 19 | 0.26% | 0.27% | 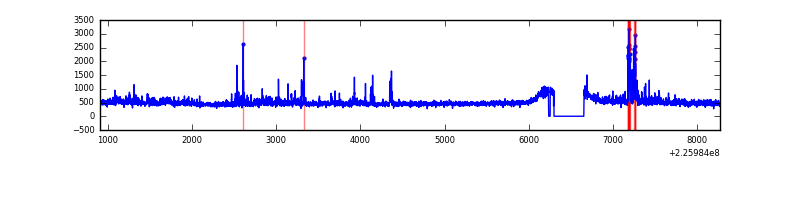 |
| C | 7361 | 6988 | 1547 | 1547 | 21.02% | 22.14% | 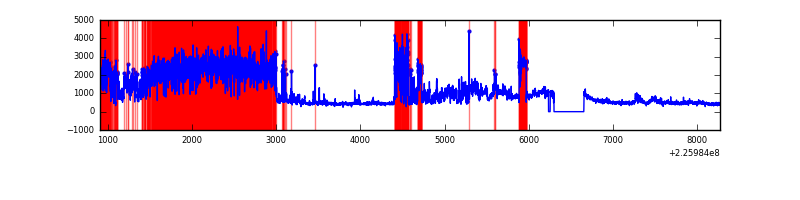 |
| D | 7361 | 6988 | 30 | 30 | 0.41% | 0.43% | 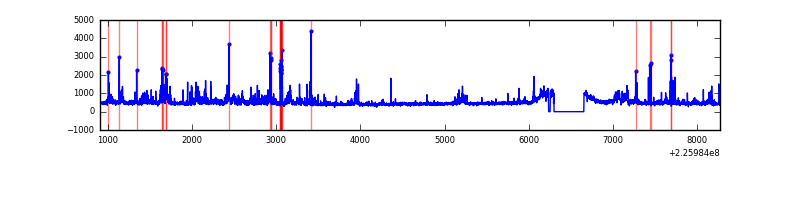 |
Top three noisy pixels from each quadrant. If the there are fewer than three noisy pixels in the level2.evt file, extra rows are filled as -1
| Pixel properties | Quadrant properties | ||||||
|---|---|---|---|---|---|---|---|
| Quadrant | DetID | PixID | Counts | Sigma | Mean | Median | Sigma |
| A | 0 | 226 | 7803 | 40.94 | 831 | 811 | 170.8 |
| A | 12 | 194 | 7537 | 39.38 | 831 | 811 | 170.8 |
| A | 3 | 1 | 7194 | 37.38 | 831 | 811 | 170.8 |
| B | 0 | 219 | 187532 | 1164.8 | 834 | 814 | 160.3 |
| B | 4 | 239 | 79127 | 488.54 | 834 | 814 | 160.3 |
| B | 0 | 214 | 23987 | 144.56 | 834 | 814 | 160.3 |
| C | 9 | 68 | 4973299 | 27900.55 | 761 | 763 | 178.2 |
| C | 8 | 229 | 111965 | 623.95 | 761 | 763 | 178.2 |
| C | 1 | 16 | 19828 | 106.97 | 761 | 763 | 178.2 |
| D | 1 | 83 | 283557 | 1418.97 | 811 | 785 | 199.3 |
| D | 2 | 152 | 116815 | 582.25 | 811 | 785 | 199.3 |
| D | 12 | 233 | 93860 | 467.06 | 811 | 785 | 199.3 |
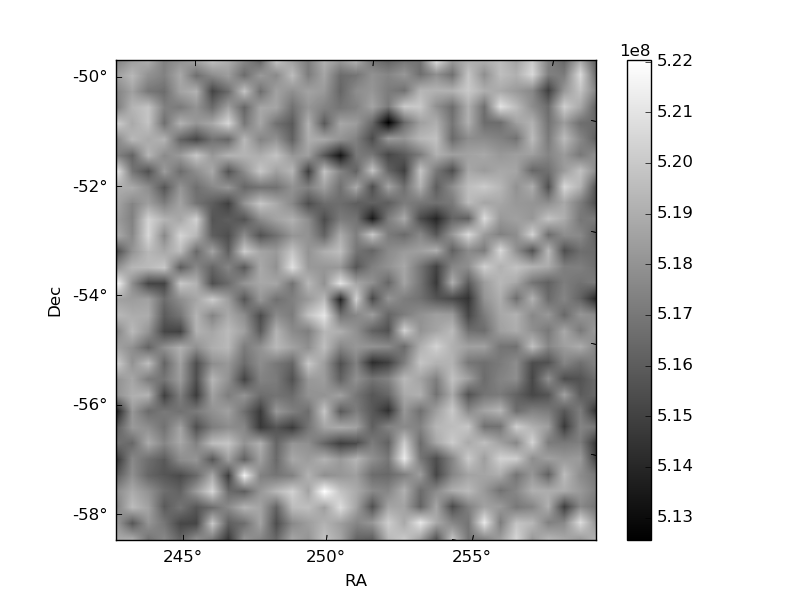
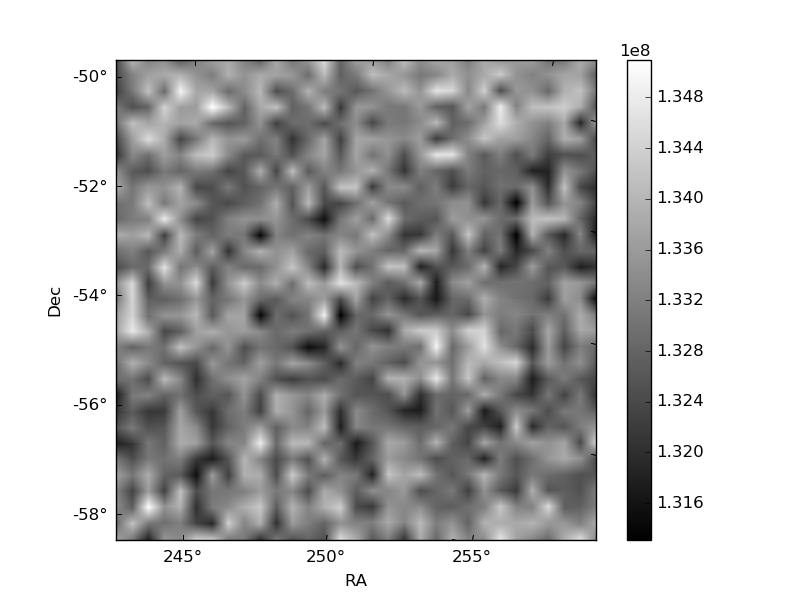
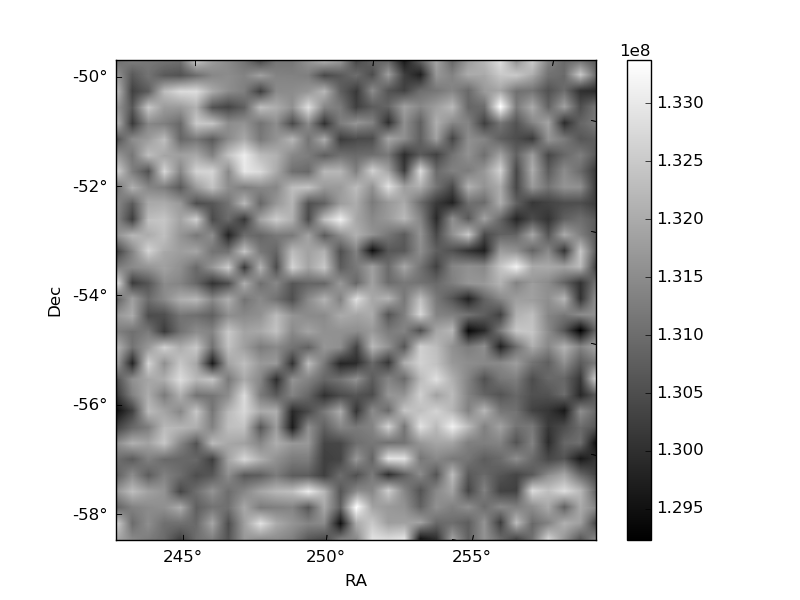
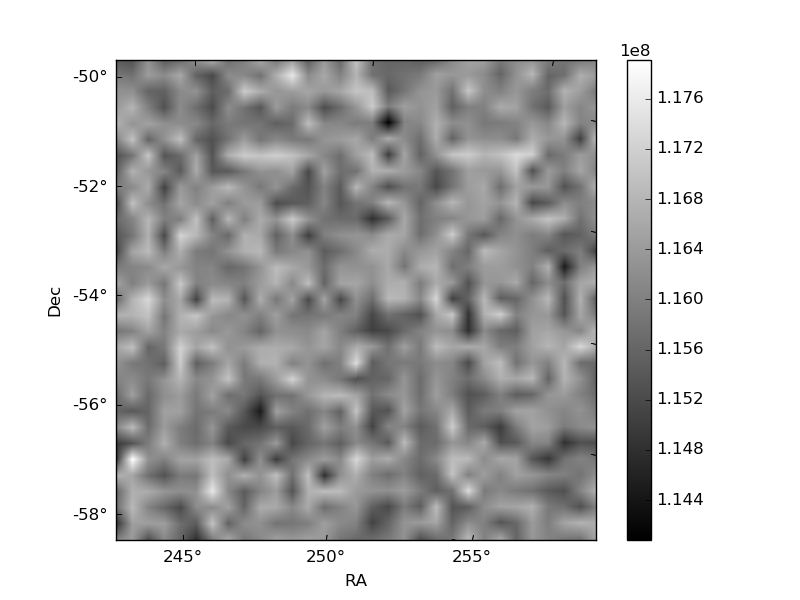
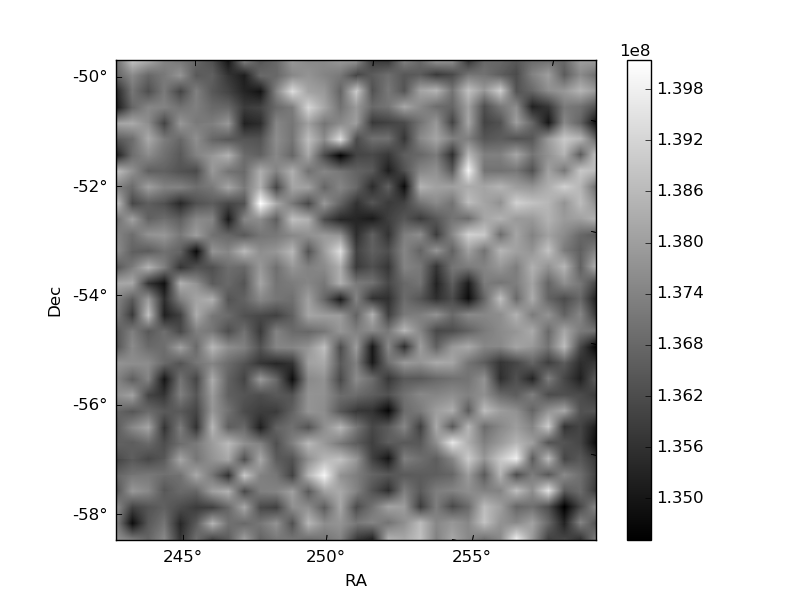
Histogram calculated using DETX and DETY for each event in the final _common_clean file
| Quadrant A | 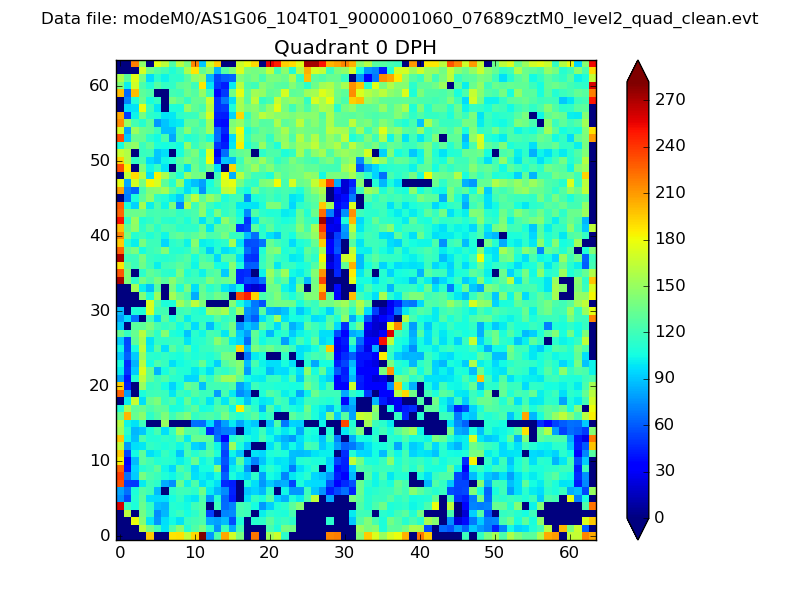 |
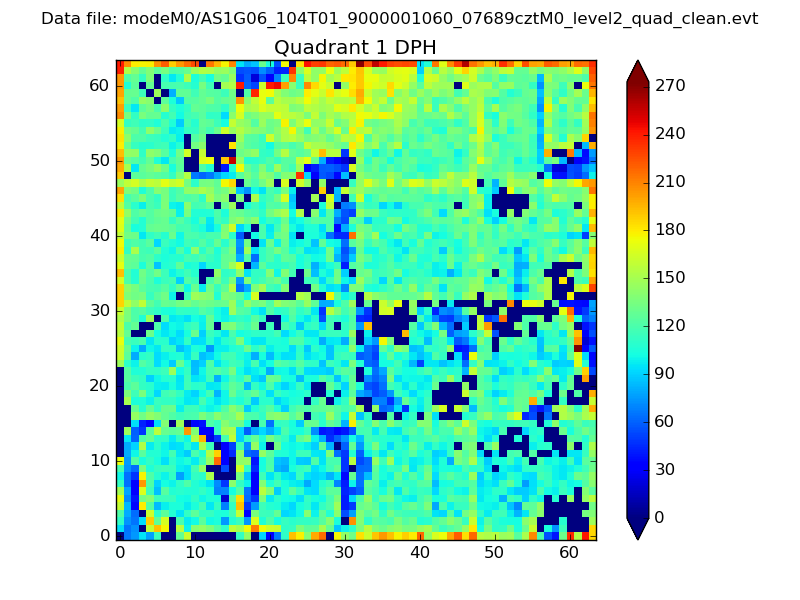 |
Quadrant B |
|---|---|---|---|
| Quadrant D | 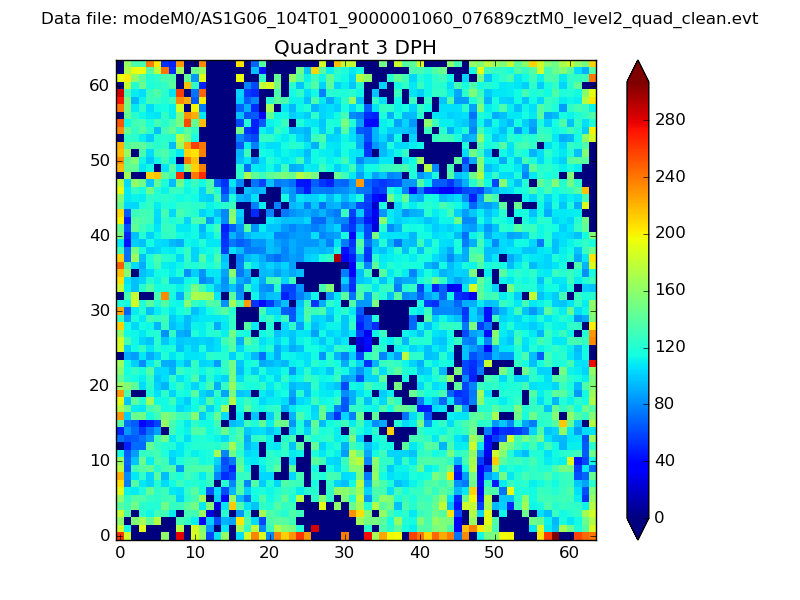 |
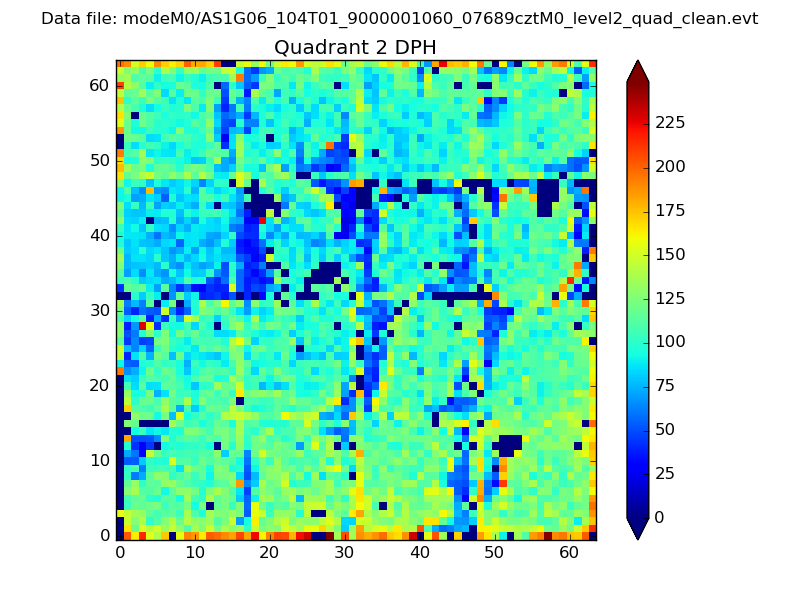 |
Quadrant C |
| Plot type | Count rate plots | Images |
|---|---|---|
| Comparison with Poisson distribution Blue bars denote a histogram of data divided into 1 sec bins. Red curve is a Poisson curve with rate = median count rate of data. |
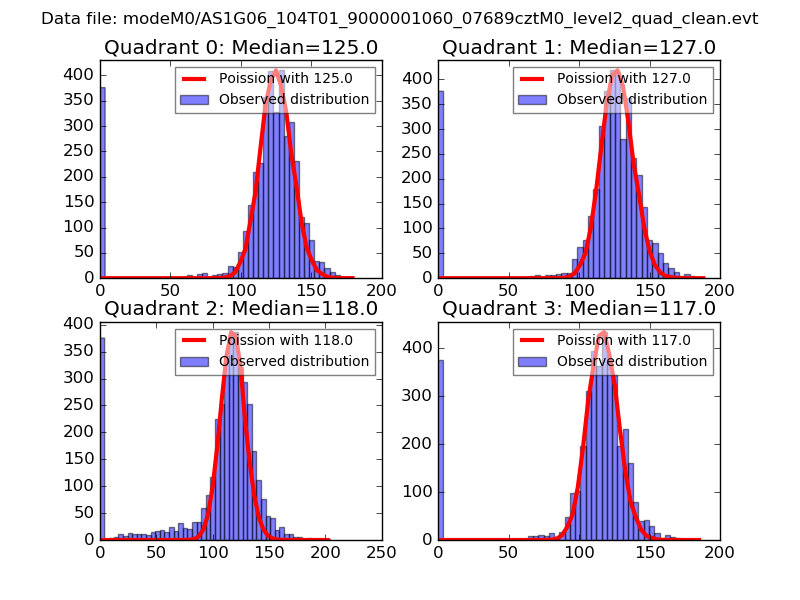 |
 |
| Quadrant-wise count rates Data is divided into 100 sec bins |
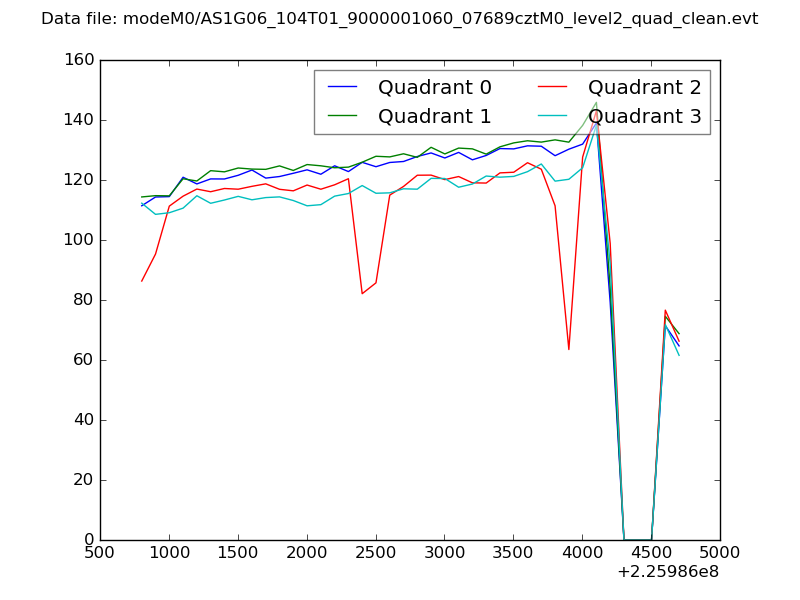 |
|
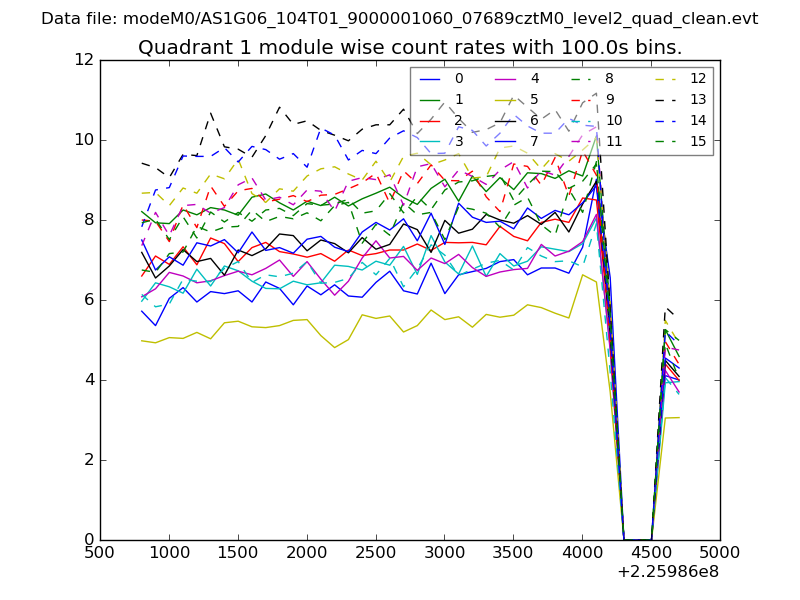
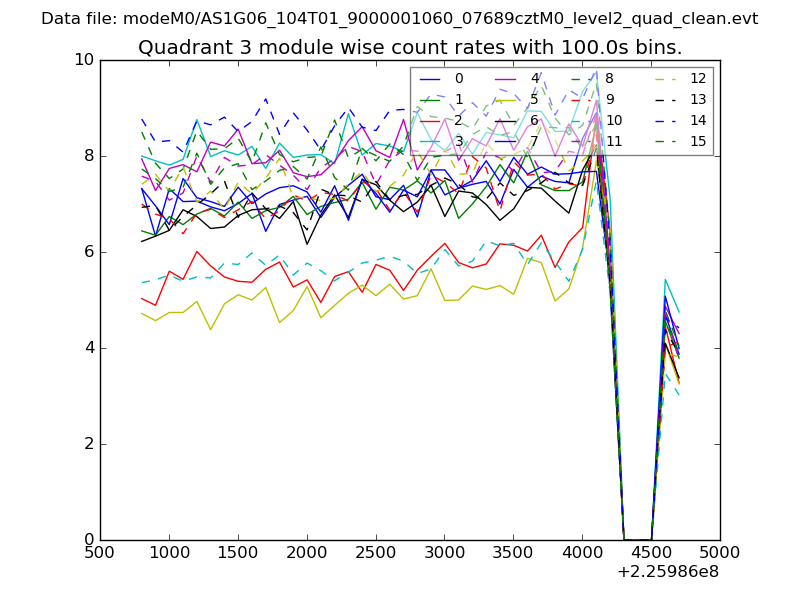
| Module-wise count rates for Quadrant A Data is divided into 100 sec bins |
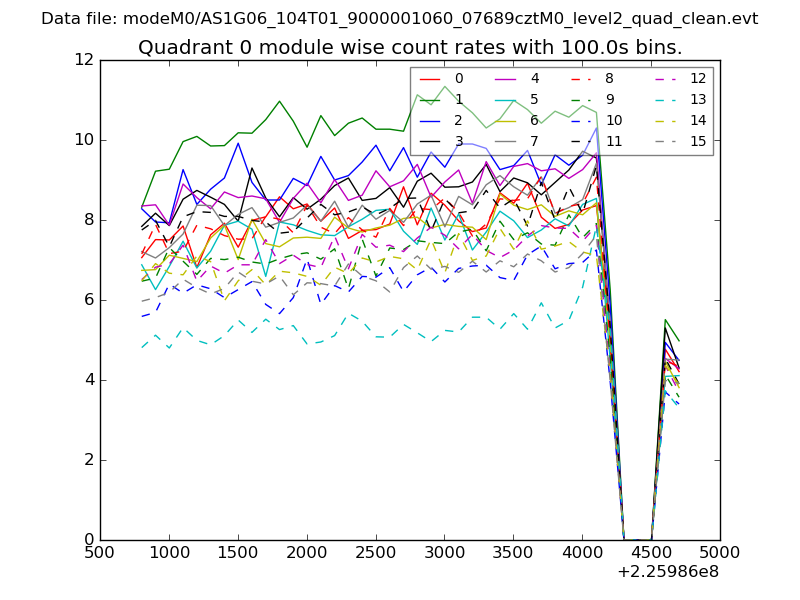 |
 |
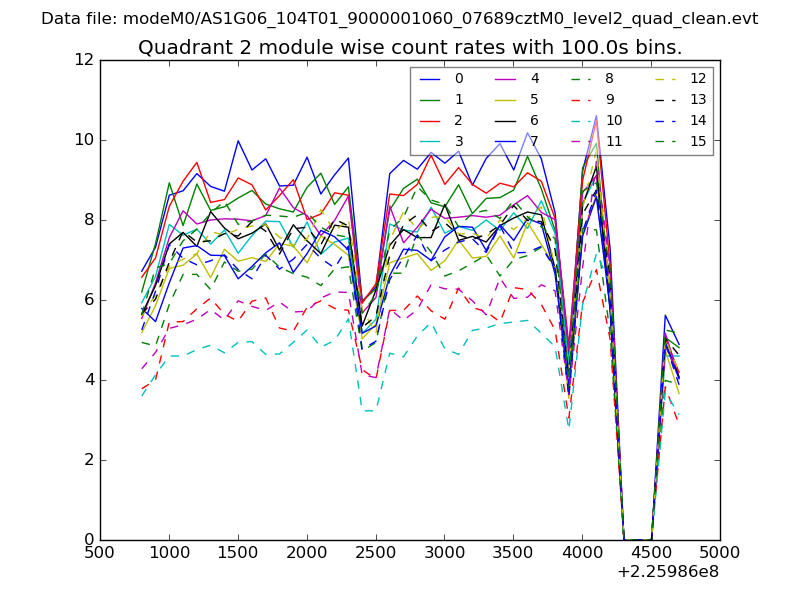
| Module-wise count rates for Quadrant B Data is divided into 100 sec bins |
 |
 |
| Module-wise count rates for Quadrant C Data is divided into 100 sec bins |
 |
 |
| Module-wise count rates for Quadrant D Data is divided into 100 sec bins |
 |
 |
| Parameter | Plot |
|---|---|
| CZT HV Monitor | 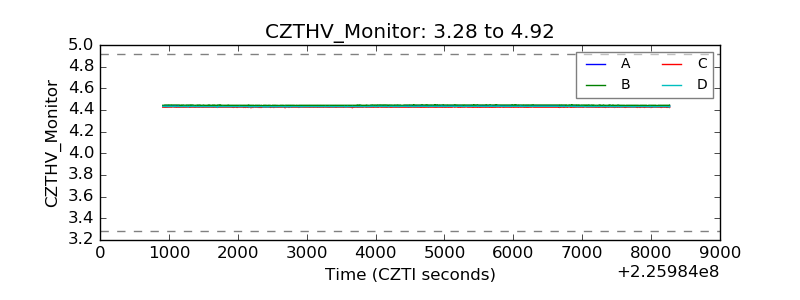 |
| D_VDD |  |
| Temperature 1 | 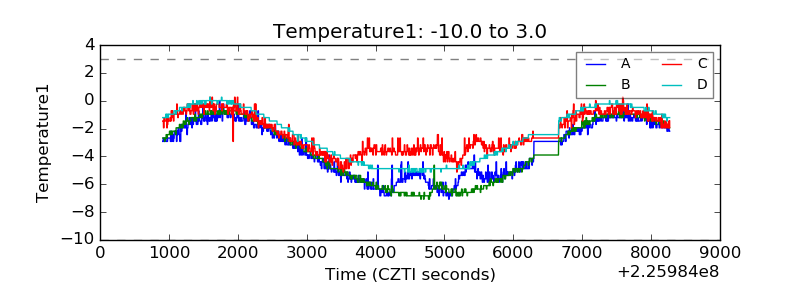 |
| Veto HV Monitor | 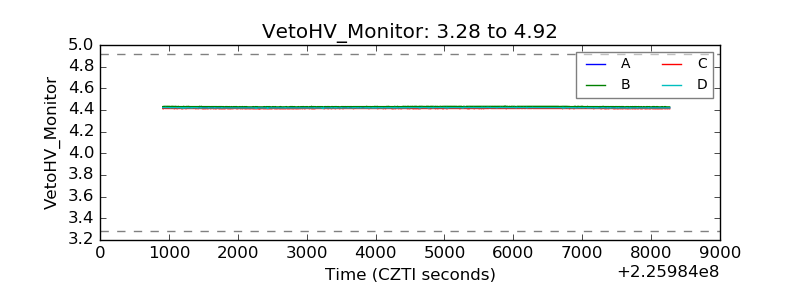 |
| Veto LLD | 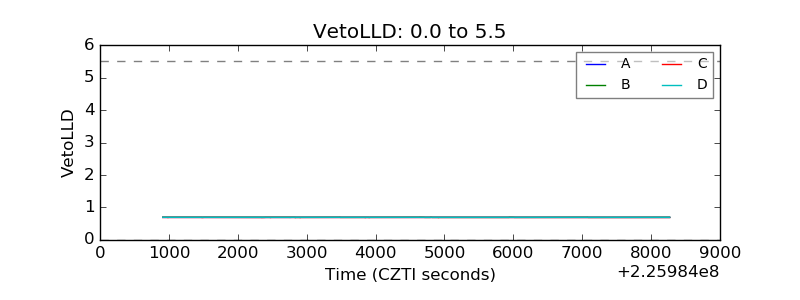 |
| Alpha Counter | 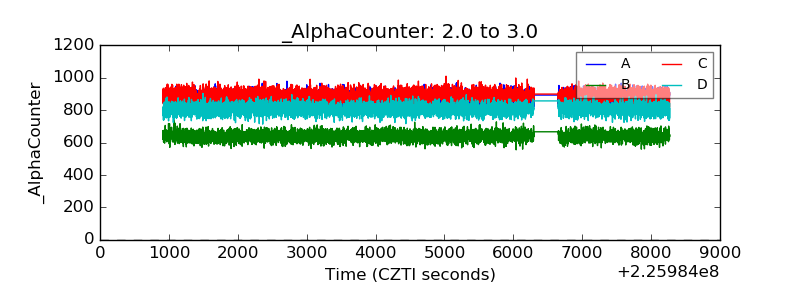 |
| _CPM_Rate | 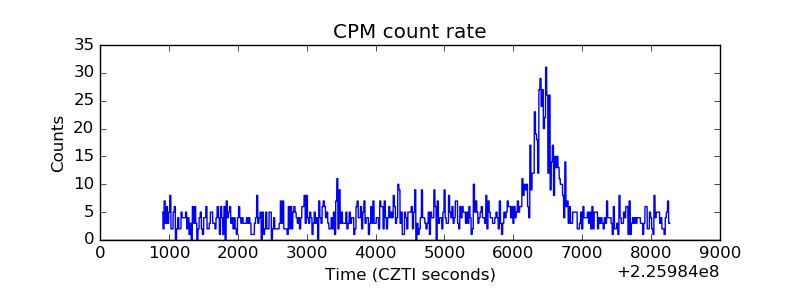 |
| CZT Counter | 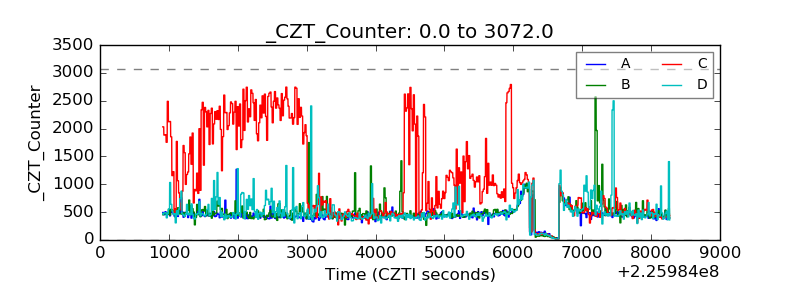 |
| +2.5 Volts monitor |  |
| +5 Volts monitor | 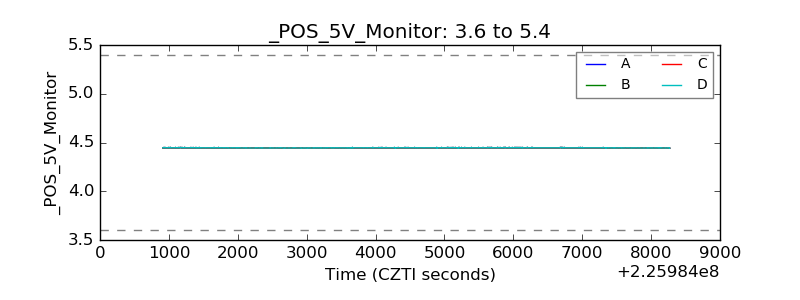 |
| _ROLL_ROT | 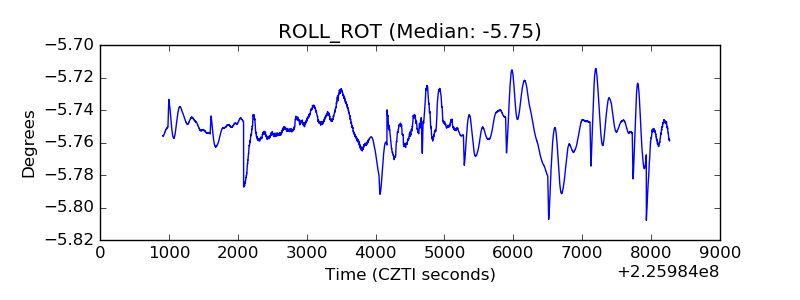 |
| _Roll_DEC | 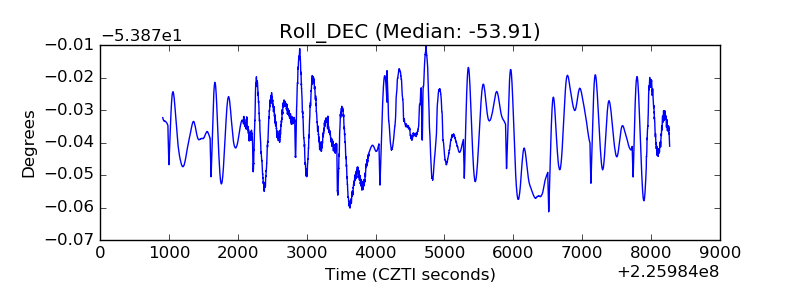 |
| _Roll_RA | 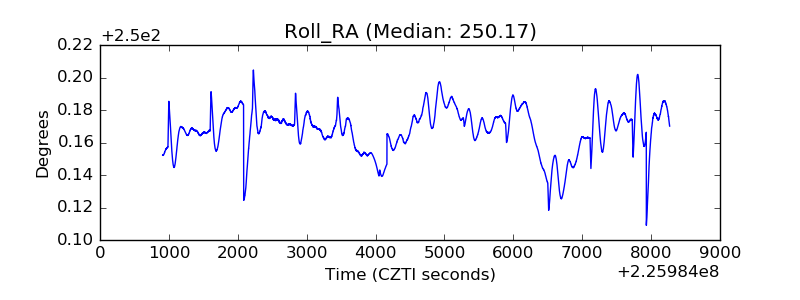 |
| Veto Counter | 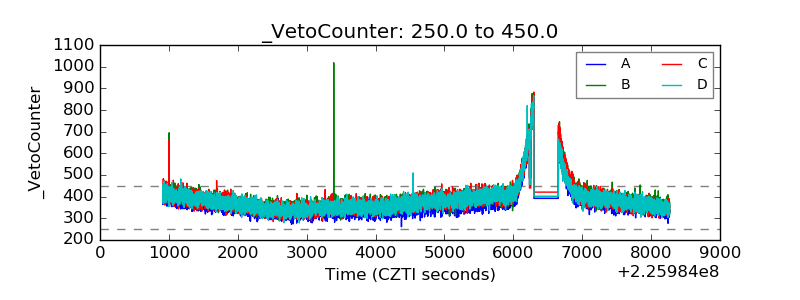 |