| Param | Original file | Final file |
|---|---|---|
| Filename | modeM0/AS1G06_104T01_9000001060_07698cztM0_level2.evt | modeM0/AS1G06_104T01_9000001060_07698cztM0_level2_quad_clean.evt |
| Size (bytes) | 454,538,880 | 95,287,680 |
| Size | 433.5 MB | 90.9 MB |
| Events in quadrant A | 3,091,033 | 612,287 |
| Events in quadrant B | 3,296,171 | 629,102 |
| Events in quadrant C | 3,371,938 | 601,440 |
| Events in quadrant D | 3,547,860 | 572,533 |
| Mode SS | |||
|---|---|---|---|
| Quadrant | BADHDUFLAG | Total packets | Discarded packets |
| A | 0 | 138 | 0 |
| B | 0 | 138 | 0 |
| C | 0 | 138 | 0 |
| D | 0 | 138 | 0 |
| Mode M9 | |||
|---|---|---|---|
| Quadrant | BADHDUFLAG | Total packets | Discarded packets |
| A | 0 | 19 | 0 |
| B | 0 | 19 | 0 |
| C | 0 | 19 | 0 |
| D | 0 | 19 | 0 |
| Mode M0 | |||
|---|---|---|---|
| Quadrant | BADHDUFLAG | Total packets | Discarded packets |
| A | 0 | 13783 | 2 |
| B | 0 | 14258 | 2 |
| C | 0 | 14212 | 2 |
| D | 0 | 15430 | 2 |
| Quadrant | Total seconds | Saturated seconds | Saturation percentage |
|---|---|---|---|
| A | 6751 | 30 | 0.444379% |
| B | 6751 | 35 | 0.518442% |
| C | 6751 | 42 | 0.622130% |
| D | 6751 | 134 | 1.984891% |
Noise dominated data is calculated using 1-second bins in cleaned event files. If a bin has >2000 counts, and if more than 50% of those come from <1% of pixels, then it is considered to be noise-dominated and hence unusable.
| Quadrant | # 1 sec bins | Bins with >0 counts | Bins with >2000 counts | High rate bins dominated by noise | Noise dominated (total time) | Noise dominated (detector-on time) | Marked lightcurve |
|---|---|---|---|---|---|---|---|
| A | 8566 | 6753 | 6 | 6 | 0.07% | 0.09% | 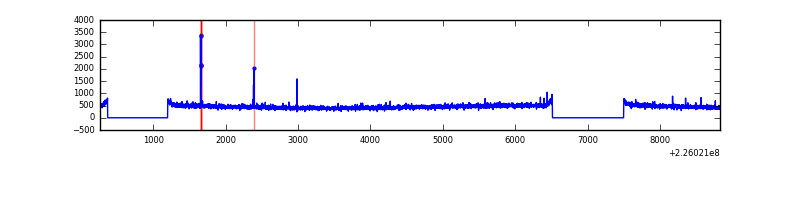 |
| B | 8566 | 6753 | 0 | 0 | 0.00% | 0.00% | 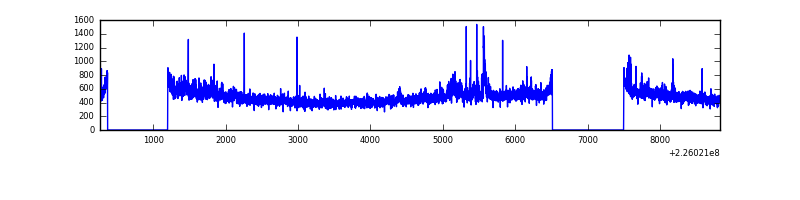 |
| C | 8566 | 6753 | 0 | 0 | 0.00% | 0.00% | 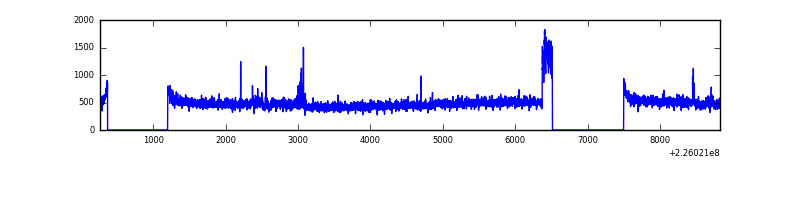 |
| D | 8566 | 6753 | 69 | 69 | 0.81% | 1.02% | 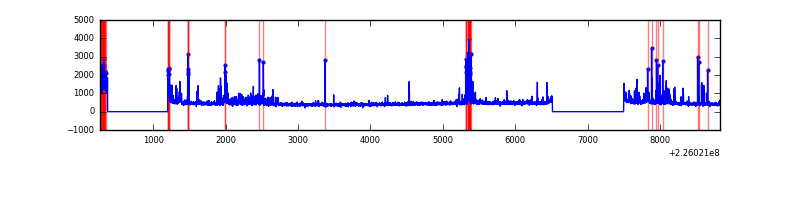 |
Top three noisy pixels from each quadrant. If the there are fewer than three noisy pixels in the level2.evt file, extra rows are filled as -1
| Pixel properties | Quadrant properties | ||||||
|---|---|---|---|---|---|---|---|
| Quadrant | DetID | PixID | Counts | Sigma | Mean | Median | Sigma |
| A | 15 | 174 | 14521 | 84.78 | 791 | 775 | 162.1 |
| A | 13 | 248 | 9509 | 53.87 | 791 | 775 | 162.1 |
| A | 13 | 14 | 7932 | 44.14 | 791 | 775 | 162.1 |
| B | 0 | 219 | 106042 | 683.21 | 804 | 786 | 154.1 |
| B | 0 | 213 | 17879 | 110.95 | 804 | 786 | 154.1 |
| B | 12 | 111 | 14918 | 91.73 | 804 | 786 | 154.1 |
| C | 8 | 229 | 269656 | 1475.2 | 777 | 780 | 182.3 |
| C | 8 | 208 | 37346 | 200.62 | 777 | 780 | 182.3 |
| C | 9 | 68 | 16563 | 86.59 | 777 | 780 | 182.3 |
| D | 1 | 83 | 296188 | 1568.27 | 765 | 740 | 188.4 |
| D | 2 | 152 | 216546 | 1145.52 | 765 | 740 | 188.4 |
| D | 13 | 104 | 99241 | 522.85 | 765 | 740 | 188.4 |
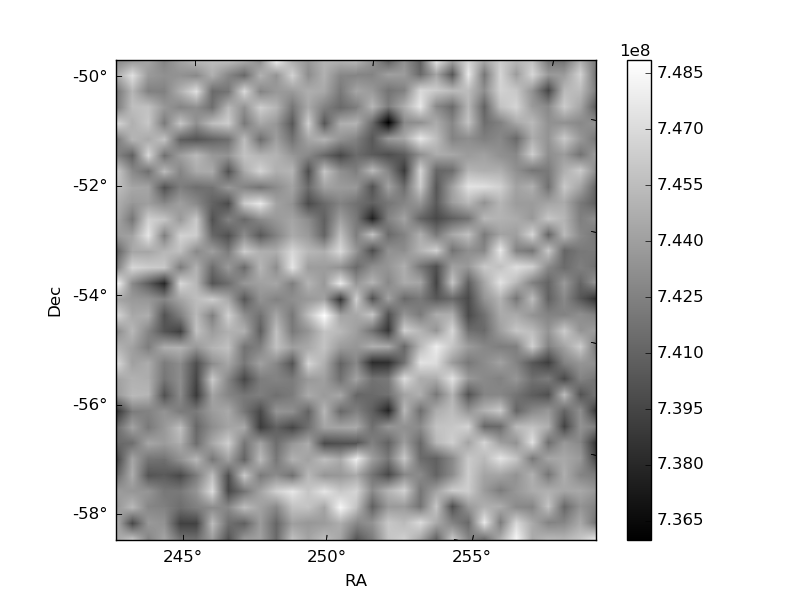
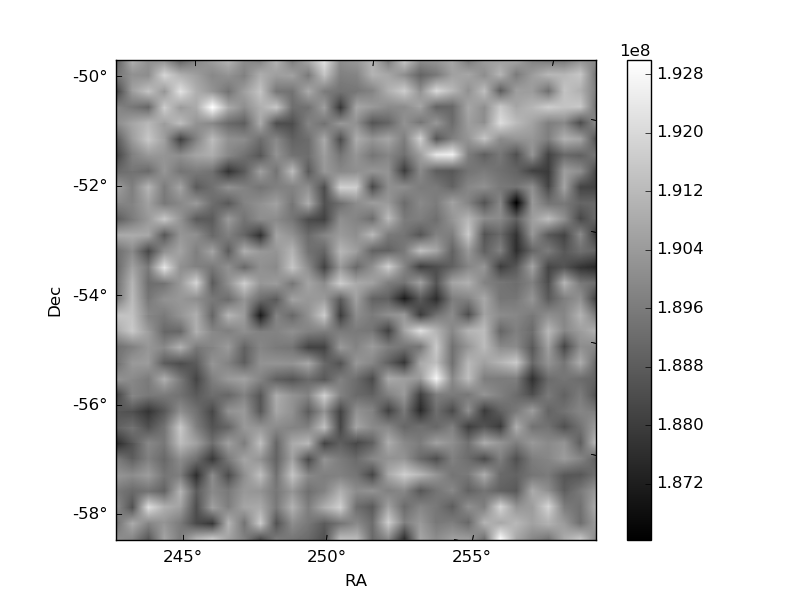
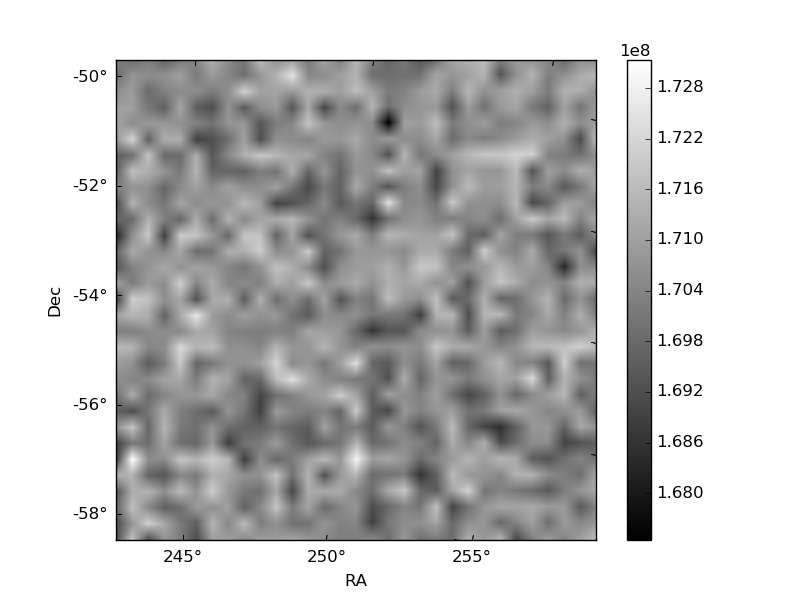
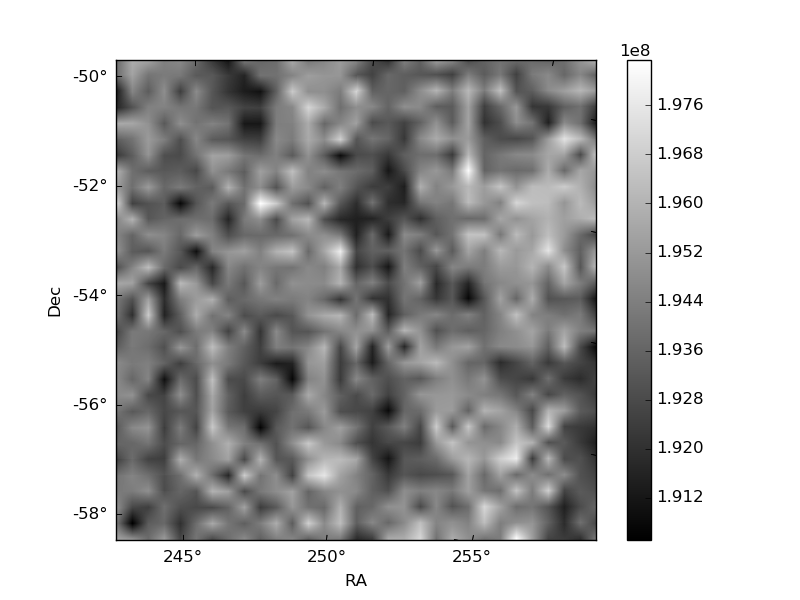
Histogram calculated using DETX and DETY for each event in the final _common_clean file
| Quadrant A | 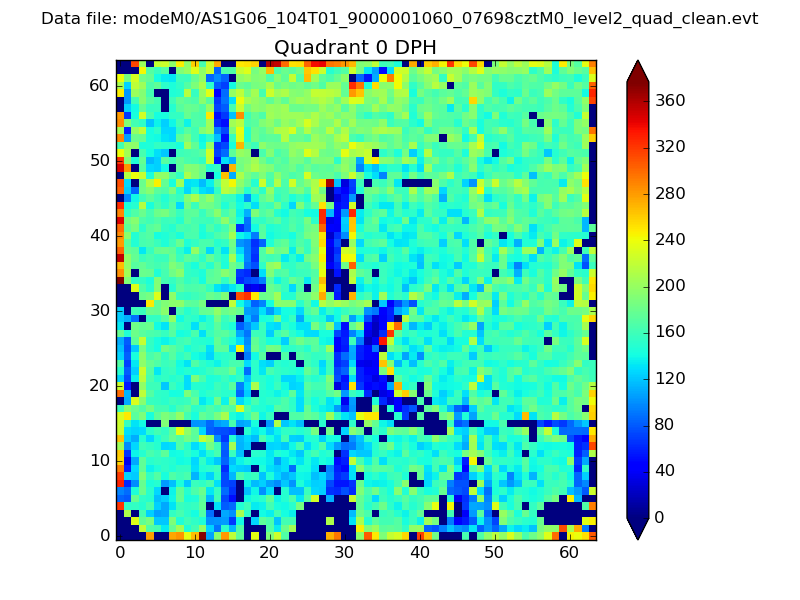 |
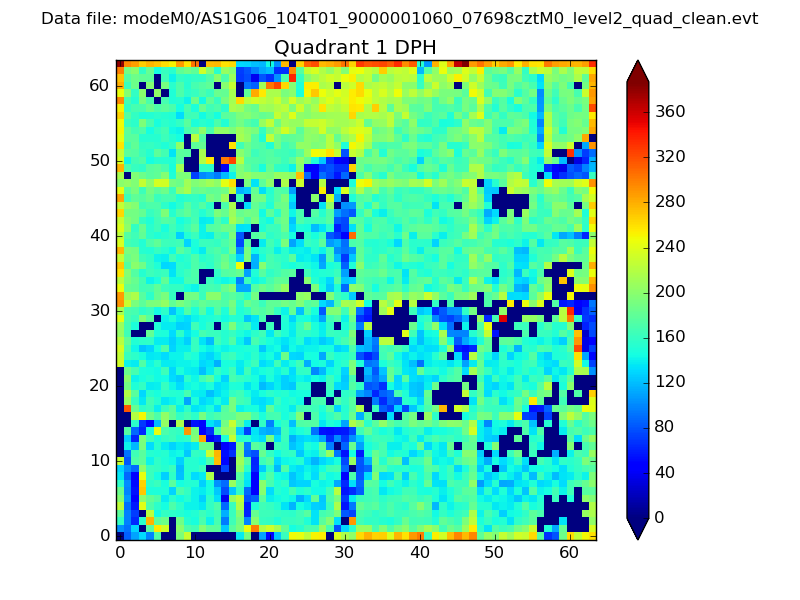 |
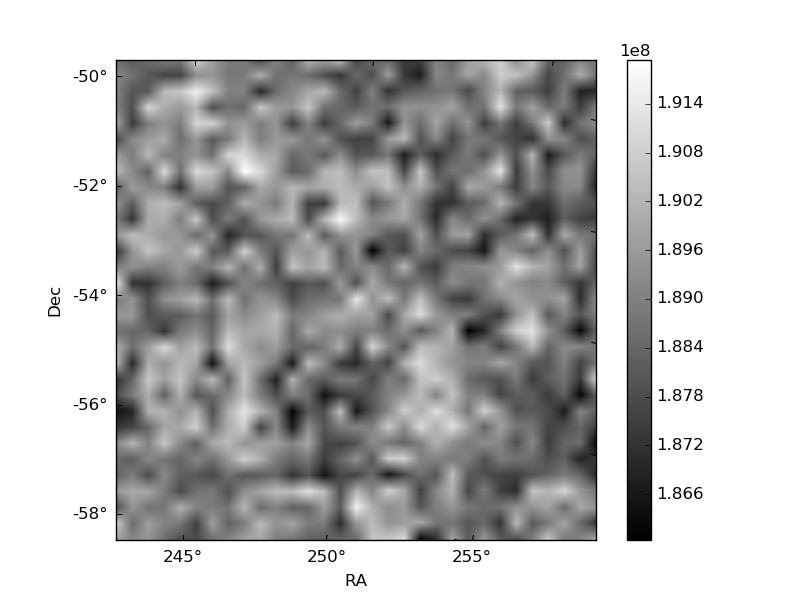
Quadrant B |
|---|---|---|---|
| Quadrant D | 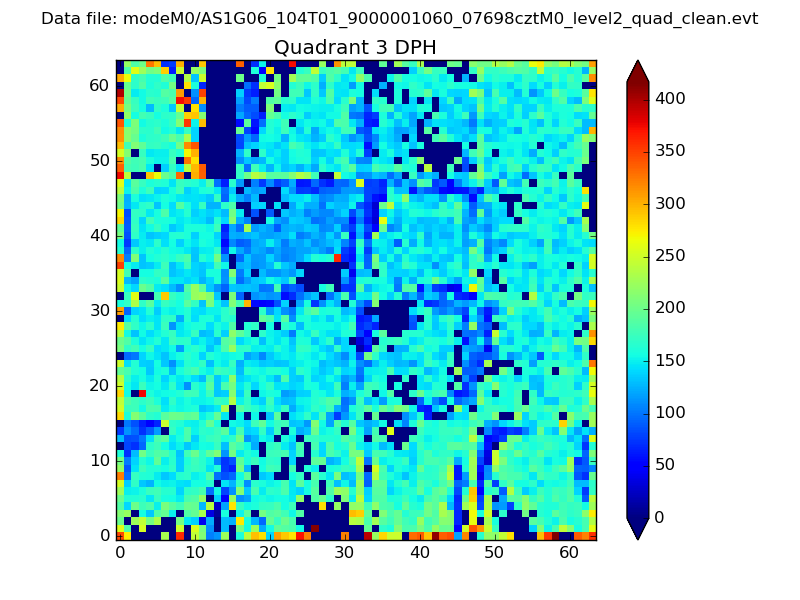 |
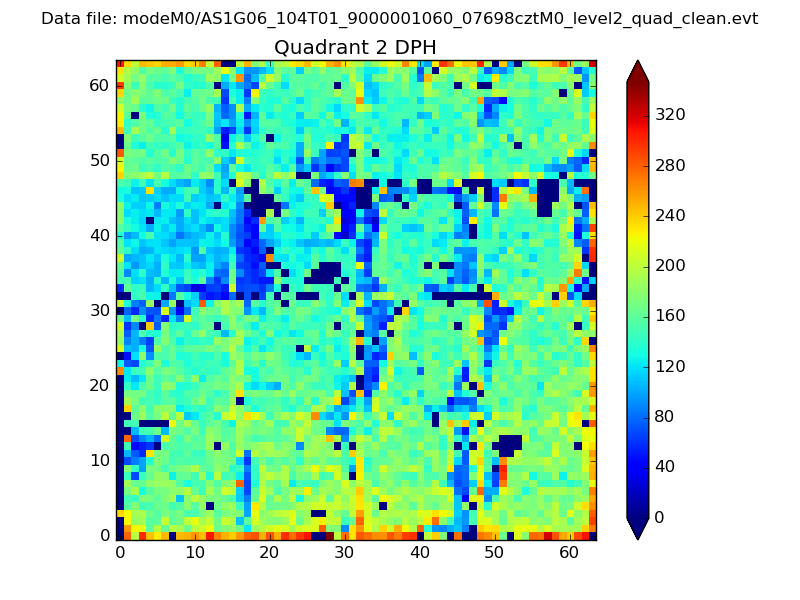 |
Quadrant C |
| Plot type | Count rate plots | Images |
|---|---|---|
| Comparison with Poisson distribution Blue bars denote a histogram of data divided into 1 sec bins. Red curve is a Poisson curve with rate = median count rate of data. |
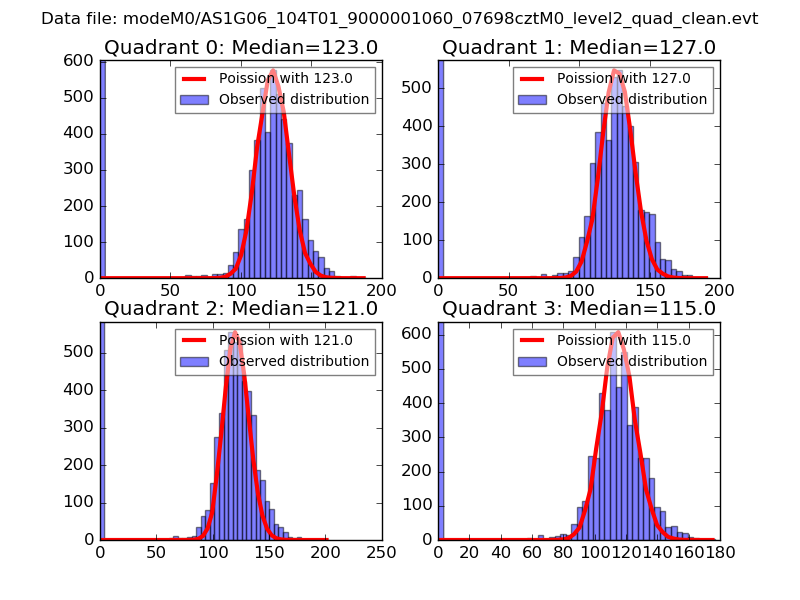 |
 |
| Quadrant-wise count rates Data is divided into 100 sec bins |
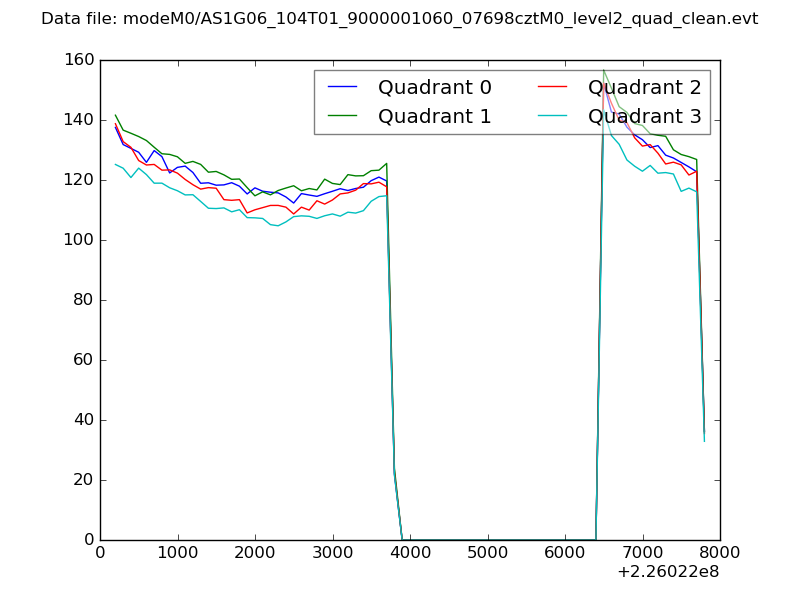 |
|
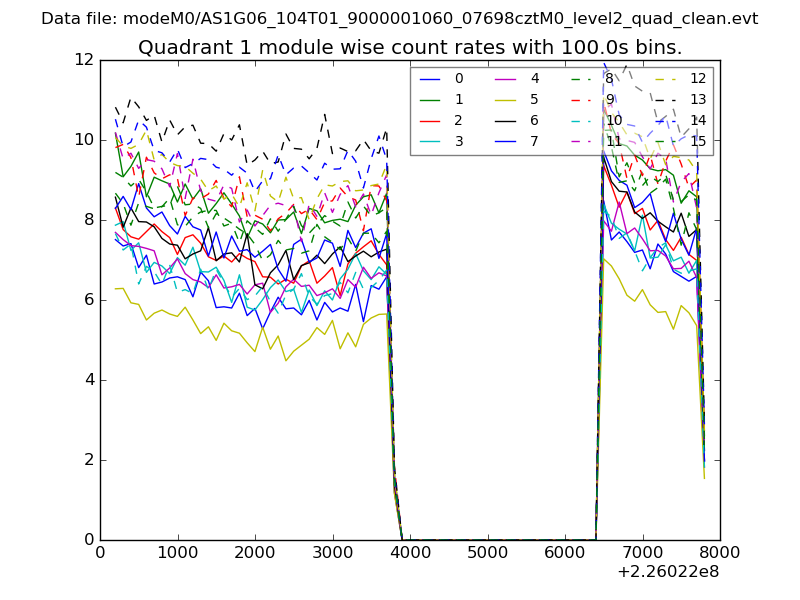
| Module-wise count rates for Quadrant A Data is divided into 100 sec bins |
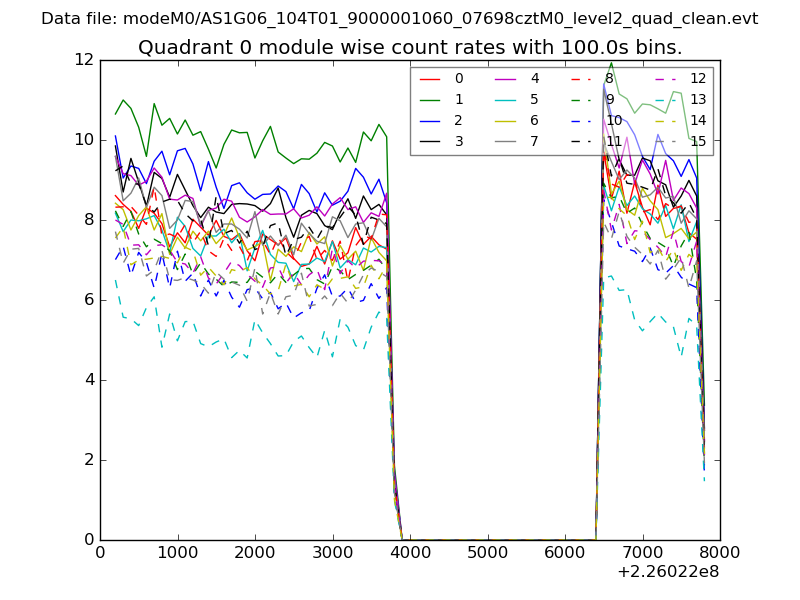 |
 |
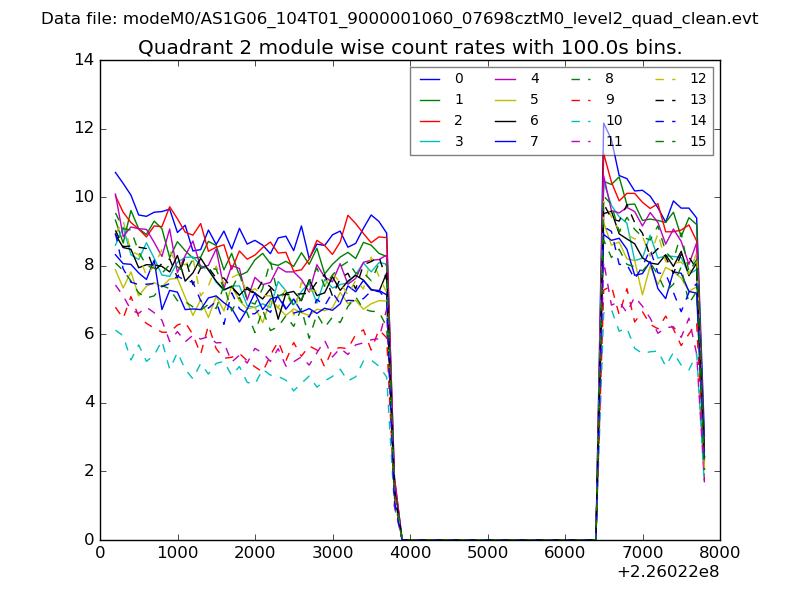
| Module-wise count rates for Quadrant B Data is divided into 100 sec bins |
 |
 |
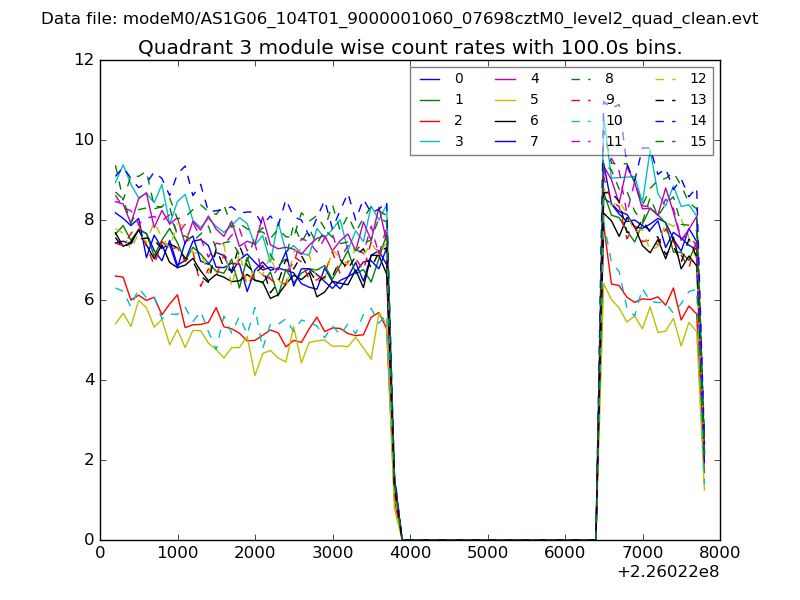
| Module-wise count rates for Quadrant C Data is divided into 100 sec bins |
 |
 |
| Module-wise count rates for Quadrant D Data is divided into 100 sec bins |
 |
 |
| Parameter | Plot |
|---|---|
| CZT HV Monitor | 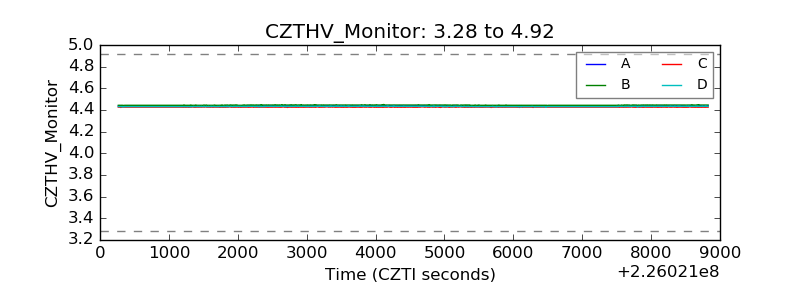 |
| D_VDD | 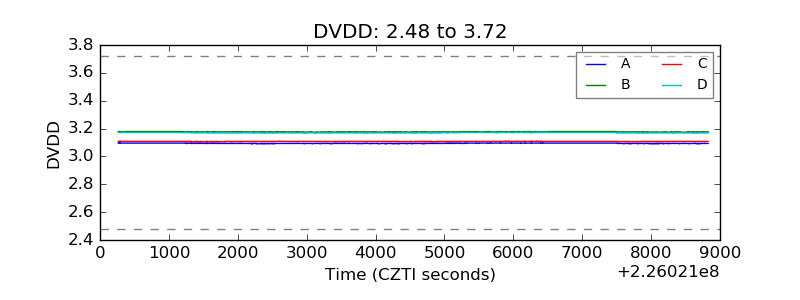 |
| Temperature 1 | 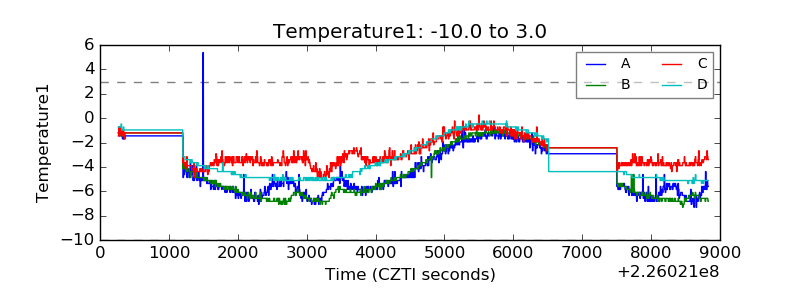 |
| Veto HV Monitor | 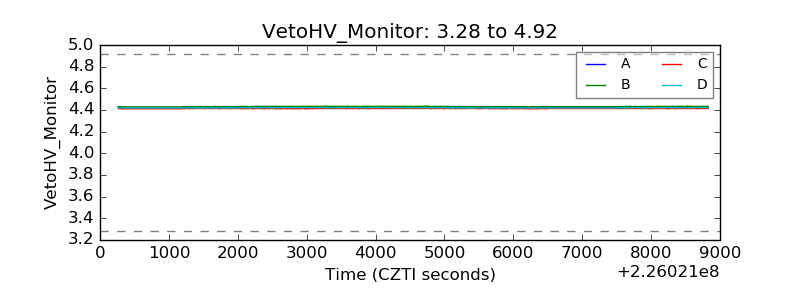 |
| Veto LLD | 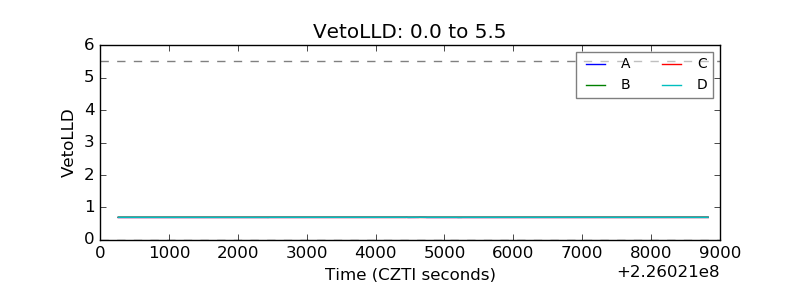 |
| Alpha Counter | 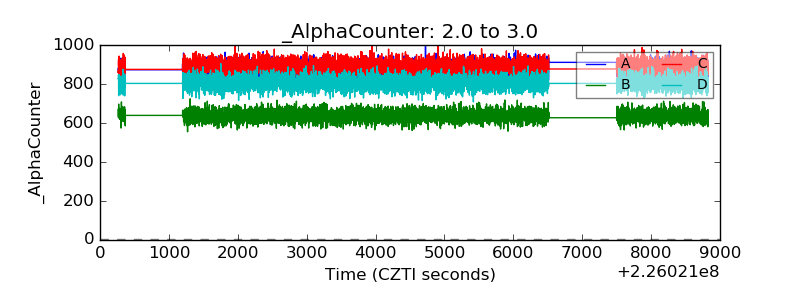 |
| _CPM_Rate | 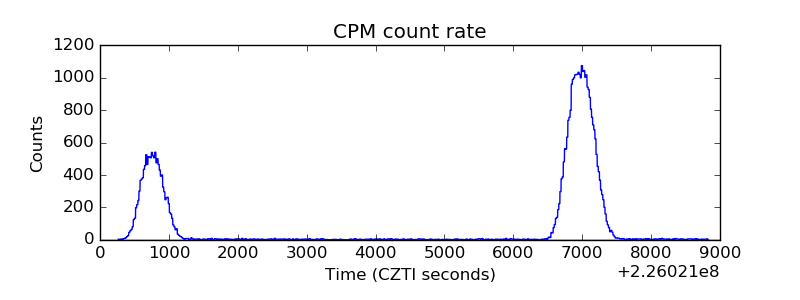 |
| CZT Counter | 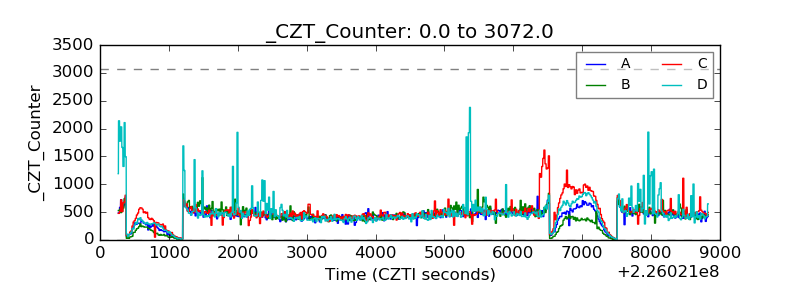 |
| +2.5 Volts monitor |  |
| +5 Volts monitor | 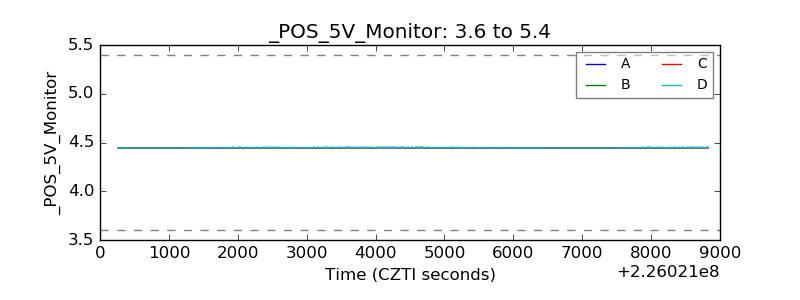 |
| _ROLL_ROT | 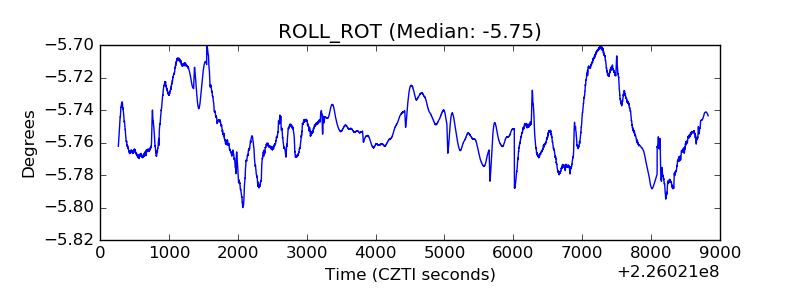 |
| _Roll_DEC | 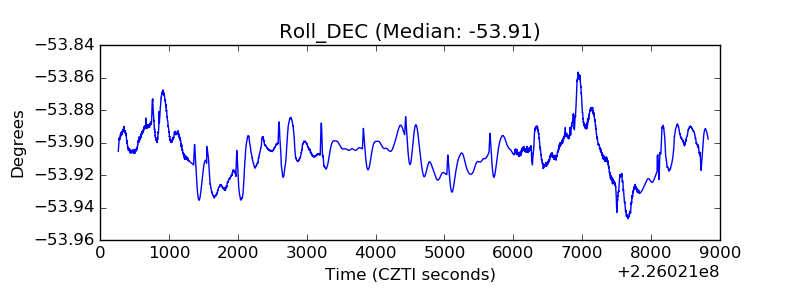 |
| _Roll_RA | 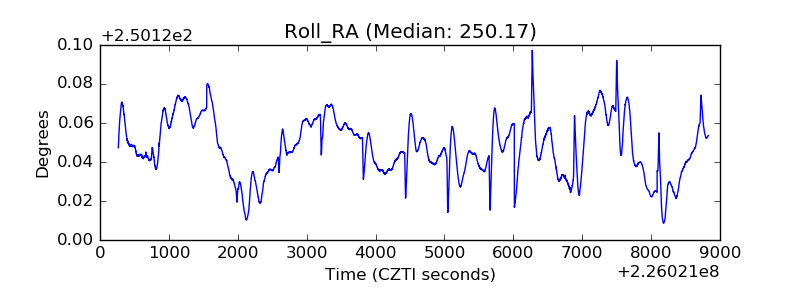 |
| Veto Counter | 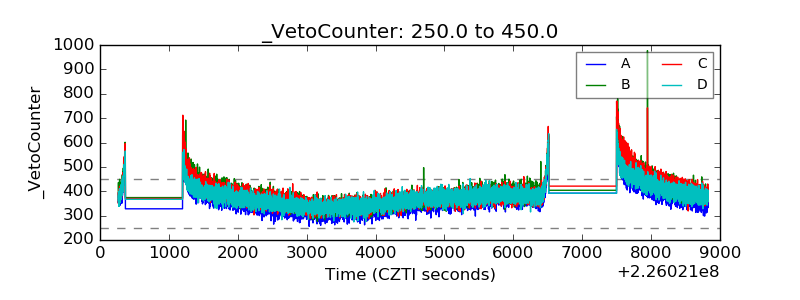 |