| Param | Original file | Final file |
|---|---|---|
| Filename | modeM0/AS1A02_155T01_9000001062cztM0_level2.fits | modeM0/AS1A02_155T01_9000001062cztM0_level2_quad_clean.evt |
| Size (bytes) | 108,460,800 | 64,465,920 |
| Size | 103.4 MB | 61.5 MB |
| Events in quadrant A | 655,044 | 305,337 |
| Events in quadrant B | 633,952 | 310,357 |
| Events in quadrant C | 657,663 | 295,460 |
| Events in quadrant D | 568,499 | 269,822 |
| Mode M9 | |||
|---|---|---|---|
| Quadrant | BADHDUFLAG | Total packets | Discarded packets |
| A | 0 | 90 | 0 |
| B | 0 | 90 | 0 |
| C | 0 | 90 | 0 |
| D | 0 | 90 | 0 |
| Mode SS | |||
|---|---|---|---|
| Quadrant | BADHDUFLAG | Total packets | Discarded packets |
| A | 0 | 226 | 0 |
| B | 0 | 226 | 0 |
| C | 0 | 226 | 0 |
| D | 0 | 226 | 0 |
| Mode M0 | |||
|---|---|---|---|
| Quadrant | BADHDUFLAG | Total packets | Discarded packets |
| A | 0 | 22727 | 0 |
| B | 0 | 23279 | 0 |
| C | 0 | 22968 | 0 |
| D | 0 | 23508 | 0 |
| Quadrant | Total seconds | Saturated seconds | Saturation percentage |
|---|---|---|---|
| A | 11127 | 58 | 0.521255% |
| B | 11127 | 65 | 0.584165% |
| C | 11127 | 53 | 0.476319% |
| D | 11127 | 70 | 0.629100% |
Noise dominated data is calculated using 1-second bins in cleaned event files. If a bin has >2000 counts, and if more than 50% of those come from <1% of pixels, then it is considered to be noise-dominated and hence unusable.
| Quadrant | # 1 sec bins | Bins with >0 counts | Bins with >2000 counts | High rate bins dominated by noise | Noise dominated (total time) | Noise dominated (detector-on time) | Marked lightcurve |
|---|---|---|---|---|---|---|---|
| A | 11944 | 10283 | 0 | 0 | 0.00% | 0.00% | 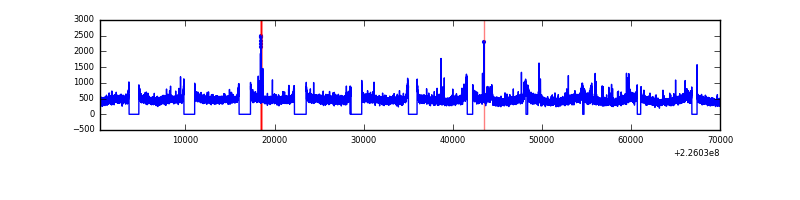 |
| B | 11944 | 10283 | 0 | 0 | 0.00% | 0.00% |  |
| C | 11944 | 10283 | 0 | 0 | 0.00% | 0.00% |  |
| D | 11944 | 10283 | 0 | 0 | 0.00% | 0.00% | 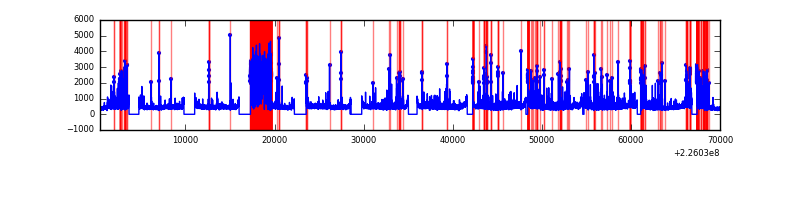 |
Top three noisy pixels from each quadrant. If the there are fewer than three noisy pixels in the level2.evt file, extra rows are filled as -1
| Pixel properties | Quadrant properties | ||||||
|---|---|---|---|---|---|---|---|
| Quadrant | DetID | PixID | Counts | Sigma | Mean | Median | Sigma |
| A | 0 | 29 | 625 | 10.52 | 170 | 160 | 44.2 |
| A | 7 | 110 | 537 | 8.53 | 170 | 160 | 44.2 |
| A | 0 | 28 | 503 | 7.76 | 170 | 160 | 44.2 |
| B | 2 | 9 | 515 | 9.76 | 167 | 159 | 36.5 |
| B | 2 | 8 | 432 | 7.49 | 167 | 159 | 36.5 |
| B | 3 | 80 | 425 | 7.3 | 167 | 159 | 36.5 |
| C | 1 | 80 | 496 | 7.1 | 173 | 162 | 47.0 |
| C | 1 | 81 | 467 | 6.48 | 173 | 162 | 47.0 |
| C | 9 | 188 | 448 | 6.08 | 173 | 162 | 47.0 |
| D | 6 | 231 | 438 | 6.62 | 162 | 148 | 43.8 |
| D | 4 | 160 | 414 | 6.07 | 162 | 148 | 43.8 |
| D | 3 | 14 | 408 | 5.93 | 162 | 148 | 43.8 |
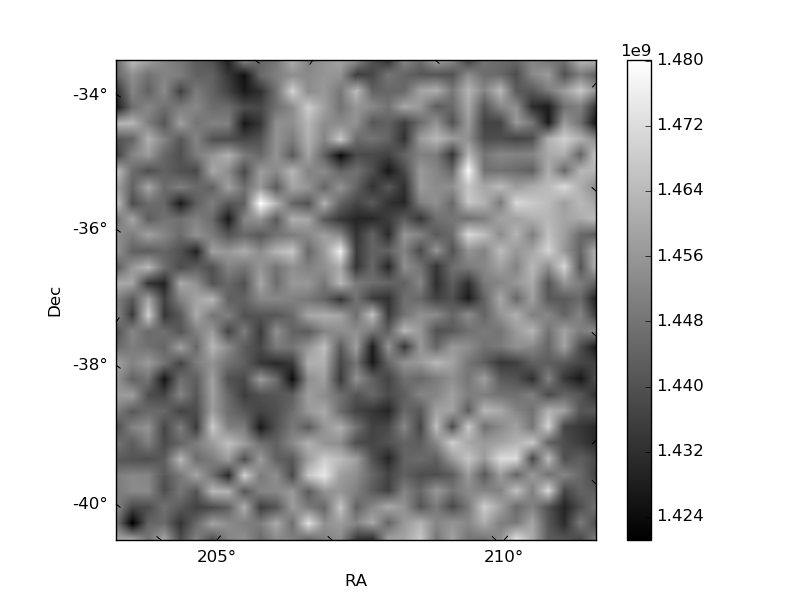
Histogram calculated using DETX and DETY for each event in the final _common_clean file
| Quadrant A |  |
 |
Quadrant B |
|---|---|---|---|
| Quadrant D | 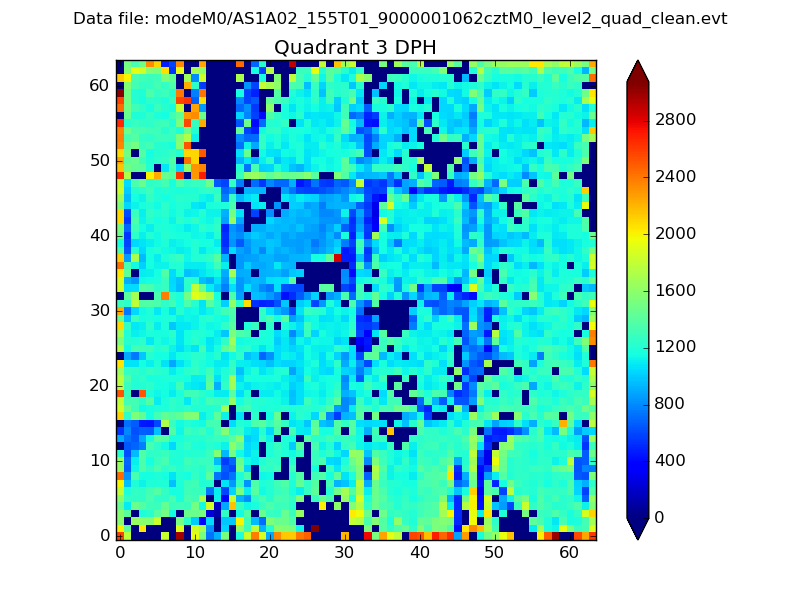 |
 |
Quadrant C |
| Plot type | Count rate plots | Images |
|---|---|---|
| Comparison with Poisson distribution Blue bars denote a histogram of data divided into 1 sec bins. Red curve is a Poisson curve with rate = median count rate of data. |
 |
 |
| Quadrant-wise count rates Data is divided into 100 sec bins |
 |
|
| Module-wise count rates for Quadrant A Data is divided into 100 sec bins |
 |
 |
| Module-wise count rates for Quadrant B Data is divided into 100 sec bins |
 |
 |
| Module-wise count rates for Quadrant C Data is divided into 100 sec bins |
 |
 |
| Module-wise count rates for Quadrant D Data is divided into 100 sec bins |
 |
 |
| Parameter | Plot |
|---|---|
| CZT HV Monitor |  |
| D_VDD |  |
| Temperature 1 |  |
| Veto HV Monitor |  |
| Veto LLD | 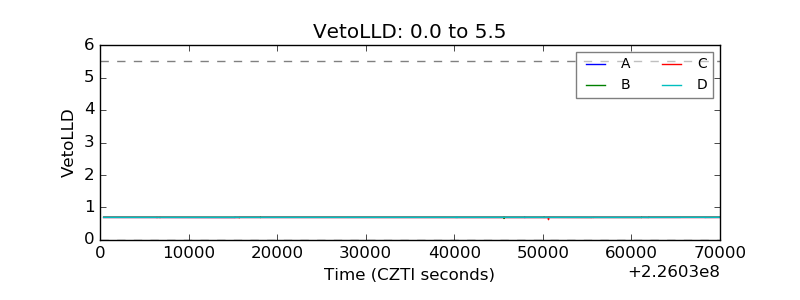 |
| Alpha Counter |  |
| _CPM_Rate |  |
| CZT Counter |  |
| +2.5 Volts monitor |  |
| +5 Volts monitor |  |
| _ROLL_ROT |  |
| _Roll_DEC |  |
| _Roll_RA |  |
| Veto Counter | 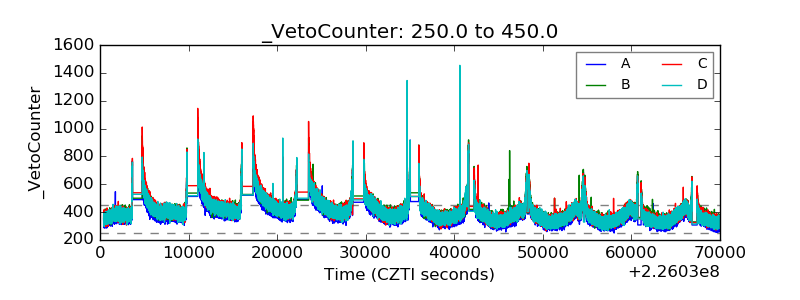 |