| Param | Original file | Final file |
|---|---|---|
| Filename | modeM0/AS1A02_155T01_9000001062_07700cztM0_level2.evt | modeM0/AS1A02_155T01_9000001062_07700cztM0_level2_quad_clean.evt |
| Size (bytes) | 492,874,560 | 67,582,080 |
| Size | 470.0 MB | 64.5 MB |
| Events in quadrant A | 2,883,581 | 421,910 |
| Events in quadrant B | 2,974,490 | 432,620 |
| Events in quadrant C | 2,868,850 | 423,939 |
| Events in quadrant D | 5,809,098 | 365,514 |
| Mode M9 | |||
|---|---|---|---|
| Quadrant | BADHDUFLAG | Total packets | Discarded packets |
| A | 0 | 13 | 0 |
| B | 0 | 13 | 0 |
| C | 0 | 13 | 0 |
| D | 0 | 13 | 0 |
| Mode SS | |||
|---|---|---|---|
| Quadrant | BADHDUFLAG | Total packets | Discarded packets |
| A | 0 | 116 | 0 |
| B | 0 | 116 | 0 |
| C | 0 | 116 | 0 |
| D | 0 | 116 | 0 |
| Mode M0 | |||
|---|---|---|---|
| Quadrant | BADHDUFLAG | Total packets | Discarded packets |
| A | 0 | 11992 | 2 |
| B | 0 | 12123 | 1 |
| C | 0 | 11938 | 1 |
| D | 0 | 20974 | 1 |
| Quadrant | Total seconds | Saturated seconds | Saturation percentage |
|---|---|---|---|
| A | 5754 | 61 | 1.060132% |
| B | 5754 | 58 | 1.007994% |
| C | 5754 | 51 | 0.886340% |
| D | 5754 | 1328 | 23.079597% |
Noise dominated data is calculated using 1-second bins in cleaned event files. If a bin has >2000 counts, and if more than 50% of those come from <1% of pixels, then it is considered to be noise-dominated and hence unusable.
| Quadrant | # 1 sec bins | Bins with >0 counts | Bins with >2000 counts | High rate bins dominated by noise | Noise dominated (total time) | Noise dominated (detector-on time) | Marked lightcurve |
|---|---|---|---|---|---|---|---|
| A | 7079 | 5754 | 6 | 6 | 0.08% | 0.10% | 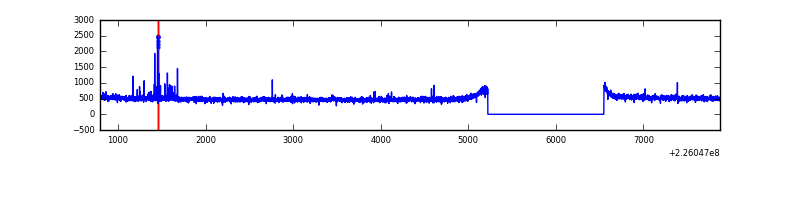 |
| B | 7079 | 5755 | 0 | 0 | 0.00% | 0.00% | 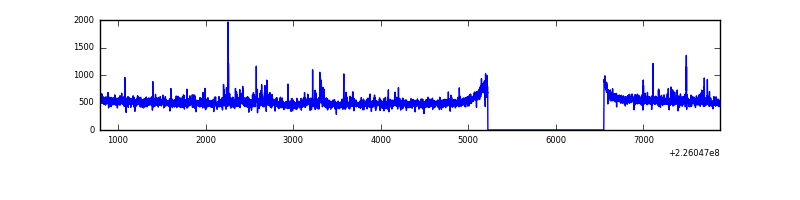 |
| C | 7079 | 5755 | 2 | 2 | 0.03% | 0.03% | 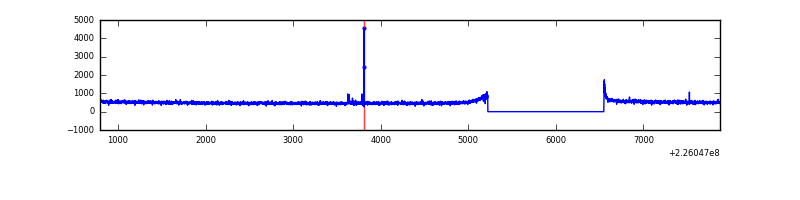 |
| D | 7079 | 5755 | 1187 | 1187 | 16.77% | 20.63% | 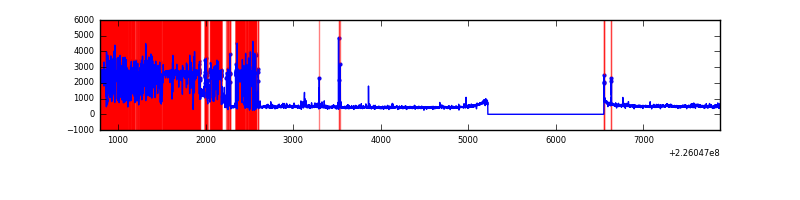 |
Top three noisy pixels from each quadrant. If the there are fewer than three noisy pixels in the level2.evt file, extra rows are filled as -1
| Pixel properties | Quadrant properties | ||||||
|---|---|---|---|---|---|---|---|
| Quadrant | DetID | PixID | Counts | Sigma | Mean | Median | Sigma |
| A | 13 | 248 | 39083 | 259.32 | 738 | 722 | 147.9 |
| A | 0 | 226 | 7128 | 43.3 | 738 | 722 | 147.9 |
| A | 12 | 194 | 6377 | 38.23 | 738 | 722 | 147.9 |
| B | 15 | 85 | 42319 | 300.24 | 740 | 723 | 138.5 |
| B | 0 | 214 | 25715 | 180.39 | 740 | 723 | 138.5 |
| B | 0 | 230 | 17841 | 123.56 | 740 | 723 | 138.5 |
| C | 9 | 68 | 15359 | 87.28 | 726 | 733 | 167.6 |
| C | 10 | 22 | 9342 | 51.37 | 726 | 733 | 167.6 |
| C | 8 | 229 | 7952 | 43.08 | 726 | 733 | 167.6 |
| D | 12 | 221 | 3327977 | 21777.87 | 630 | 613 | 152.8 |
| D | 1 | 83 | 31282 | 200.73 | 630 | 613 | 152.8 |
| D | 2 | 152 | 28301 | 181.22 | 630 | 613 | 152.8 |
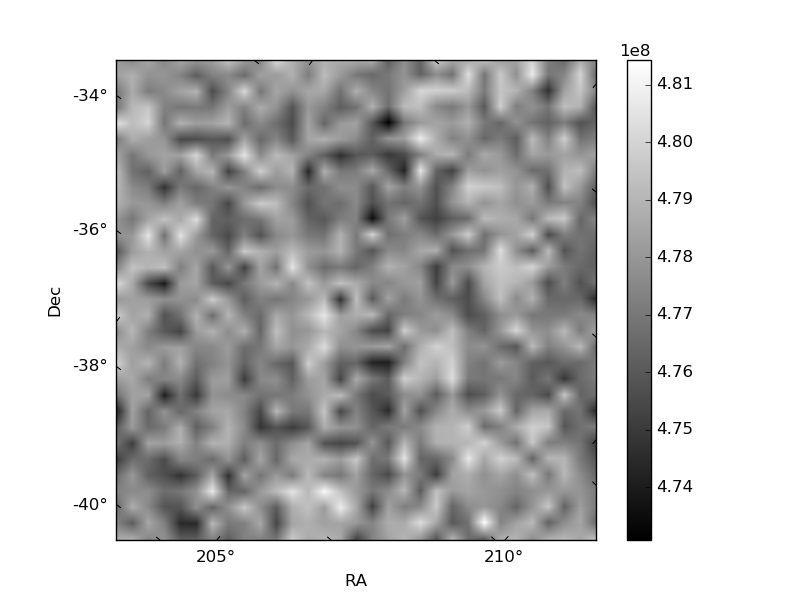
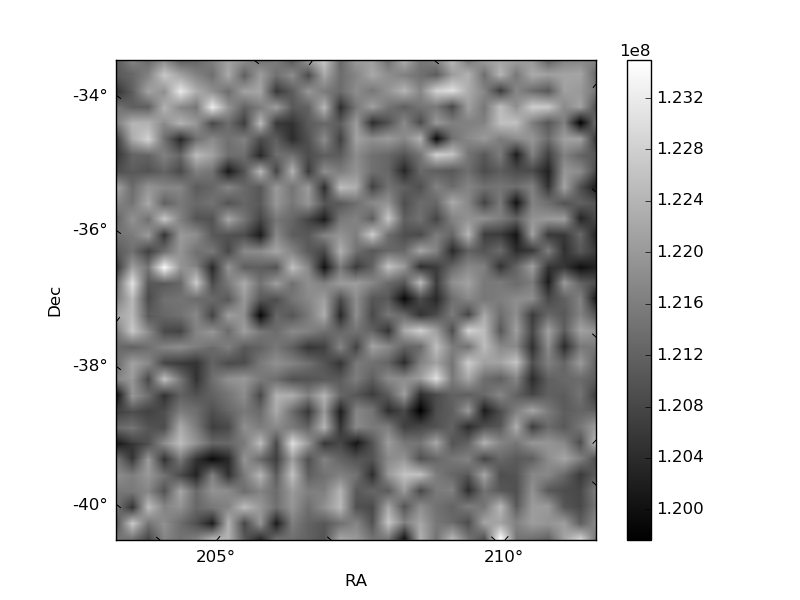
Histogram calculated using DETX and DETY for each event in the final _common_clean file
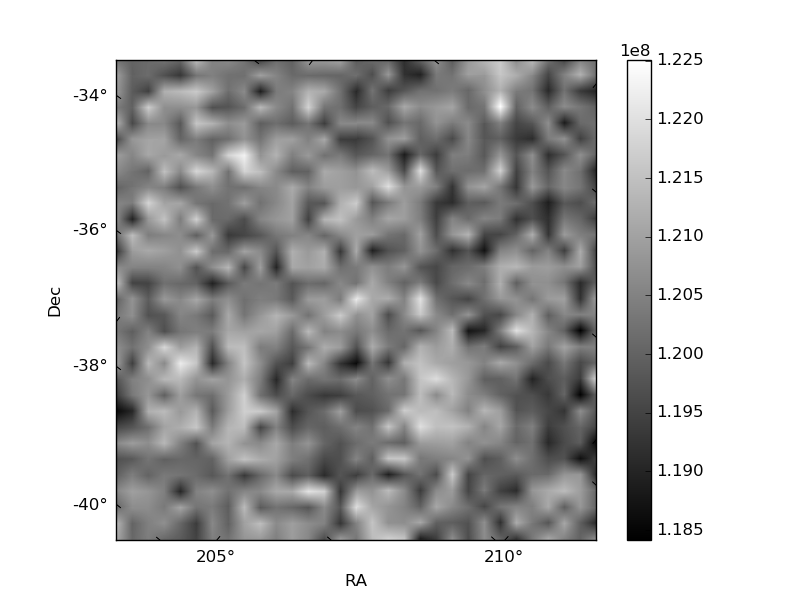
| Quadrant A | 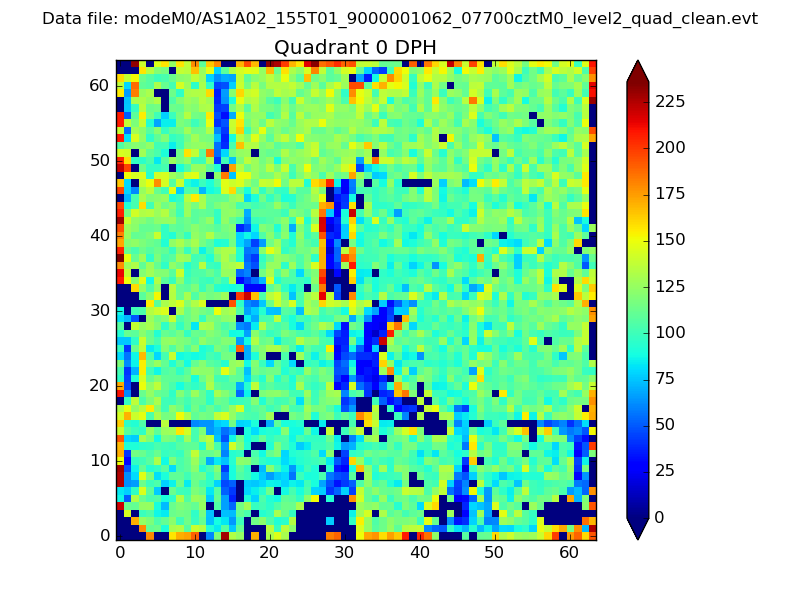 |
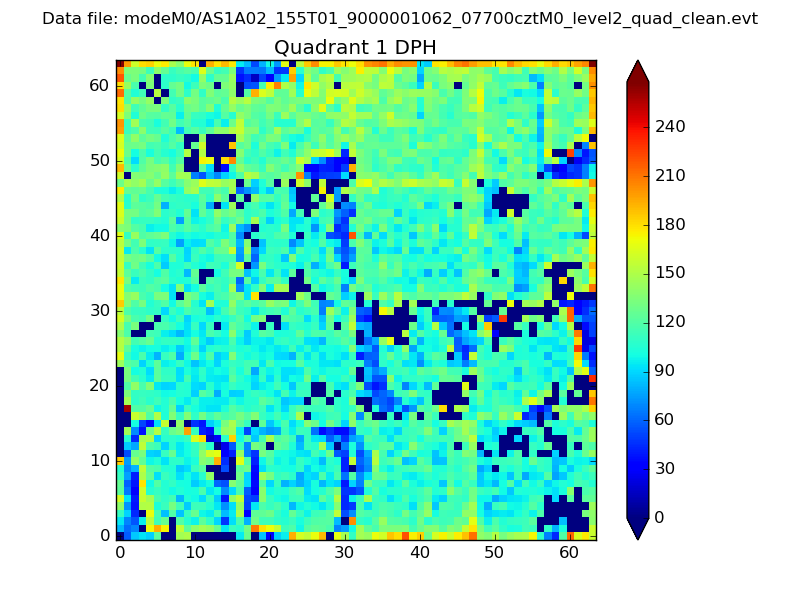 |
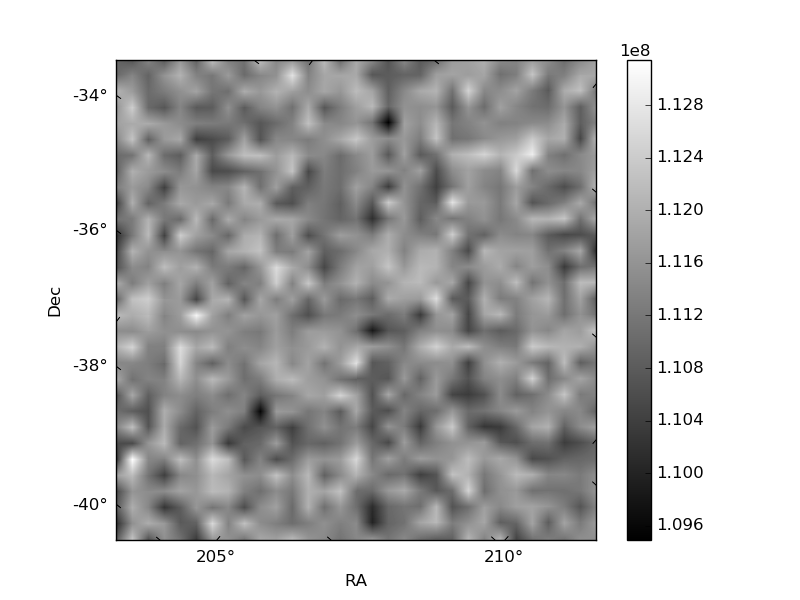
Quadrant B |
|---|---|---|---|
| Quadrant D |  |
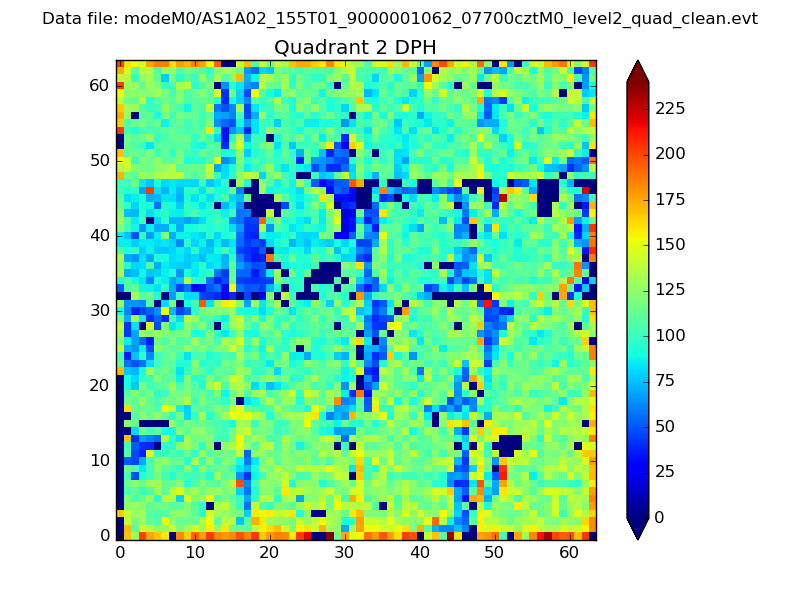 |
Quadrant C |
| Plot type | Count rate plots | Images |
|---|---|---|
| Comparison with Poisson distribution Blue bars denote a histogram of data divided into 1 sec bins. Red curve is a Poisson curve with rate = median count rate of data. |
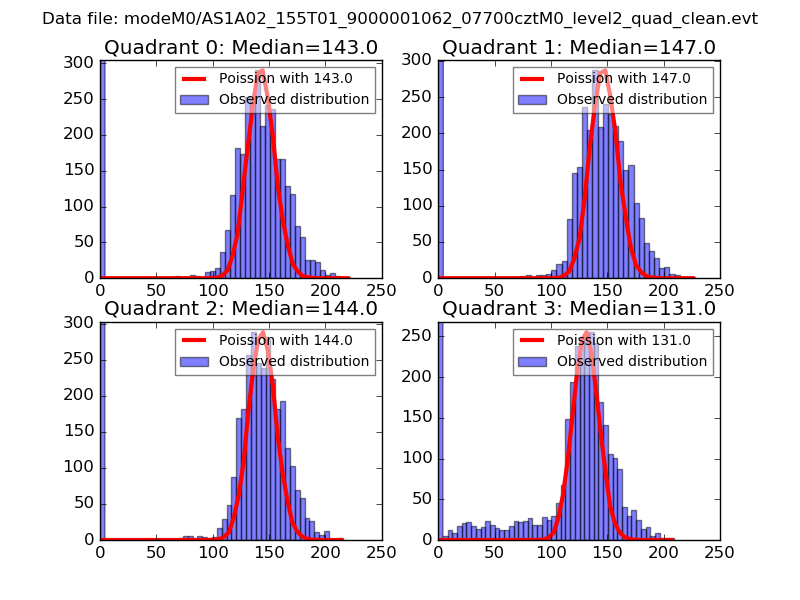 |
 |
| Quadrant-wise count rates Data is divided into 100 sec bins |
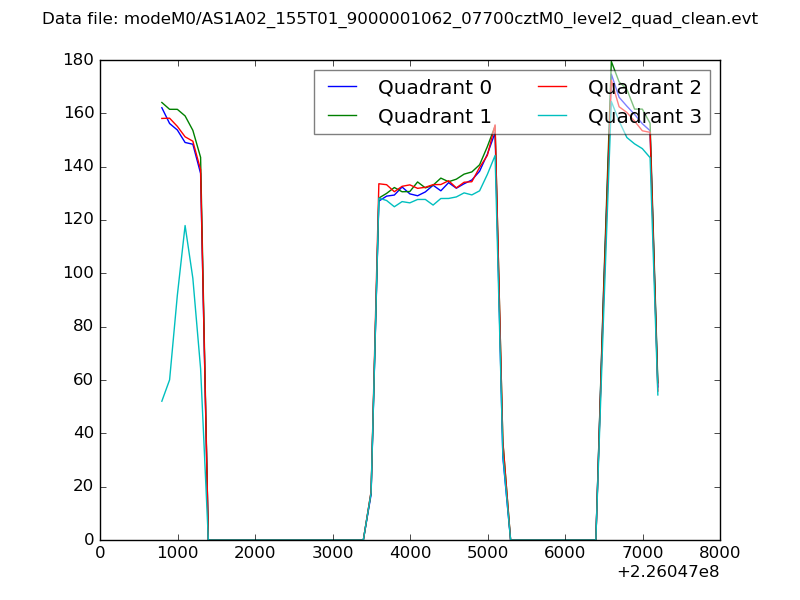 |
|
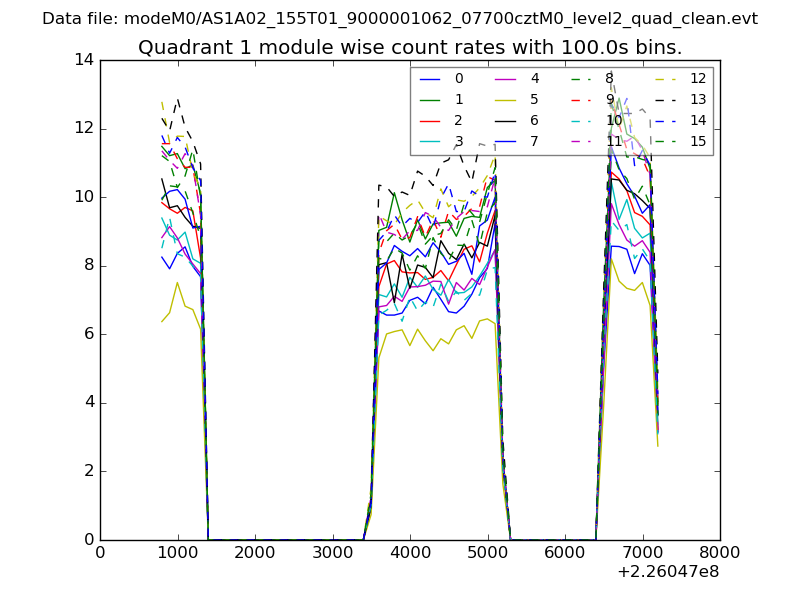
| Module-wise count rates for Quadrant A Data is divided into 100 sec bins |
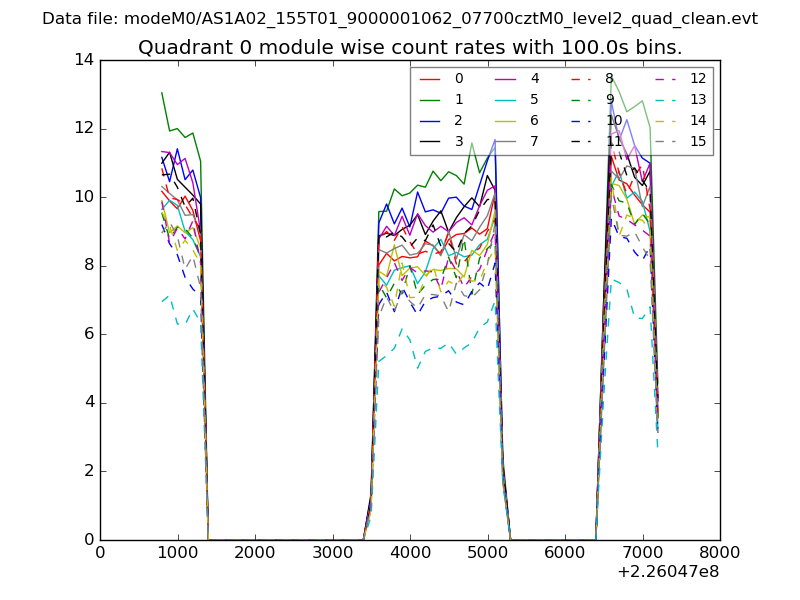 |
 |
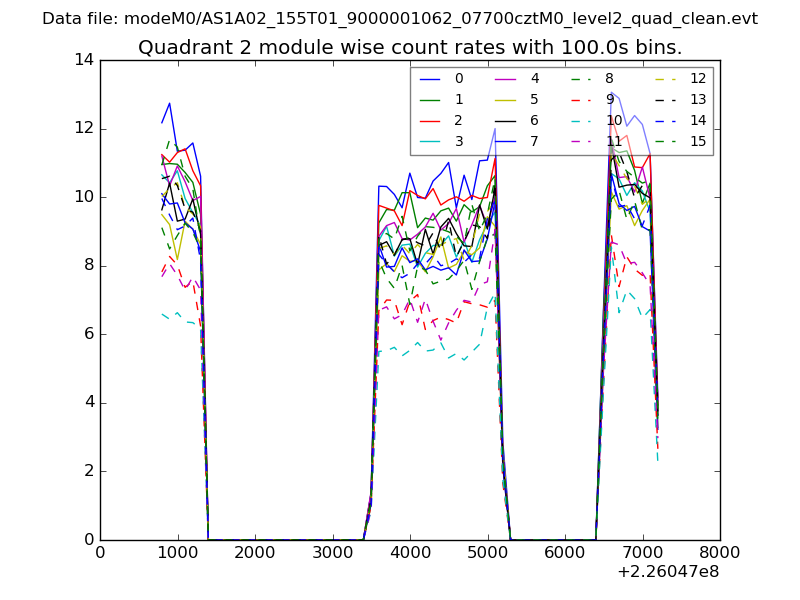
| Module-wise count rates for Quadrant B Data is divided into 100 sec bins |
 |
 |
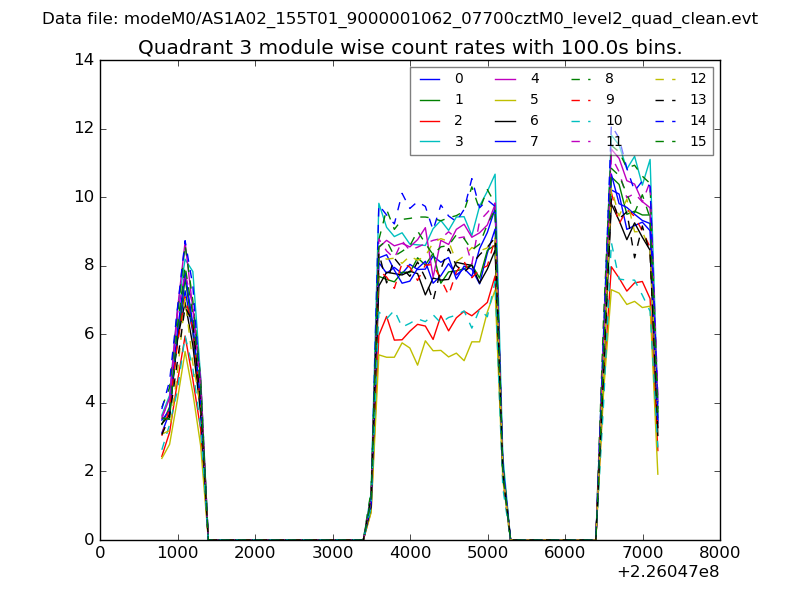
| Module-wise count rates for Quadrant C Data is divided into 100 sec bins |
 |
 |
| Module-wise count rates for Quadrant D Data is divided into 100 sec bins |
 |
 |
| Parameter | Plot |
|---|---|
| CZT HV Monitor | 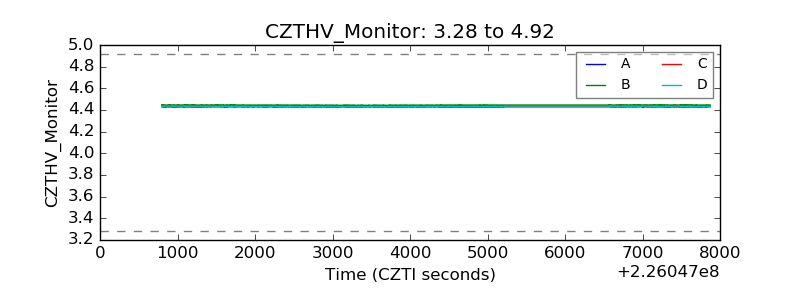 |
| D_VDD | 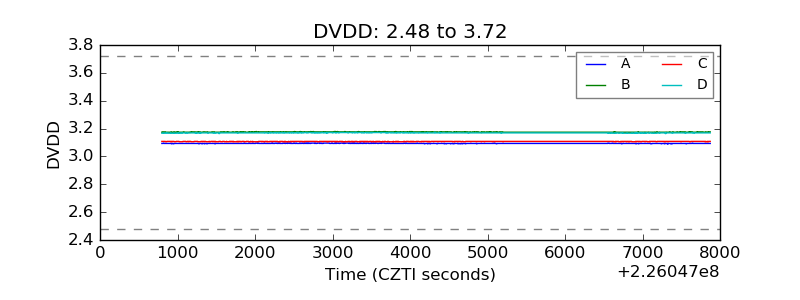 |
| Temperature 1 | 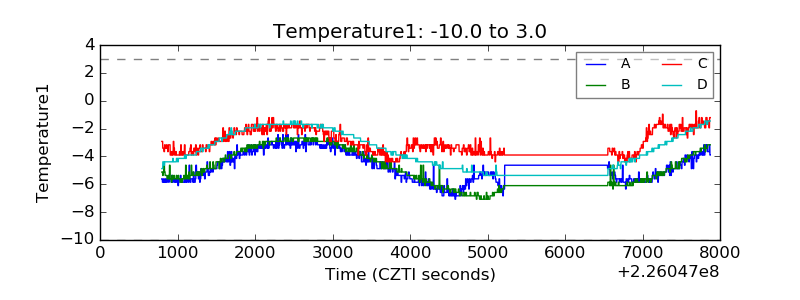 |
| Veto HV Monitor | 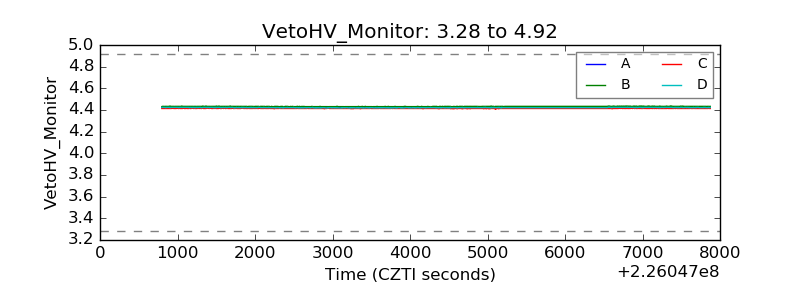 |
| Veto LLD | 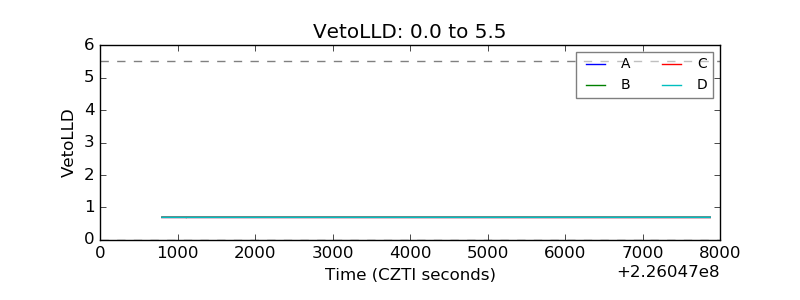 |
| Alpha Counter | 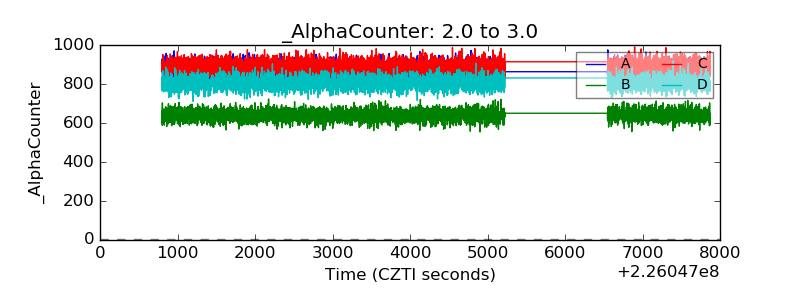 |
| _CPM_Rate | 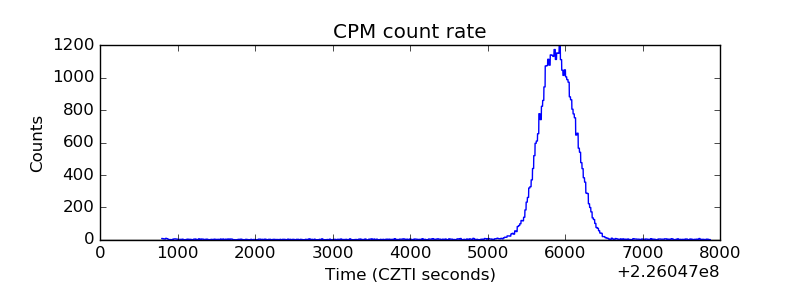 |
| CZT Counter | 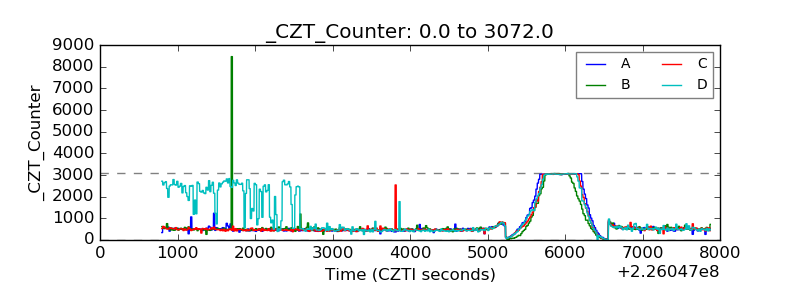 |
| +2.5 Volts monitor |  |
| +5 Volts monitor |  |
| _ROLL_ROT | 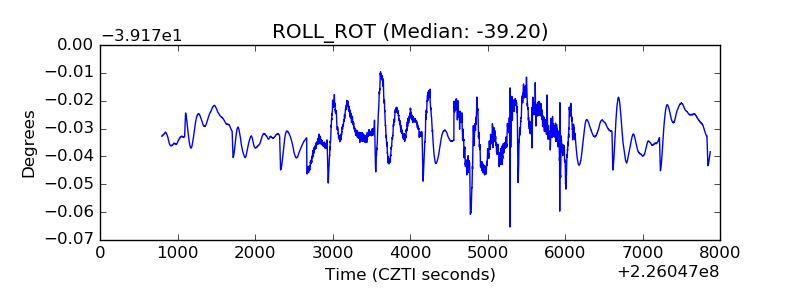 |
| _Roll_DEC | 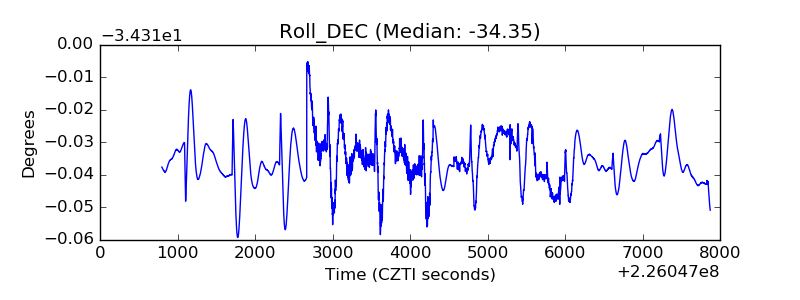 |
| _Roll_RA | 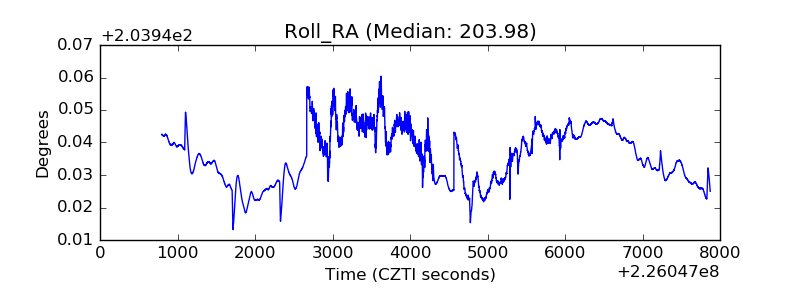 |
| Veto Counter | 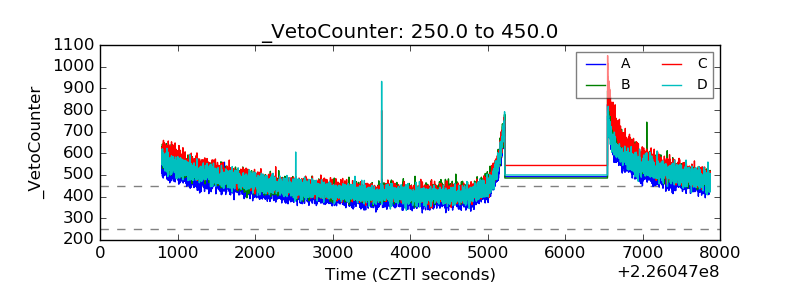 |