| Param | Original file | Final file |
|---|---|---|
| Filename | modeM0/AS1A02_155T01_9000001062_07701cztM0_level2.evt | modeM0/AS1A02_155T01_9000001062_07701cztM0_level2_quad_clean.evt |
| Size (bytes) | 436,573,440 | 72,092,160 |
| Size | 416.3 MB | 68.8 MB |
| Events in quadrant A | 3,154,524 | 437,370 |
| Events in quadrant B | 3,241,107 | 446,158 |
| Events in quadrant C | 3,212,818 | 439,189 |
| Events in quadrant D | 3,181,177 | 416,643 |
| Mode M9 | |||
|---|---|---|---|
| Quadrant | BADHDUFLAG | Total packets | Discarded packets |
| A | 0 | 17 | 0 |
| B | 0 | 17 | 0 |
| C | 0 | 17 | 0 |
| D | 0 | 18 | 0 |
| Mode SS | |||
|---|---|---|---|
| Quadrant | BADHDUFLAG | Total packets | Discarded packets |
| A | 0 | 130 | 0 |
| B | 0 | 130 | 0 |
| C | 0 | 130 | 0 |
| D | 0 | 130 | 0 |
| Mode M0 | |||
|---|---|---|---|
| Quadrant | BADHDUFLAG | Total packets | Discarded packets |
| A | 0 | 13239 | 3 |
| B | 0 | 13408 | 2 |
| C | 0 | 13477 | 2 |
| D | 0 | 13457 | 2 |
| Quadrant | Total seconds | Saturated seconds | Saturation percentage |
|---|---|---|---|
| A | 6358 | 118 | 1.855930% |
| B | 6358 | 103 | 1.620006% |
| C | 6358 | 91 | 1.431268% |
| D | 6358 | 97 | 1.525637% |
Noise dominated data is calculated using 1-second bins in cleaned event files. If a bin has >2000 counts, and if more than 50% of those come from <1% of pixels, then it is considered to be noise-dominated and hence unusable.
| Quadrant | # 1 sec bins | Bins with >0 counts | Bins with >2000 counts | High rate bins dominated by noise | Noise dominated (total time) | Noise dominated (detector-on time) | Marked lightcurve |
|---|---|---|---|---|---|---|---|
| A | 7583 | 6359 | 0 | 0 | 0.00% | 0.00% | 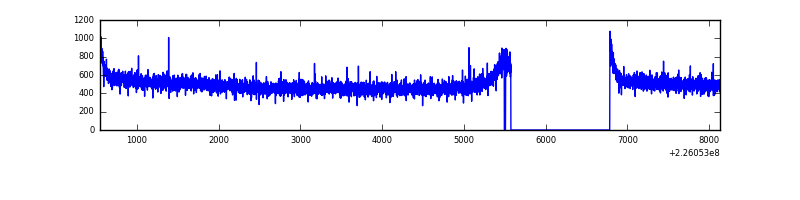 |
| B | 7583 | 6359 | 0 | 0 | 0.00% | 0.00% | 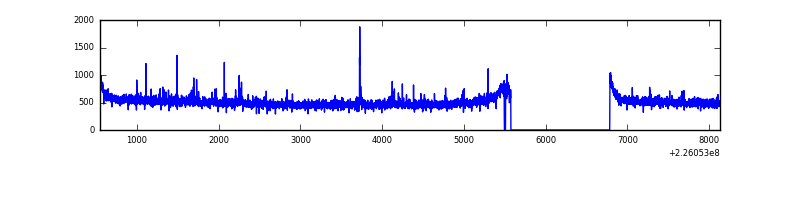 |
| C | 7583 | 6359 | 0 | 0 | 0.00% | 0.00% | 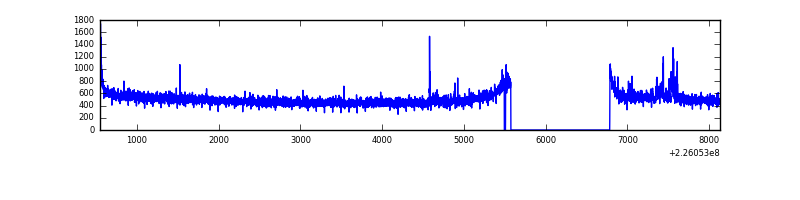 |
| D | 7583 | 6359 | 10 | 10 | 0.13% | 0.16% | 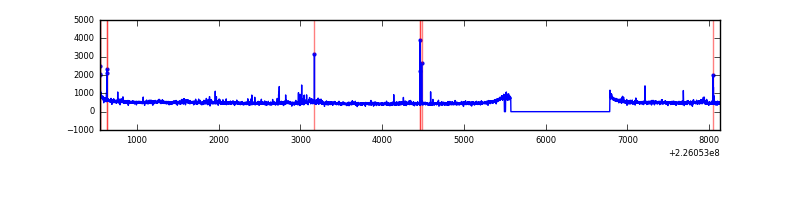 |
Top three noisy pixels from each quadrant. If the there are fewer than three noisy pixels in the level2.evt file, extra rows are filled as -1
| Pixel properties | Quadrant properties | ||||||
|---|---|---|---|---|---|---|---|
| Quadrant | DetID | PixID | Counts | Sigma | Mean | Median | Sigma |
| A | 0 | 226 | 7975 | 43.54 | 817 | 798 | 164.8 |
| A | 12 | 194 | 7173 | 38.68 | 817 | 798 | 164.8 |
| A | 13 | 14 | 5596 | 29.11 | 817 | 798 | 164.8 |
| B | 15 | 85 | 17947 | 111.23 | 817 | 797 | 154.2 |
| B | 12 | 111 | 15682 | 96.54 | 817 | 797 | 154.2 |
| B | 0 | 230 | 14706 | 90.21 | 817 | 797 | 154.2 |
| C | 9 | 68 | 66968 | 356.47 | 802 | 807 | 185.6 |
| C | 12 | 4 | 8072 | 39.14 | 802 | 807 | 185.6 |
| C | 8 | 229 | 6673 | 31.61 | 802 | 807 | 185.6 |
| D | 12 | 221 | 32125 | 159.71 | 801 | 775 | 196.3 |
| D | 2 | 152 | 27420 | 135.74 | 801 | 775 | 196.3 |
| D | 12 | 233 | 24436 | 120.54 | 801 | 775 | 196.3 |
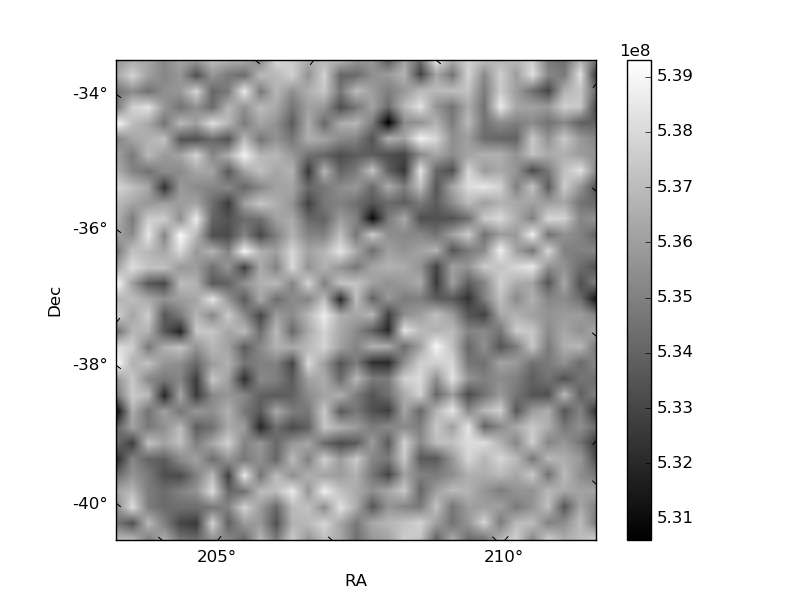
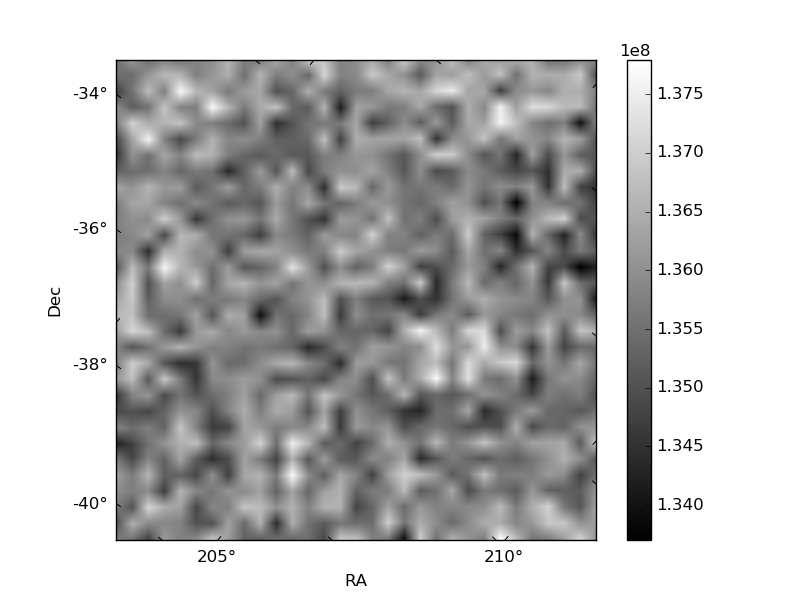
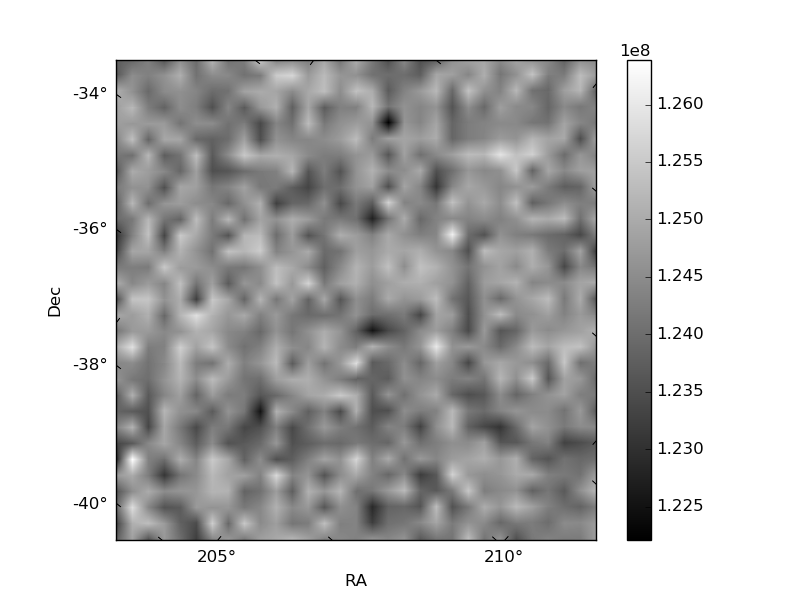
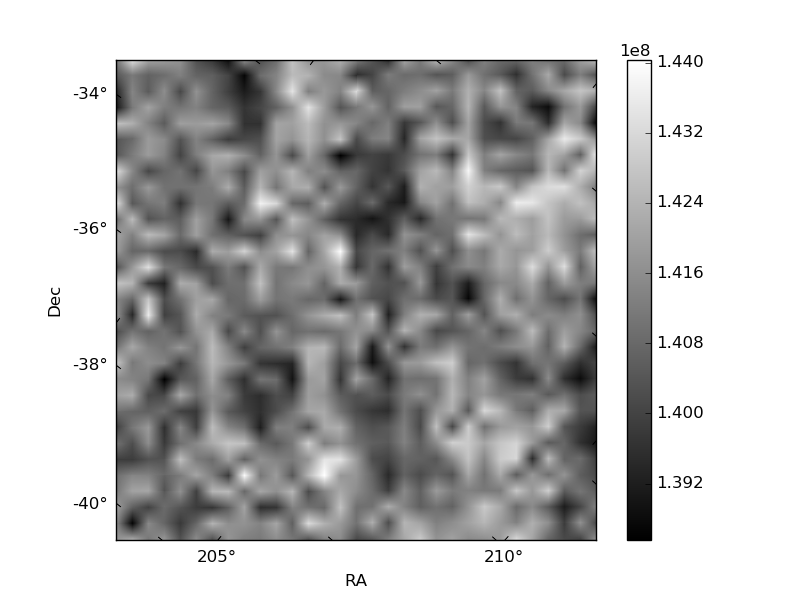
Histogram calculated using DETX and DETY for each event in the final _common_clean file
| Quadrant A | 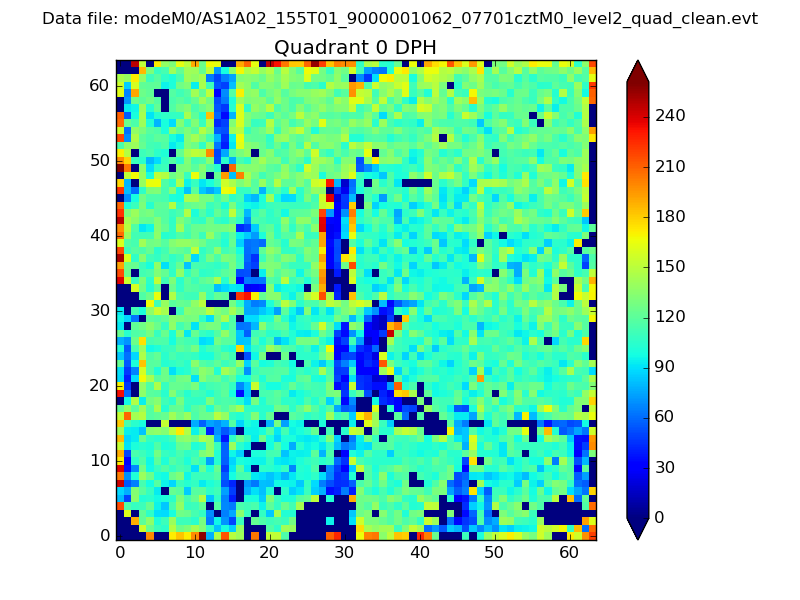 |
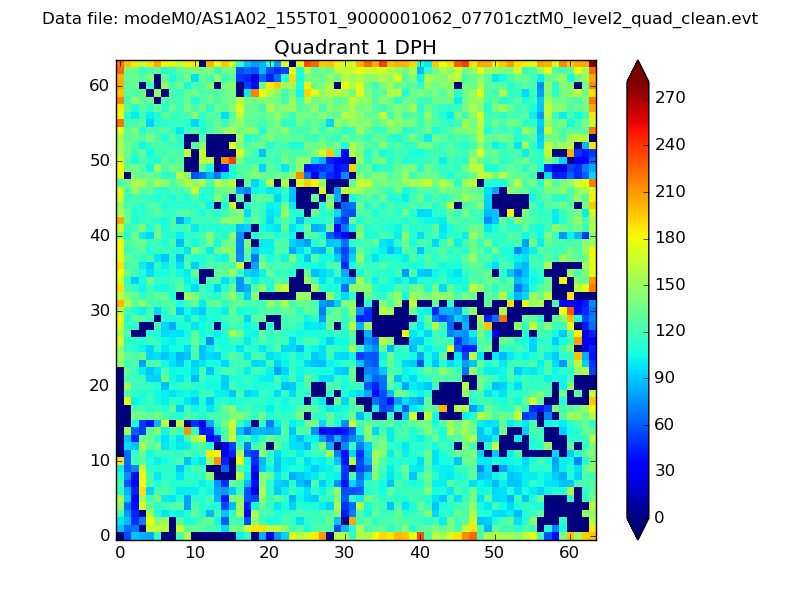 |
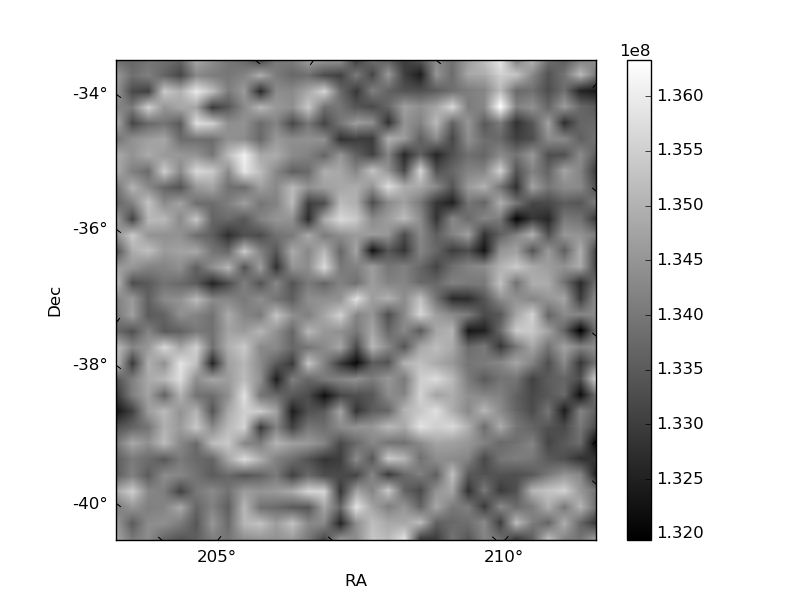
Quadrant B |
|---|---|---|---|
| Quadrant D | 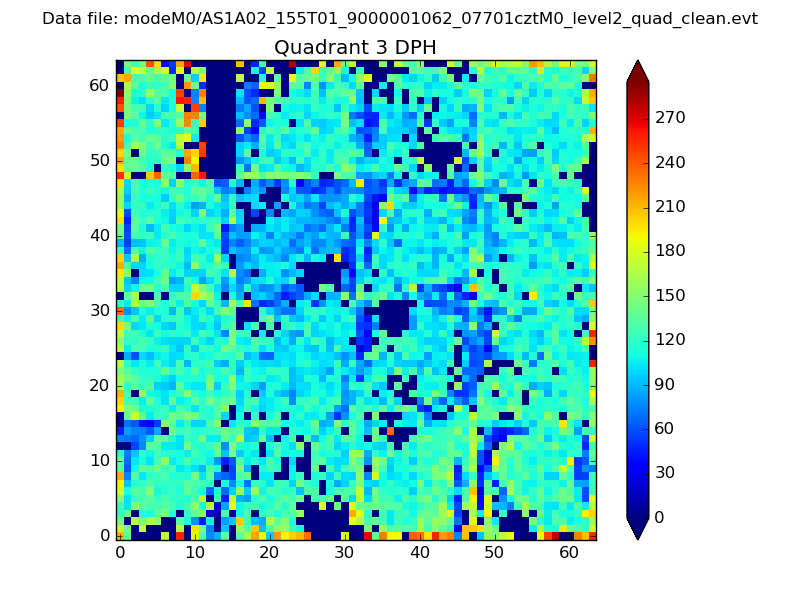 |
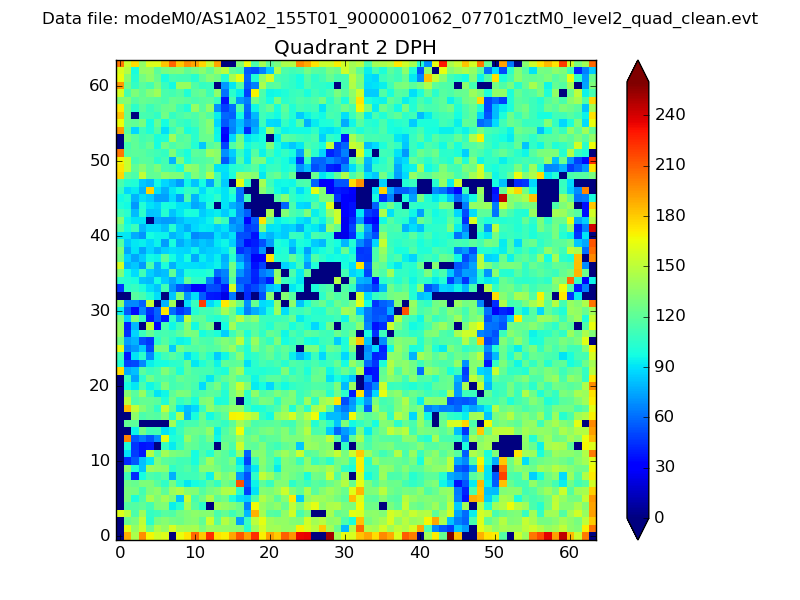 |
Quadrant C |
| Plot type | Count rate plots | Images |
|---|---|---|
| Comparison with Poisson distribution Blue bars denote a histogram of data divided into 1 sec bins. Red curve is a Poisson curve with rate = median count rate of data. |
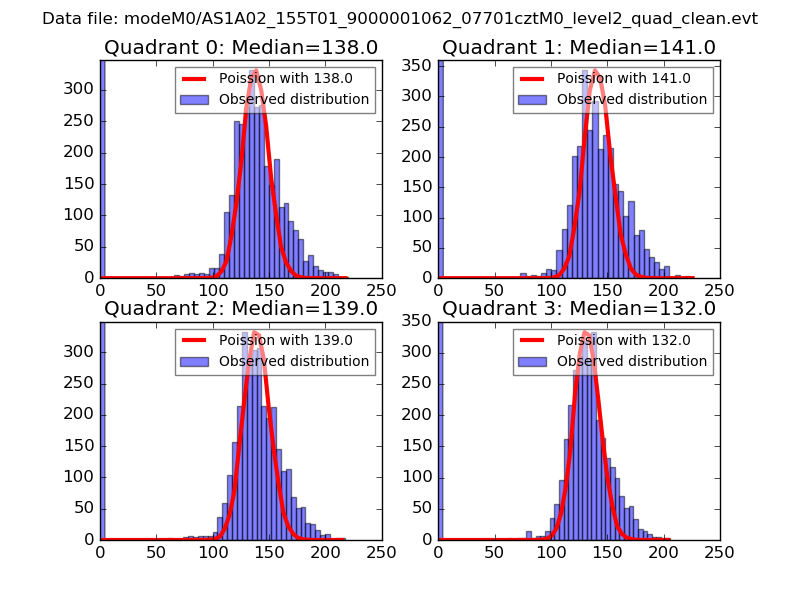 |
 |
| Quadrant-wise count rates Data is divided into 100 sec bins |
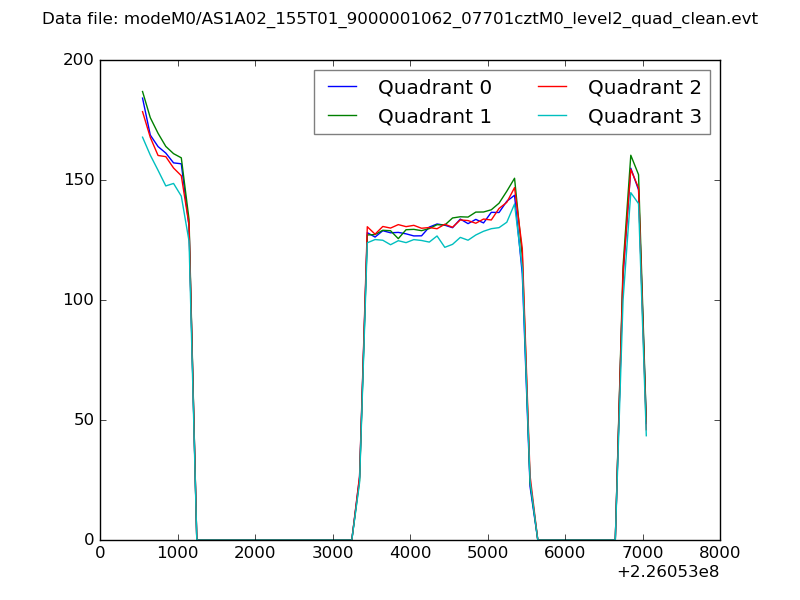 |
|
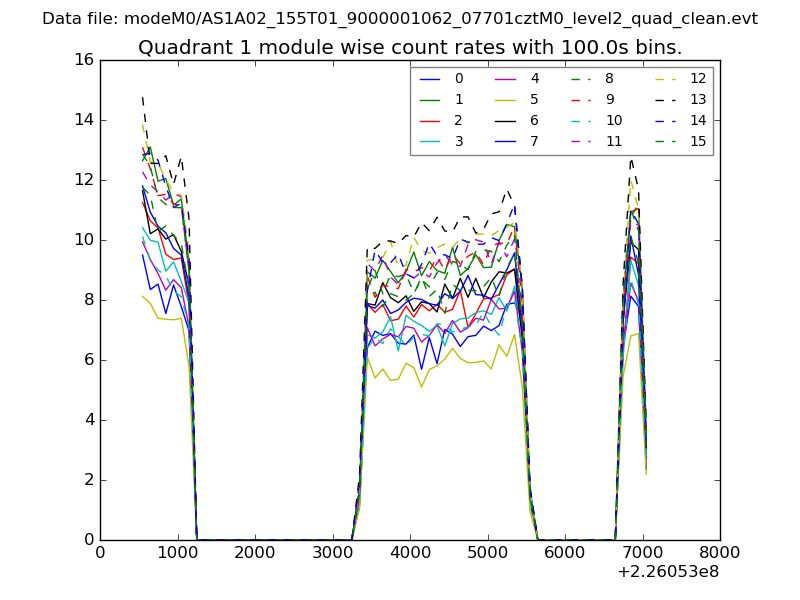
| Module-wise count rates for Quadrant A Data is divided into 100 sec bins |
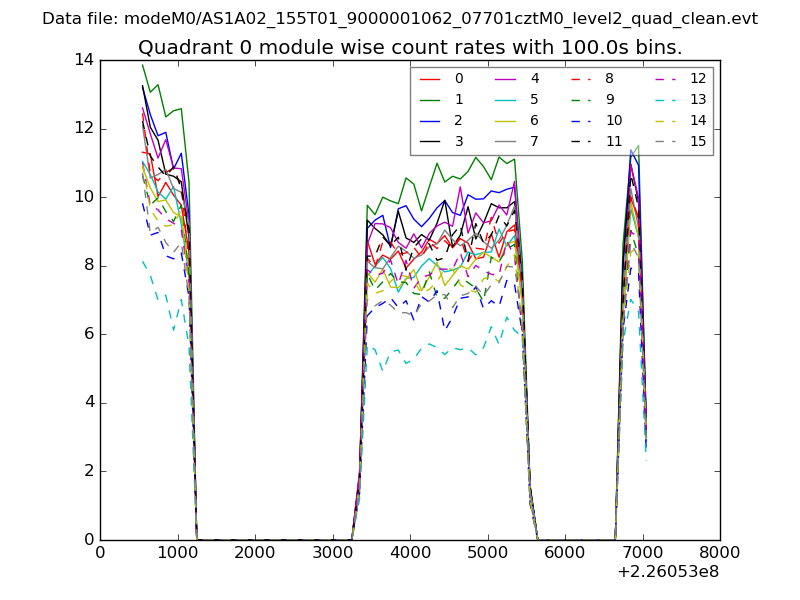 |
 |
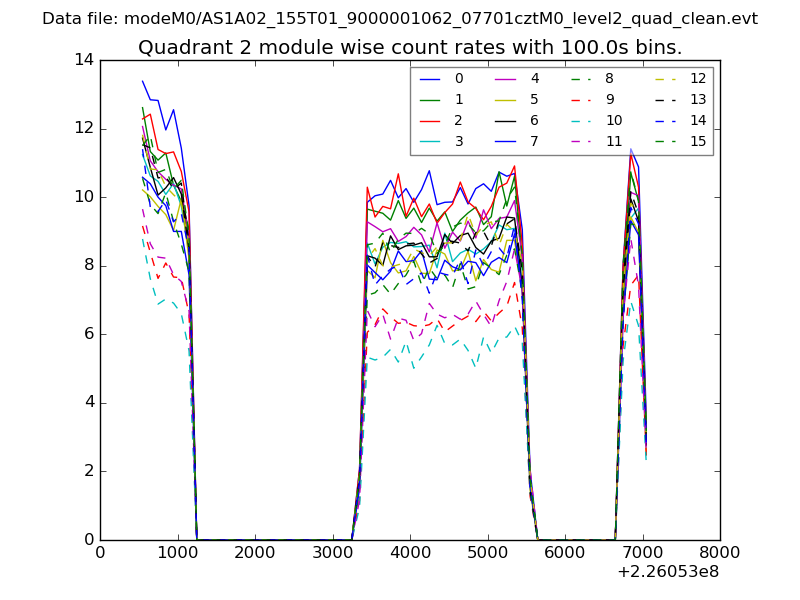
| Module-wise count rates for Quadrant B Data is divided into 100 sec bins |
 |
 |
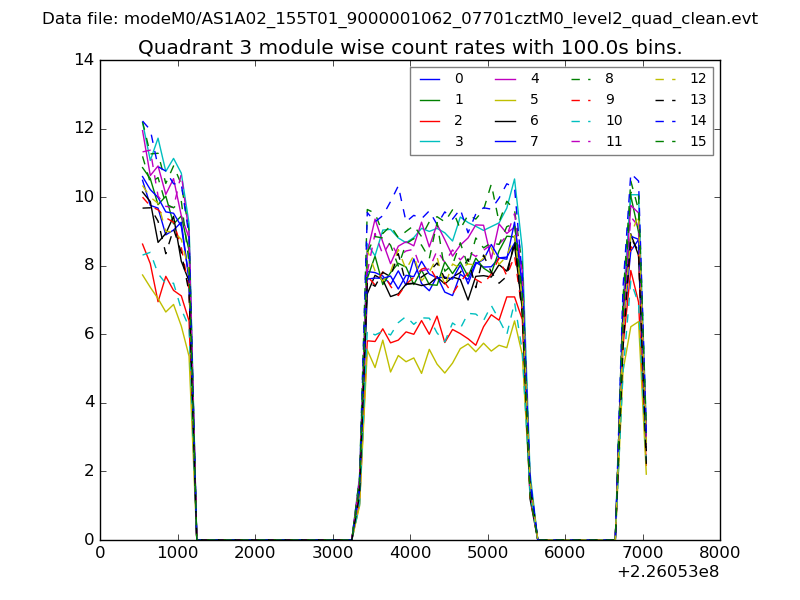
| Module-wise count rates for Quadrant C Data is divided into 100 sec bins |
 |
 |
| Module-wise count rates for Quadrant D Data is divided into 100 sec bins |
 |
 |
| Parameter | Plot |
|---|---|
| CZT HV Monitor | 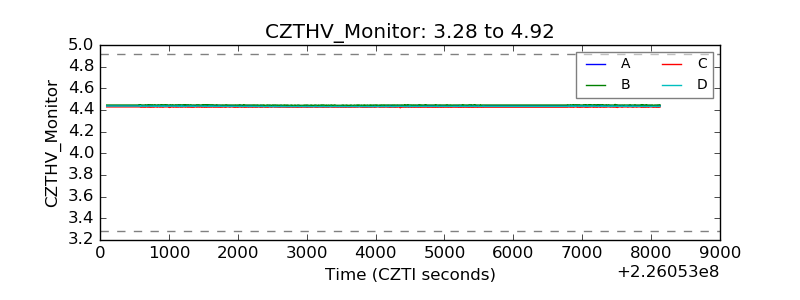 |
| D_VDD | 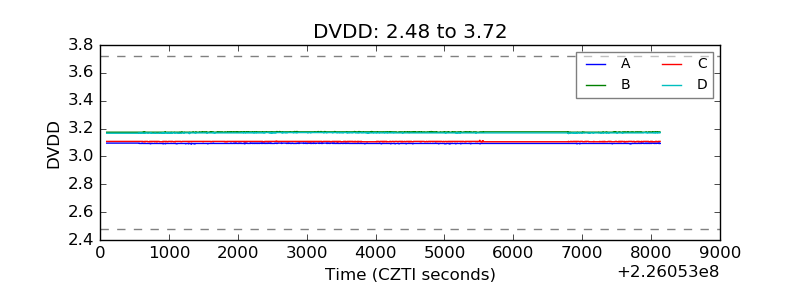 |
| Temperature 1 | 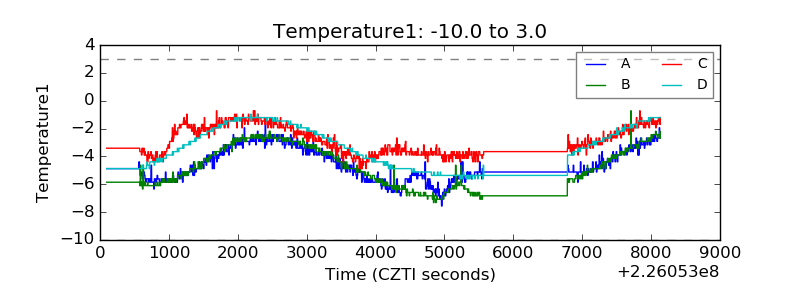 |
| Veto HV Monitor | 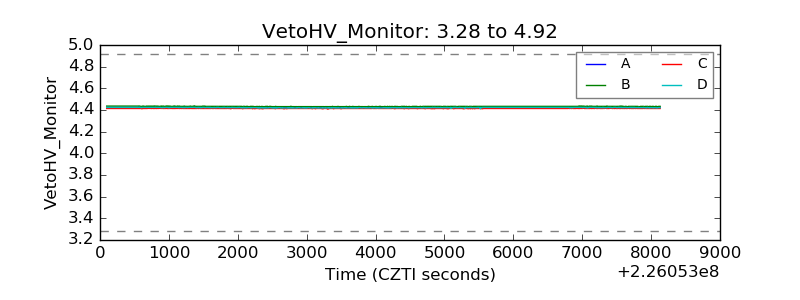 |
| Veto LLD | 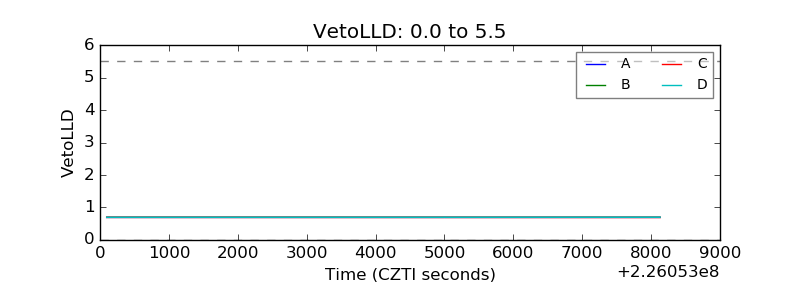 |
| Alpha Counter | 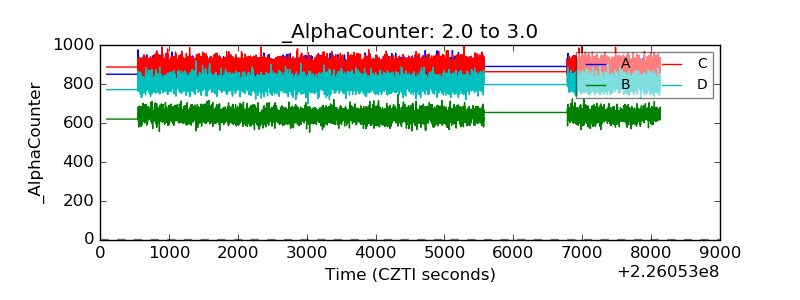 |
| _CPM_Rate | 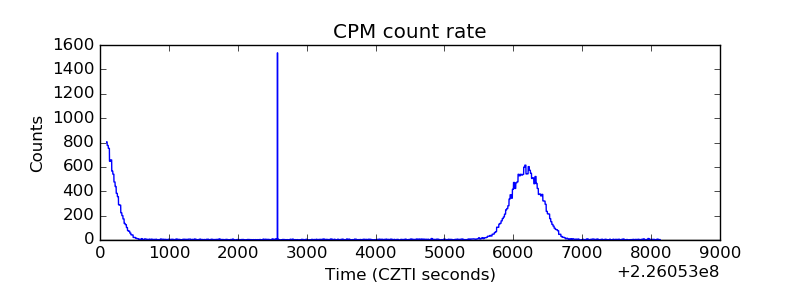 |
| CZT Counter | 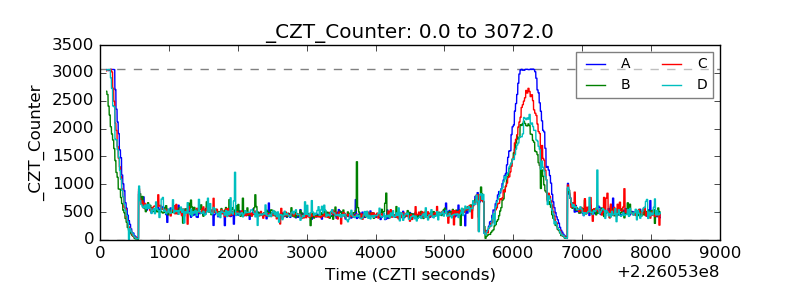 |
| +2.5 Volts monitor |  |
| +5 Volts monitor |  |
| _ROLL_ROT | 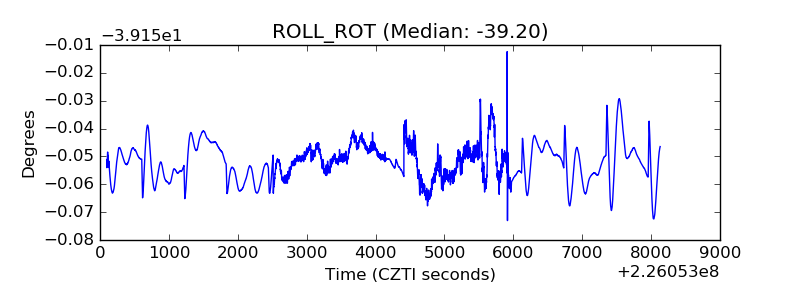 |
| _Roll_DEC | 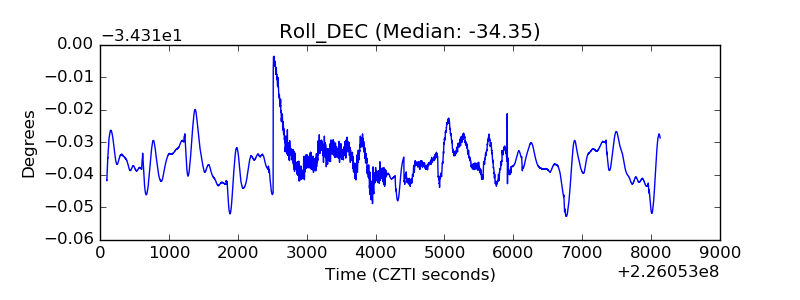 |
| _Roll_RA | 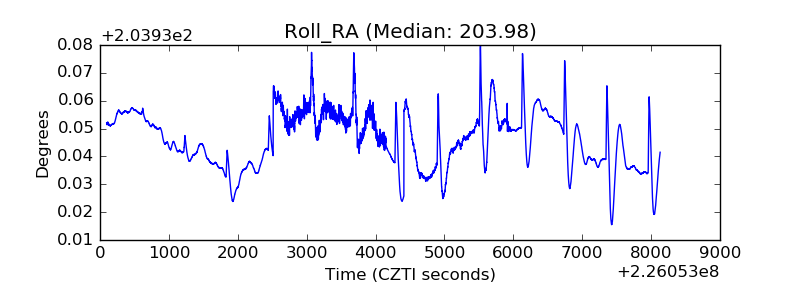 |
| Veto Counter | 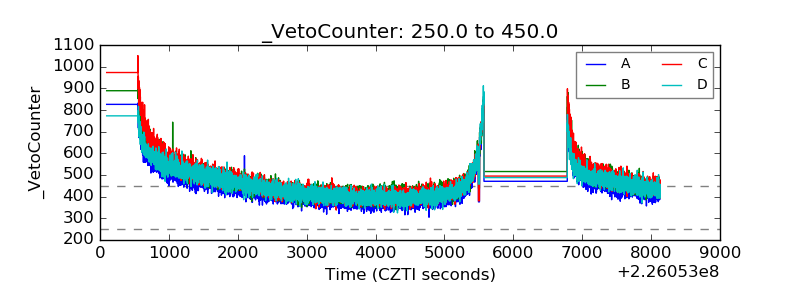 |