| Param | Original file | Final file |
|---|---|---|
| Filename | modeM0/AS1A02_155T01_9000001062_07702cztM0_level2.evt | modeM0/AS1A02_155T01_9000001062_07702cztM0_level2_quad_clean.evt |
| Size (bytes) | 452,712,960 | 67,636,800 |
| Size | 431.7 MB | 64.5 MB |
| Events in quadrant A | 3,225,510 | 398,710 |
| Events in quadrant B | 3,306,502 | 403,871 |
| Events in quadrant C | 3,267,330 | 397,381 |
| Events in quadrant D | 3,458,210 | 383,638 |
| Mode M9 | |||
|---|---|---|---|
| Quadrant | BADHDUFLAG | Total packets | Discarded packets |
| A | 0 | 9 | 0 |
| B | 0 | 9 | 0 |
| C | 0 | 9 | 0 |
| D | 0 | 9 | 0 |
| Mode SS | |||
|---|---|---|---|
| Quadrant | BADHDUFLAG | Total packets | Discarded packets |
| A | 0 | 138 | 0 |
| B | 0 | 138 | 0 |
| C | 0 | 138 | 0 |
| D | 0 | 138 | 0 |
| Mode M0 | |||
|---|---|---|---|
| Quadrant | BADHDUFLAG | Total packets | Discarded packets |
| A | 0 | 13844 | 3 |
| B | 0 | 13914 | 2 |
| C | 0 | 14060 | 2 |
| D | 0 | 14580 | 2 |
| Quadrant | Total seconds | Saturated seconds | Saturation percentage |
|---|---|---|---|
| A | 6650 | 136 | 2.045113% |
| B | 6650 | 133 | 2.000000% |
| C | 6650 | 100 | 1.503759% |
| D | 6650 | 119 | 1.789474% |
Noise dominated data is calculated using 1-second bins in cleaned event files. If a bin has >2000 counts, and if more than 50% of those come from <1% of pixels, then it is considered to be noise-dominated and hence unusable.
| Quadrant | # 1 sec bins | Bins with >0 counts | Bins with >2000 counts | High rate bins dominated by noise | Noise dominated (total time) | Noise dominated (detector-on time) | Marked lightcurve |
|---|---|---|---|---|---|---|---|
| A | 7620 | 6650 | 0 | 0 | 0.00% | 0.00% |  |
| B | 7620 | 6650 | 1 | 1 | 0.01% | 0.02% |  |
| C | 7620 | 6650 | 0 | 0 | 0.00% | 0.00% |  |
| D | 7620 | 6650 | 14 | 14 | 0.18% | 0.21% |  |
Top three noisy pixels from each quadrant. If the there are fewer than three noisy pixels in the level2.evt file, extra rows are filled as -1
| Pixel properties | Quadrant properties | ||||||
|---|---|---|---|---|---|---|---|
| Quadrant | DetID | PixID | Counts | Sigma | Mean | Median | Sigma |
| A | 0 | 226 | 8090 | 42.59 | 835 | 817 | 170.8 |
| A | 12 | 194 | 7266 | 37.76 | 835 | 817 | 170.8 |
| A | 13 | 14 | 5698 | 28.58 | 835 | 817 | 170.8 |
| B | 12 | 111 | 16631 | 98.84 | 836 | 817 | 160.0 |
| B | 11 | 111 | 13235 | 77.62 | 836 | 817 | 160.0 |
| B | 0 | 230 | 11869 | 69.08 | 836 | 817 | 160.0 |
| C | 9 | 68 | 69232 | 360.11 | 817 | 821 | 190.0 |
| C | 12 | 4 | 6723 | 31.07 | 817 | 821 | 190.0 |
| C | 13 | 61 | 6262 | 28.64 | 817 | 821 | 190.0 |
| D | 2 | 152 | 236760 | 1182.07 | 817 | 791 | 199.6 |
| D | 12 | 233 | 58127 | 287.22 | 817 | 791 | 199.6 |
| D | 12 | 0 | 37733 | 185.06 | 817 | 791 | 199.6 |
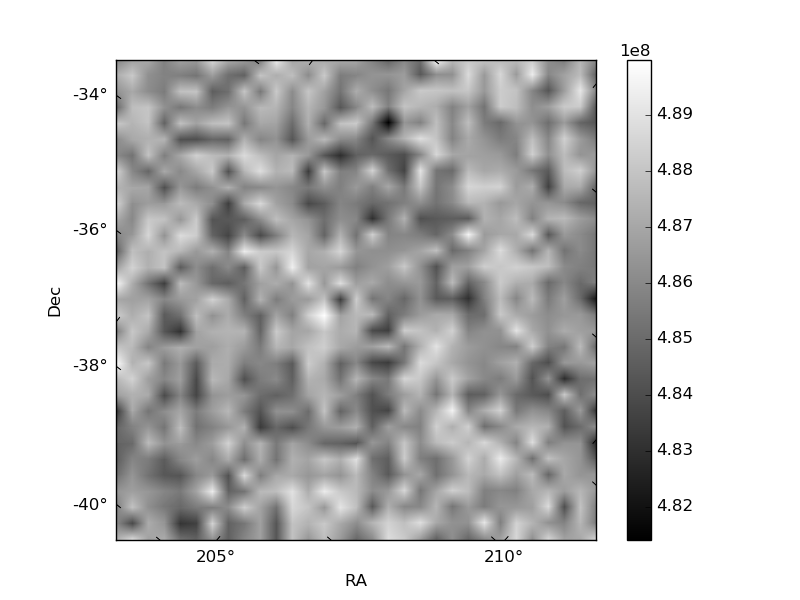
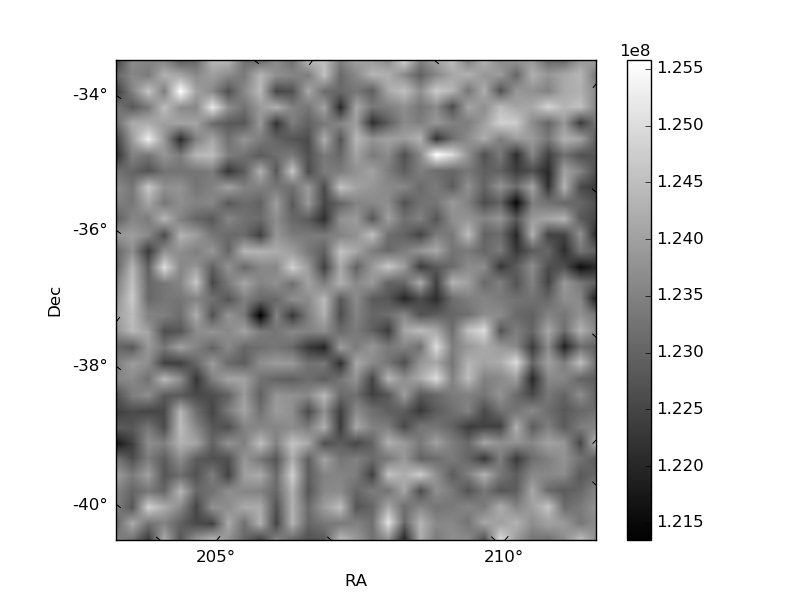
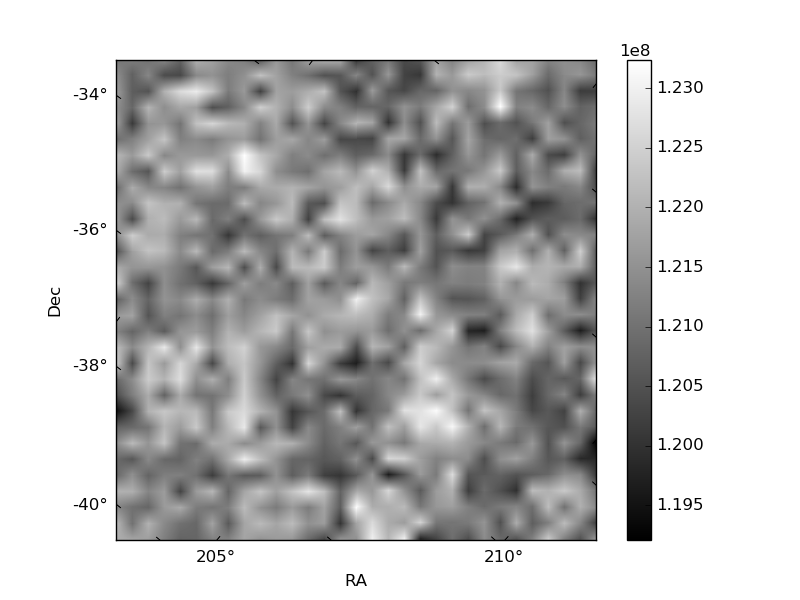
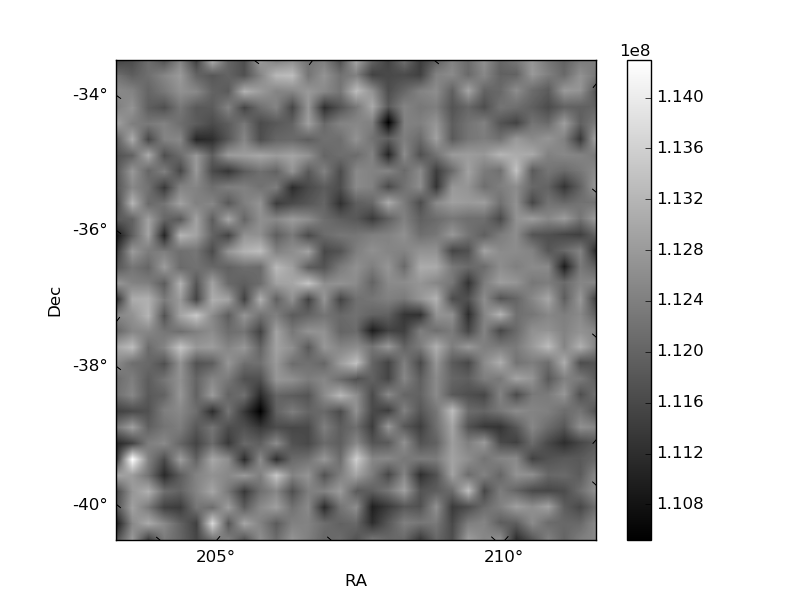
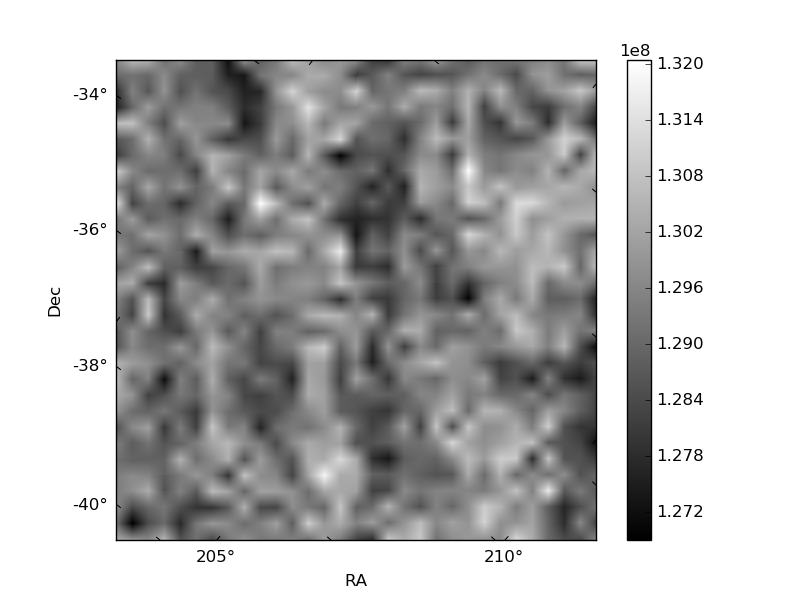
Histogram calculated using DETX and DETY for each event in the final _common_clean file
| Quadrant A | 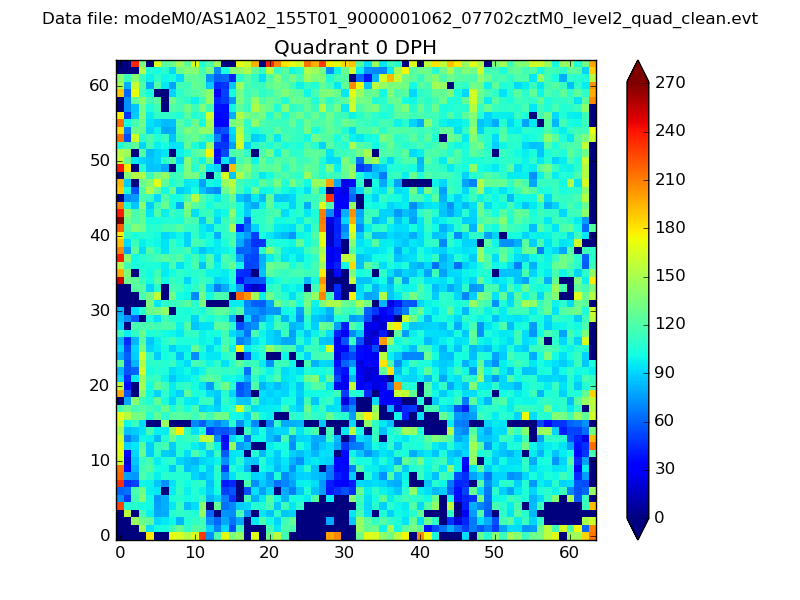 |
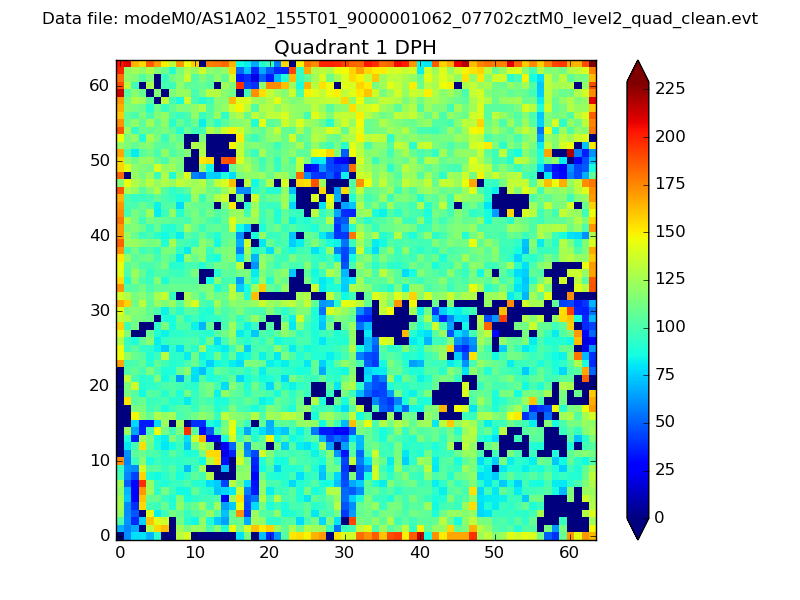 |
Quadrant B |
|---|---|---|---|
| Quadrant D | 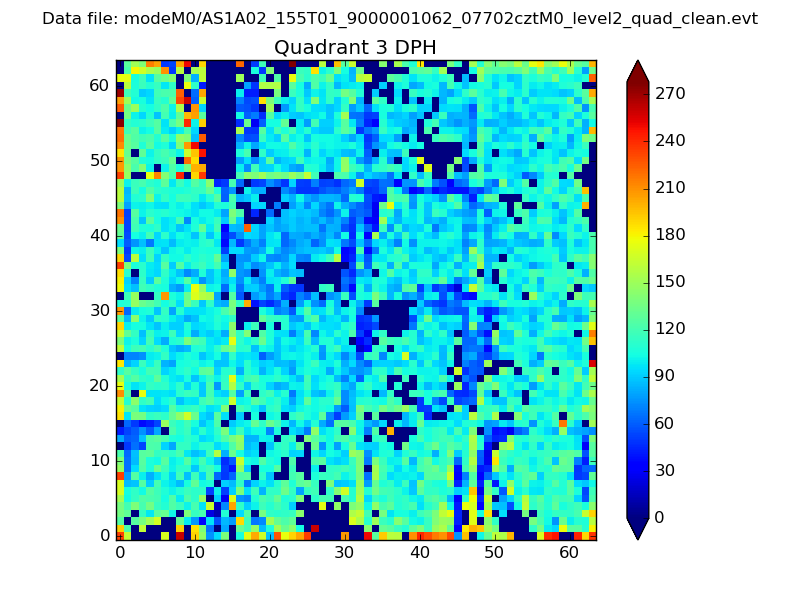 |
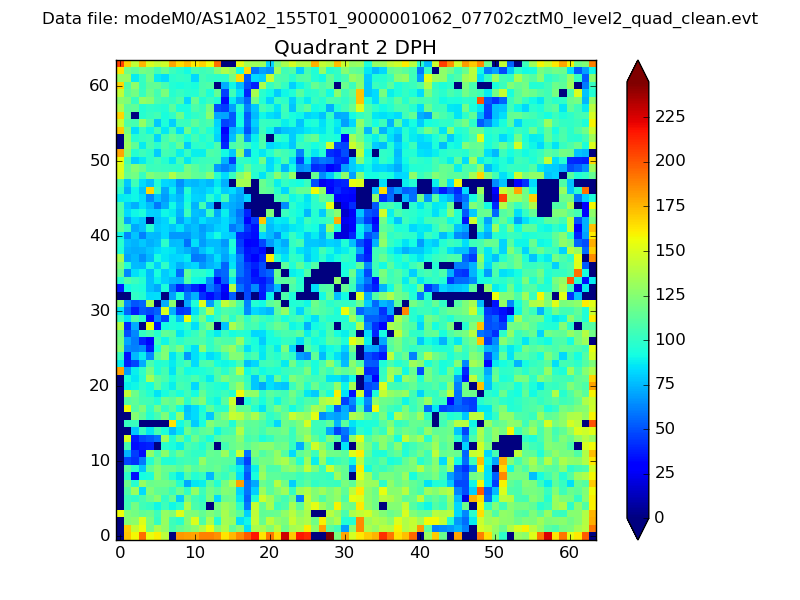 |
Quadrant C |
| Plot type | Count rate plots | Images |
|---|---|---|
| Comparison with Poisson distribution Blue bars denote a histogram of data divided into 1 sec bins. Red curve is a Poisson curve with rate = median count rate of data. |
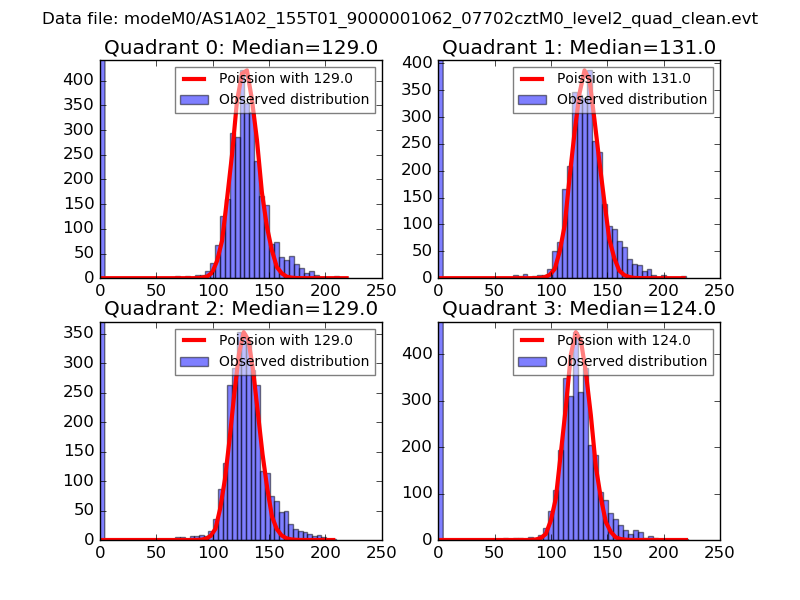 |
 |
| Quadrant-wise count rates Data is divided into 100 sec bins |
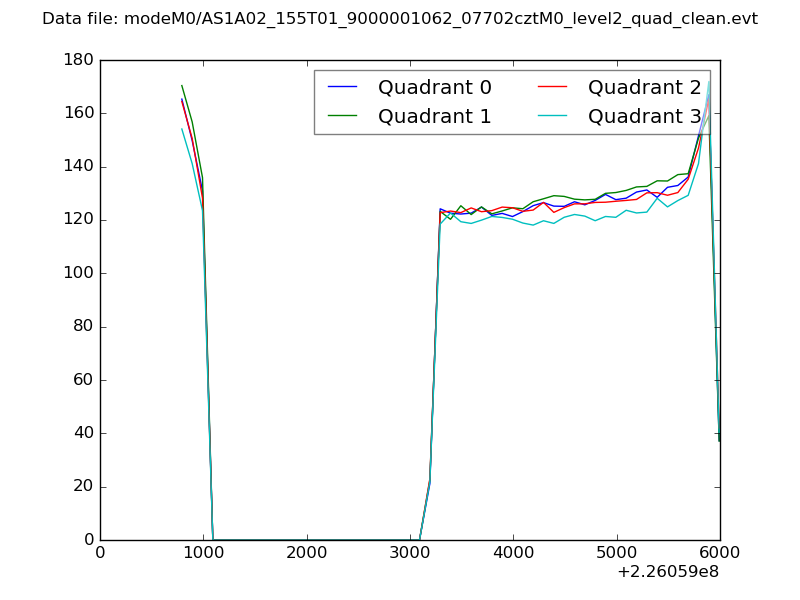 |
|
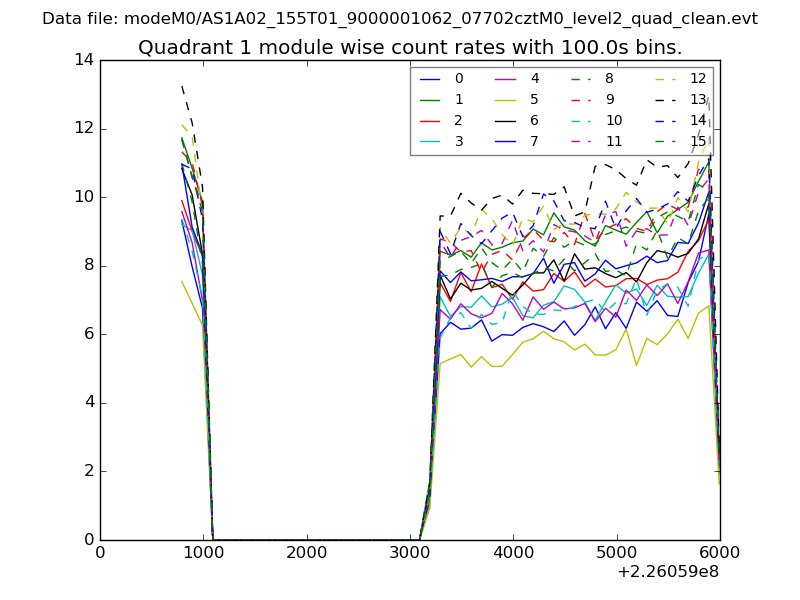
| Module-wise count rates for Quadrant A Data is divided into 100 sec bins |
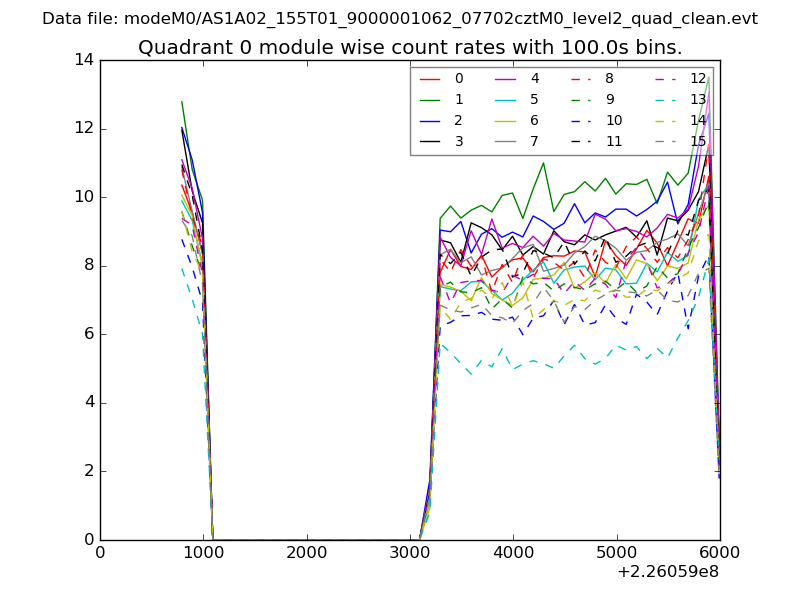 |
 |
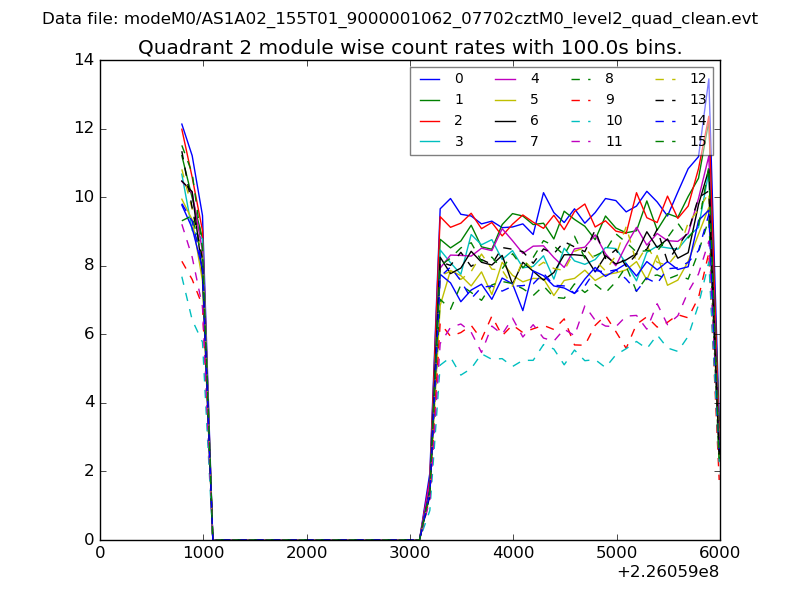
| Module-wise count rates for Quadrant B Data is divided into 100 sec bins |
 |
 |
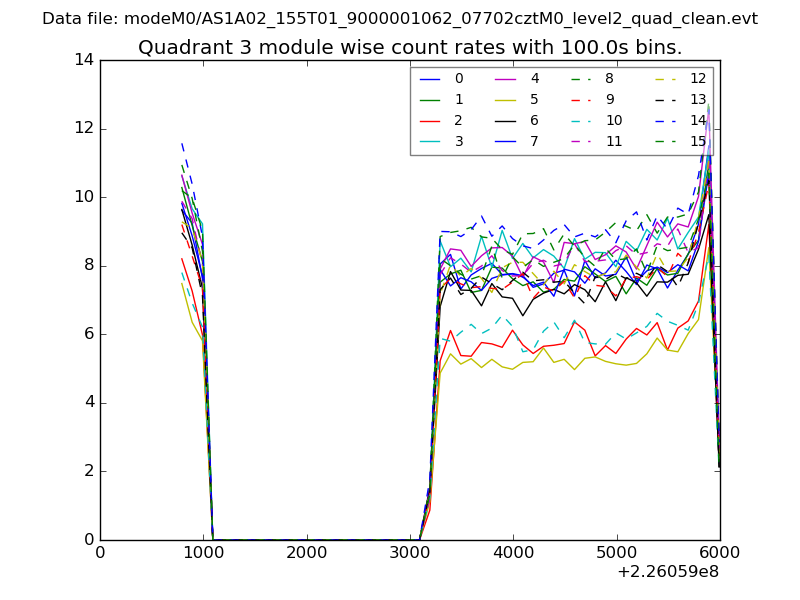
| Module-wise count rates for Quadrant C Data is divided into 100 sec bins |
 |
 |
| Module-wise count rates for Quadrant D Data is divided into 100 sec bins |
 |
 |
| Parameter | Plot |
|---|---|
| CZT HV Monitor | 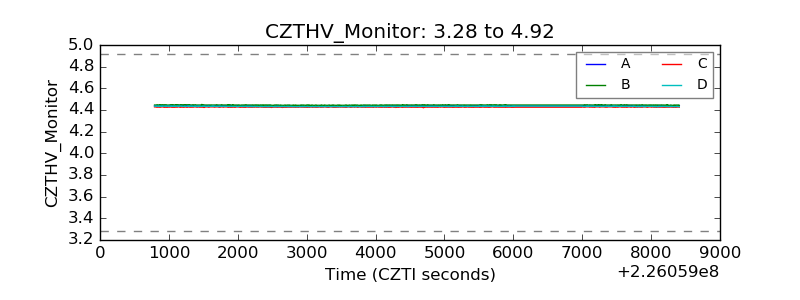 |
| D_VDD | 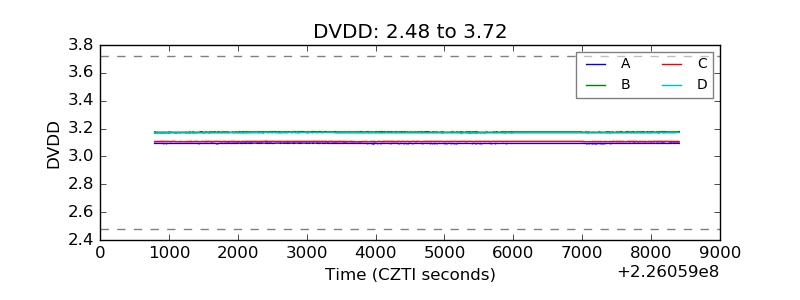 |
| Temperature 1 | 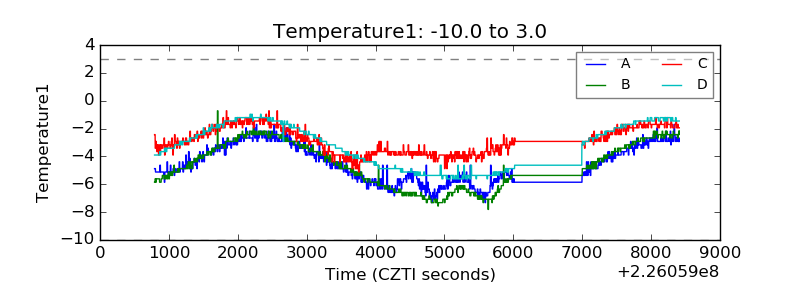 |
| Veto HV Monitor | 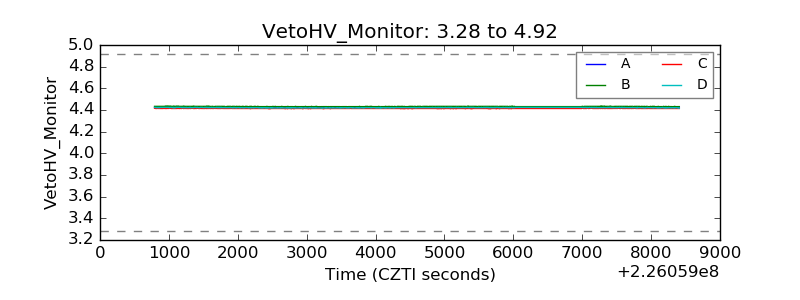 |
| Veto LLD | 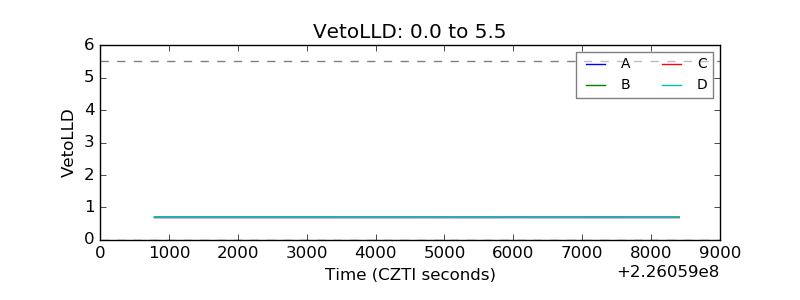 |
| Alpha Counter | 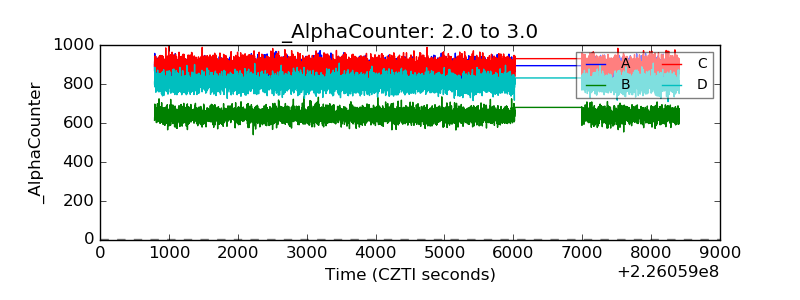 |
| _CPM_Rate | 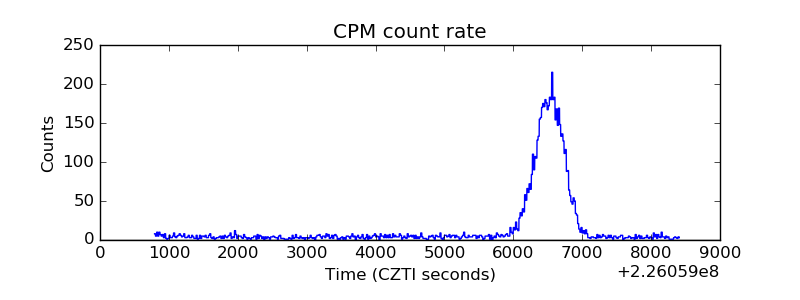 |
| CZT Counter | 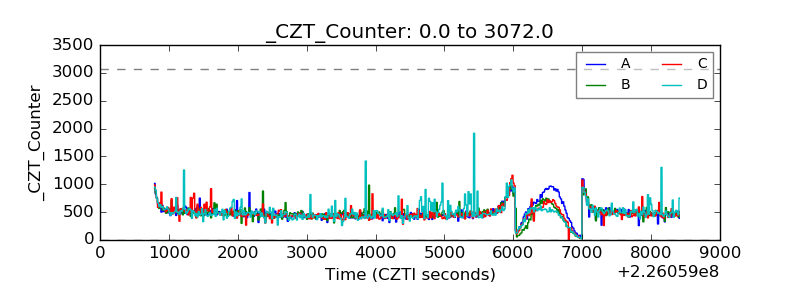 |
| +2.5 Volts monitor |  |
| +5 Volts monitor | 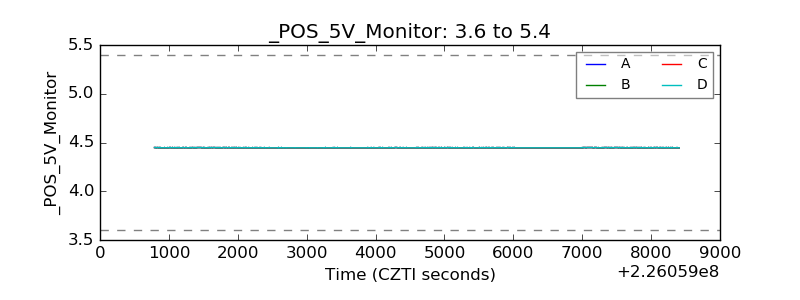 |
| _ROLL_ROT | 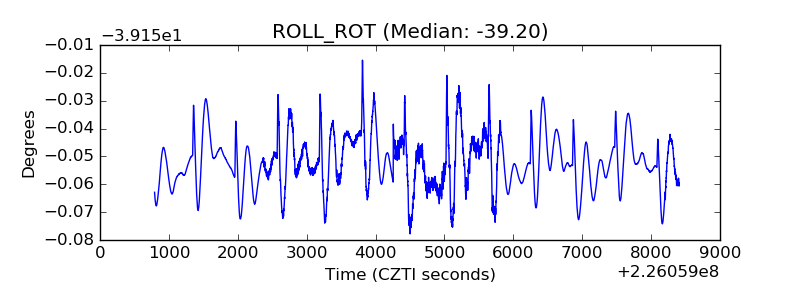 |
| _Roll_DEC | 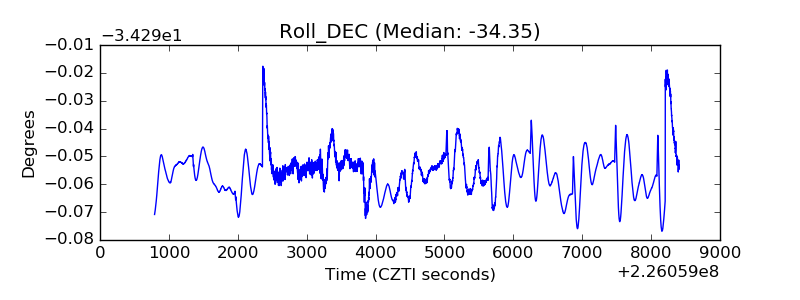 |
| _Roll_RA | 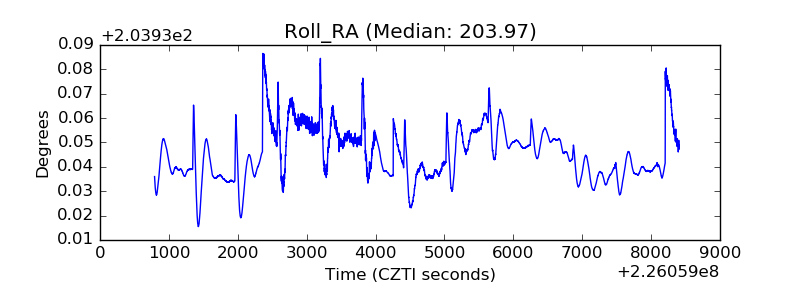 |
| Veto Counter | 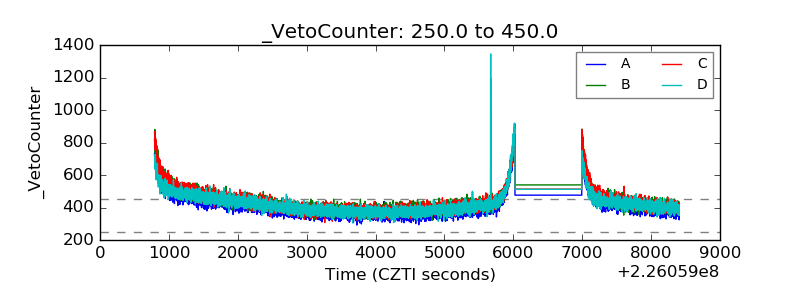 |