| Param | Original file | Final file |
|---|---|---|
| Filename | modeM0/AS1A02_155T01_9000001062_07703cztM0_level2.evt | modeM0/AS1A02_155T01_9000001062_07703cztM0_level2_quad_clean.evt |
| Size (bytes) | 527,333,760 | 76,250,880 |
| Size | 502.9 MB | 72.7 MB |
| Events in quadrant A | 3,585,556 | 454,445 |
| Events in quadrant B | 3,813,324 | 456,218 |
| Events in quadrant C | 4,268,226 | 444,343 |
| Events in quadrant D | 3,803,846 | 441,859 |
| Mode M9 | |||
|---|---|---|---|
| Quadrant | BADHDUFLAG | Total packets | Discarded packets |
| A | 0 | 10 | 0 |
| B | 0 | 10 | 0 |
| C | 0 | 10 | 0 |
| D | 0 | 11 | 0 |
| Mode SS | |||
|---|---|---|---|
| Quadrant | BADHDUFLAG | Total packets | Discarded packets |
| A | 0 | 150 | 0 |
| B | 0 | 150 | 0 |
| C | 0 | 150 | 0 |
| D | 0 | 150 | 0 |
| Mode M0 | |||
|---|---|---|---|
| Quadrant | BADHDUFLAG | Total packets | Discarded packets |
| A | 0 | 15638 | 3 |
| B | 0 | 16170 | 2 |
| C | 0 | 17698 | 2 |
| D | 0 | 16288 | 2 |
| Quadrant | Total seconds | Saturated seconds | Saturation percentage |
|---|---|---|---|
| A | 7350 | 155 | 2.108844% |
| B | 7350 | 247 | 3.360544% |
| C | 7350 | 260 | 3.537415% |
| D | 7350 | 159 | 2.163265% |
Noise dominated data is calculated using 1-second bins in cleaned event files. If a bin has >2000 counts, and if more than 50% of those come from <1% of pixels, then it is considered to be noise-dominated and hence unusable.
| Quadrant | # 1 sec bins | Bins with >0 counts | Bins with >2000 counts | High rate bins dominated by noise | Noise dominated (total time) | Noise dominated (detector-on time) | Marked lightcurve |
|---|---|---|---|---|---|---|---|
| A | 7965 | 7350 | 1 | 1 | 0.01% | 0.01% | 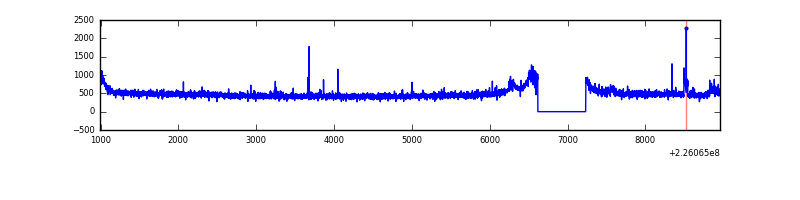 |
| B | 7965 | 7350 | 73 | 73 | 0.92% | 0.99% | 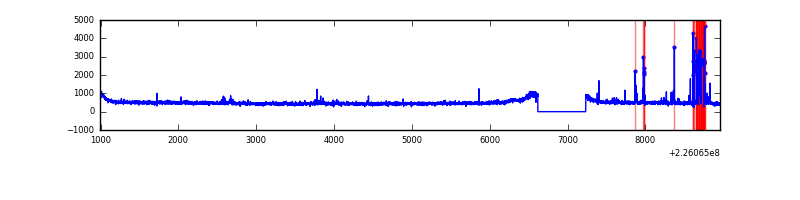 |
| C | 7965 | 7350 | 119 | 119 | 1.49% | 1.62% | 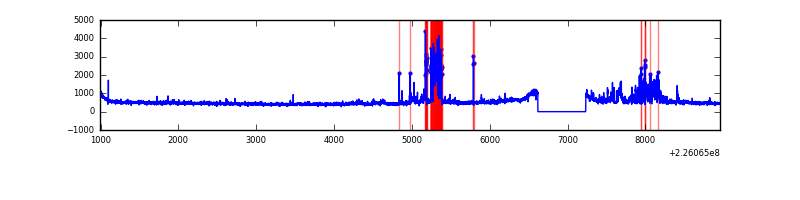 |
| D | 7965 | 7350 | 30 | 30 | 0.38% | 0.41% | 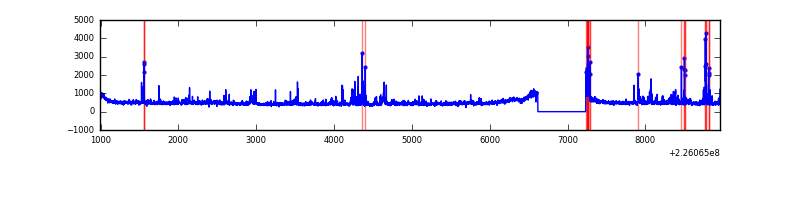 |
Top three noisy pixels from each quadrant. If the there are fewer than three noisy pixels in the level2.evt file, extra rows are filled as -1
| Pixel properties | Quadrant properties | ||||||
|---|---|---|---|---|---|---|---|
| Quadrant | DetID | PixID | Counts | Sigma | Mean | Median | Sigma |
| A | 0 | 23 | 67482 | 360.26 | 907 | 889 | 184.8 |
| A | 0 | 226 | 13069 | 65.89 | 907 | 889 | 184.8 |
| A | 13 | 164 | 8366 | 40.45 | 907 | 889 | 184.8 |
| B | 4 | 239 | 272205 | 1552.23 | 903 | 883 | 174.8 |
| B | 12 | 111 | 18168 | 98.89 | 903 | 883 | 174.8 |
| B | 11 | 111 | 14447 | 77.6 | 903 | 883 | 174.8 |
| C | 9 | 68 | 812214 | 3973.79 | 877 | 882 | 204.2 |
| C | 10 | 22 | 26442 | 125.19 | 877 | 882 | 204.2 |
| C | 13 | 61 | 6782 | 28.9 | 877 | 882 | 204.2 |
| D | 2 | 152 | 252840 | 1157.16 | 886 | 859 | 217.8 |
| D | 12 | 233 | 62477 | 282.96 | 886 | 859 | 217.8 |
| D | 13 | 105 | 62357 | 282.41 | 886 | 859 | 217.8 |
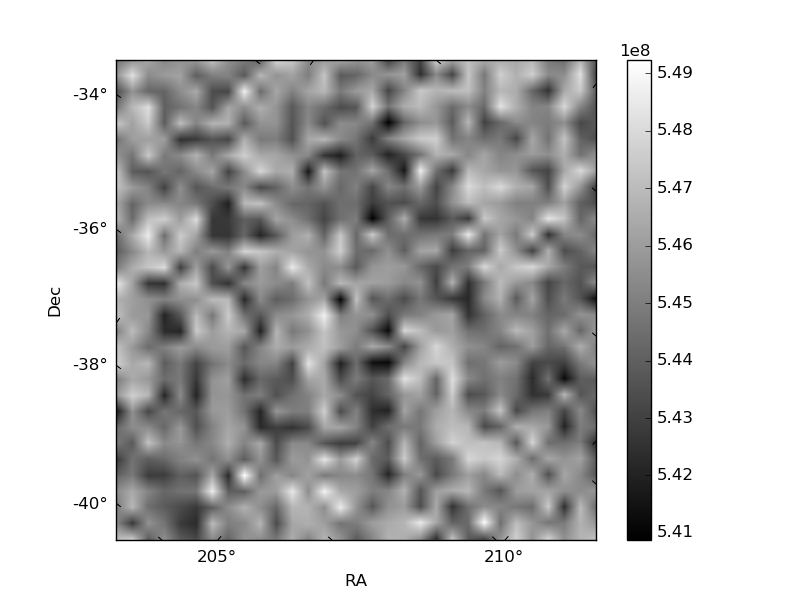
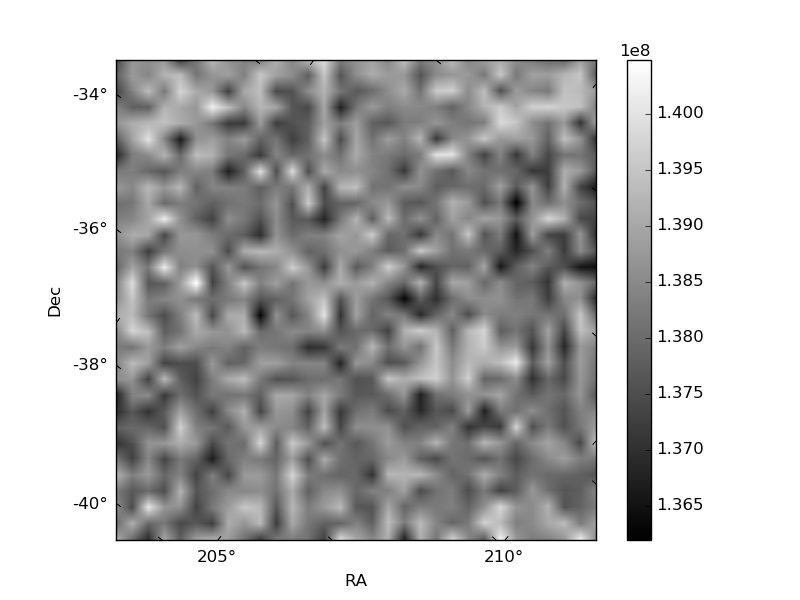
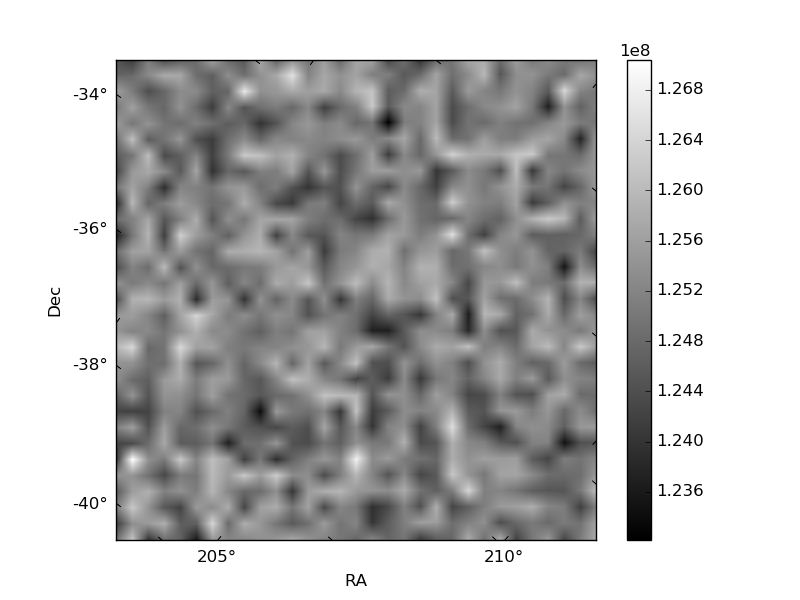
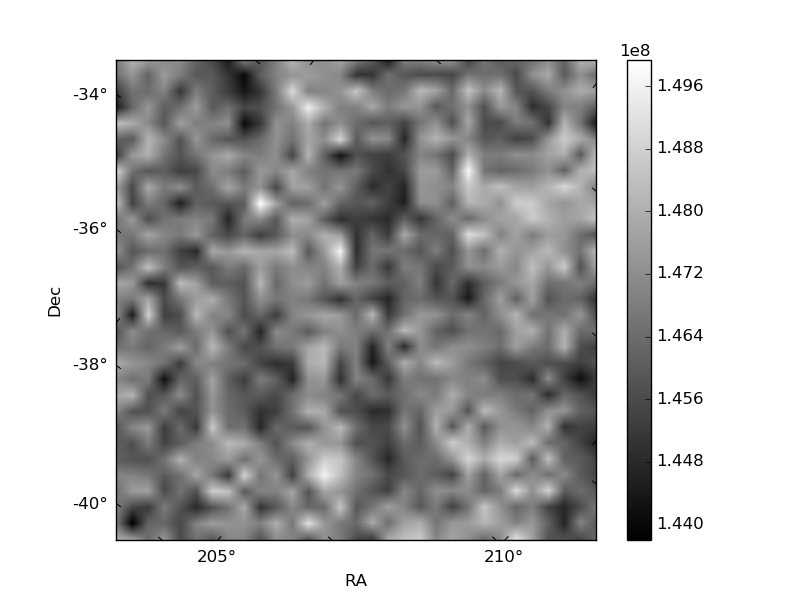
Histogram calculated using DETX and DETY for each event in the final _common_clean file
| Quadrant A | 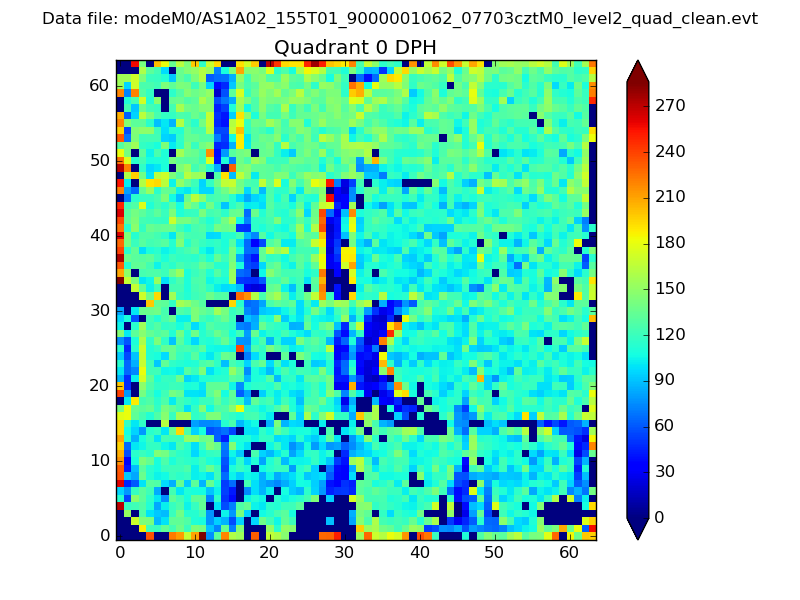 |
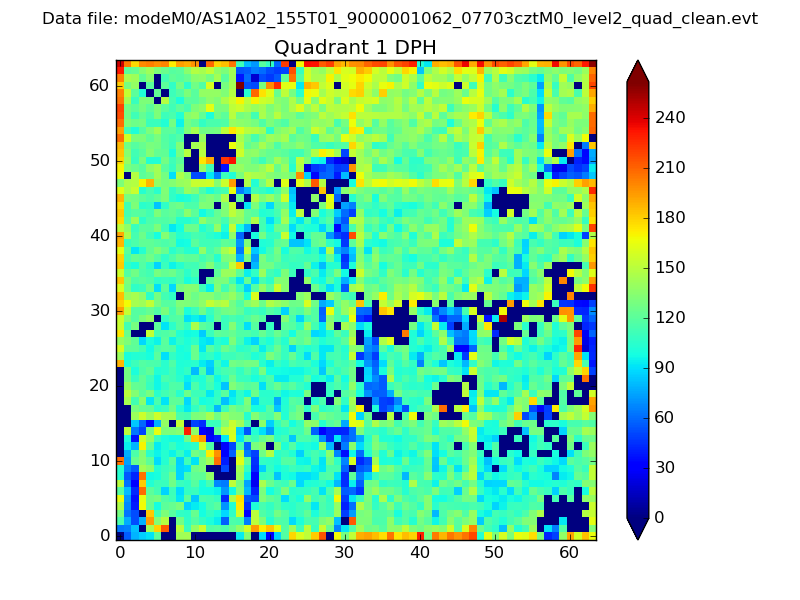 |
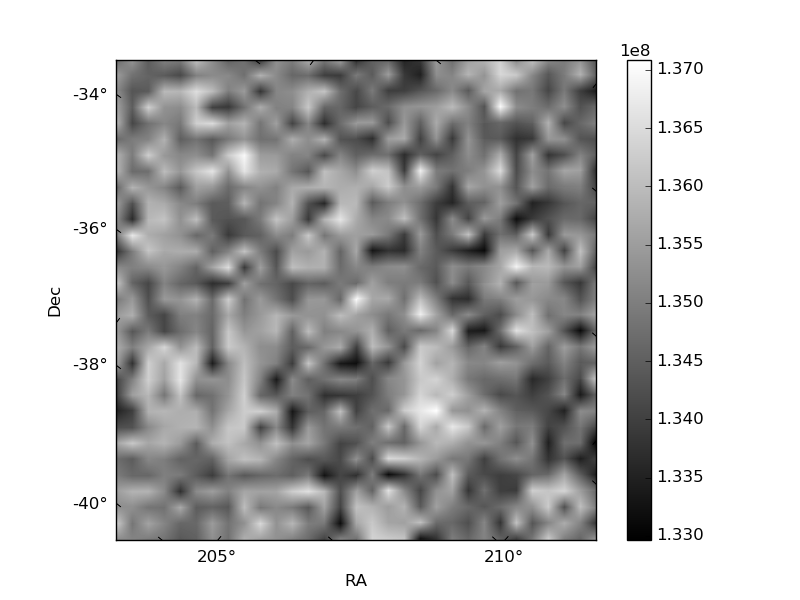
Quadrant B |
|---|---|---|---|
| Quadrant D | 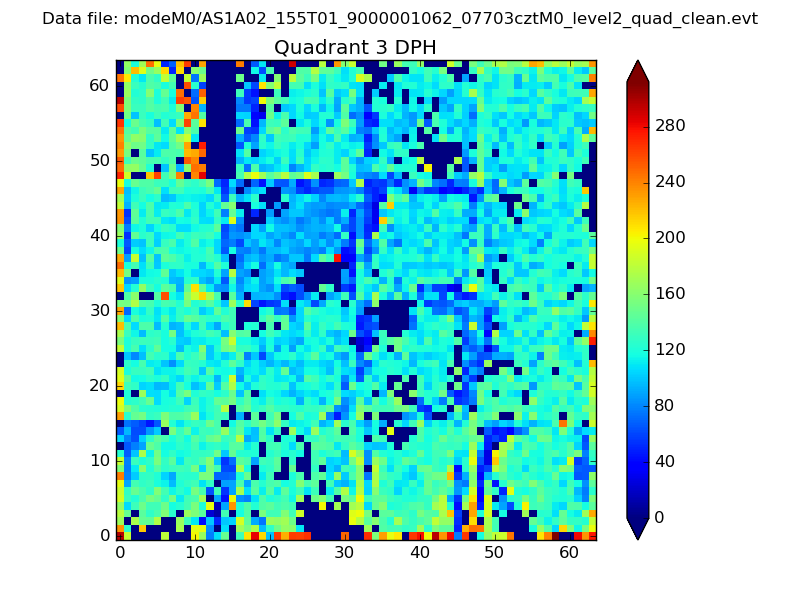 |
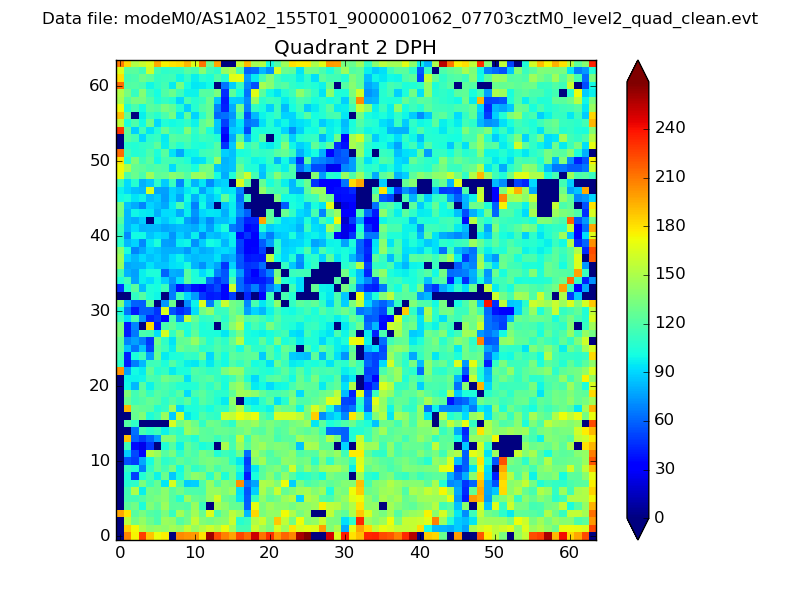 |
Quadrant C |
| Plot type | Count rate plots | Images |
|---|---|---|
| Comparison with Poisson distribution Blue bars denote a histogram of data divided into 1 sec bins. Red curve is a Poisson curve with rate = median count rate of data. |
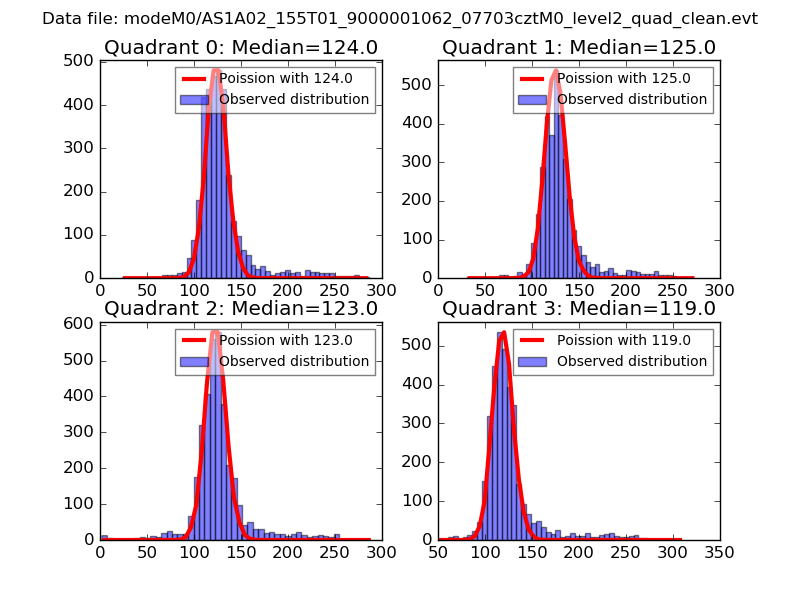 |
 |
| Quadrant-wise count rates Data is divided into 100 sec bins |
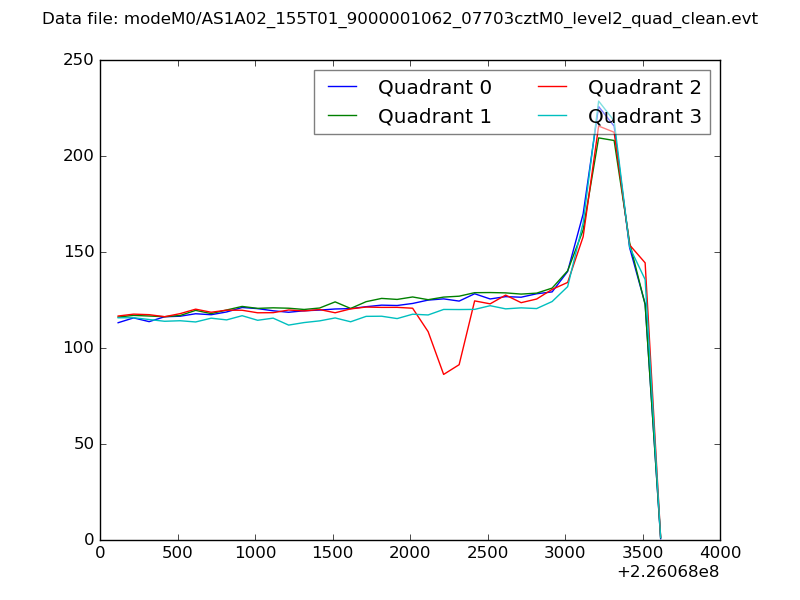 |
|
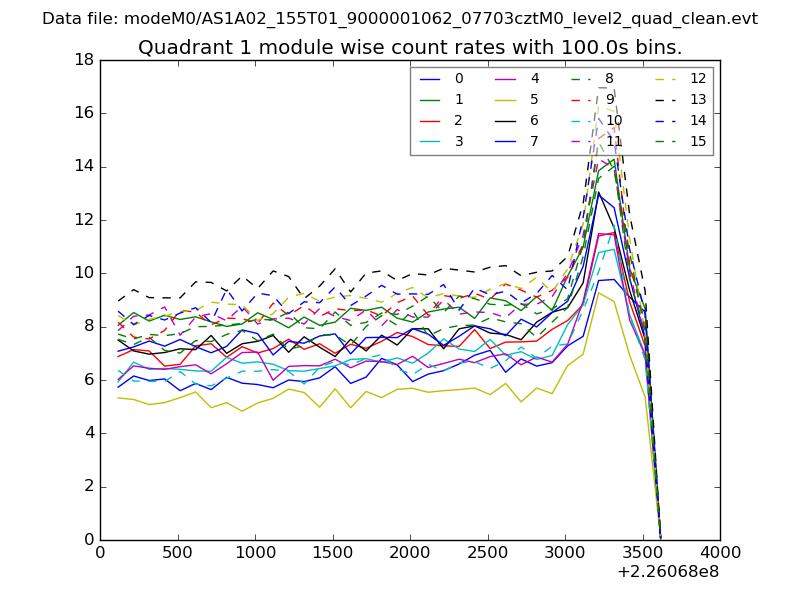
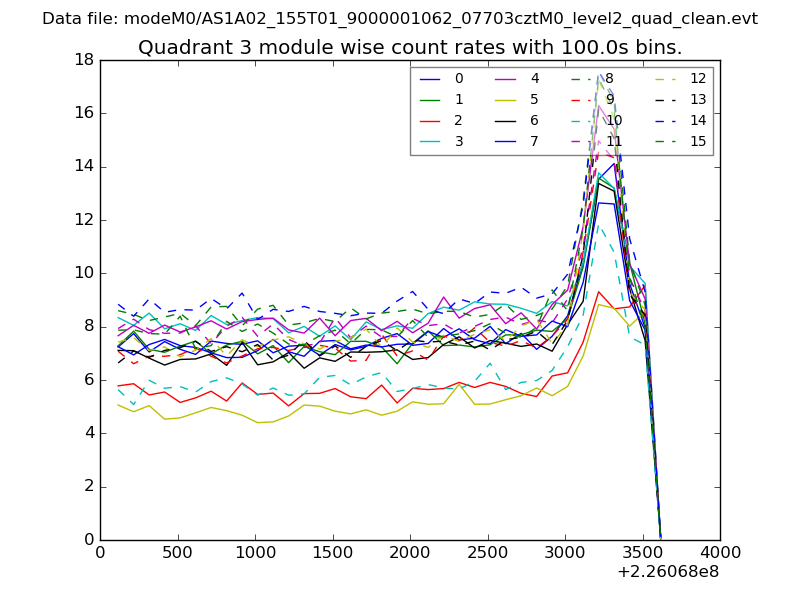
| Module-wise count rates for Quadrant A Data is divided into 100 sec bins |
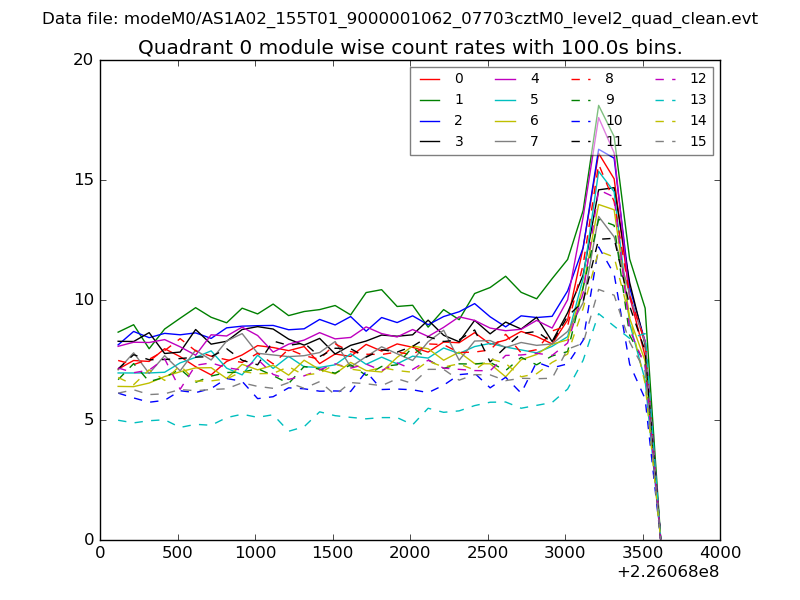 |
 |
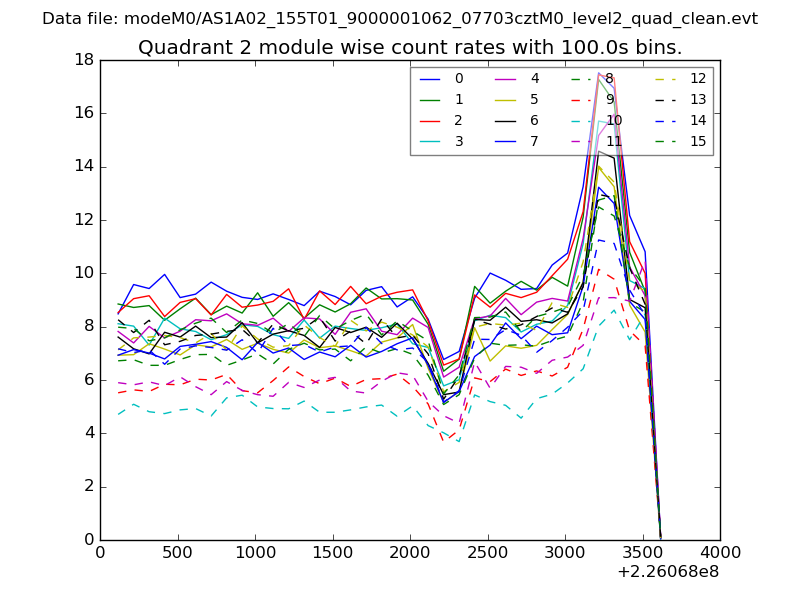
| Module-wise count rates for Quadrant B Data is divided into 100 sec bins |
 |
 |
| Module-wise count rates for Quadrant C Data is divided into 100 sec bins |
 |
 |
| Module-wise count rates for Quadrant D Data is divided into 100 sec bins |
 |
 |
| Parameter | Plot |
|---|---|
| CZT HV Monitor | 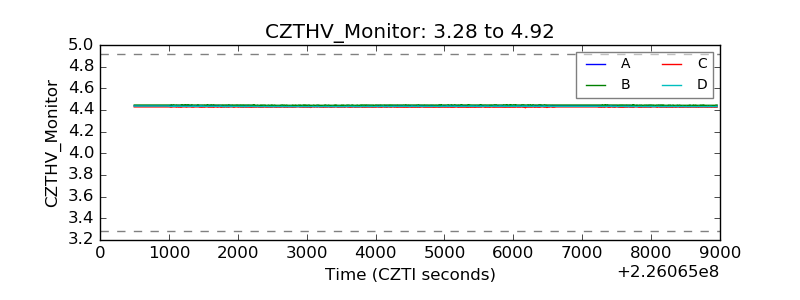 |
| D_VDD | 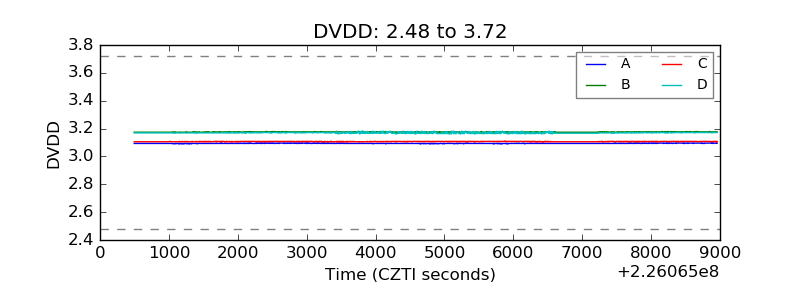 |
| Temperature 1 |  |
| Veto HV Monitor | 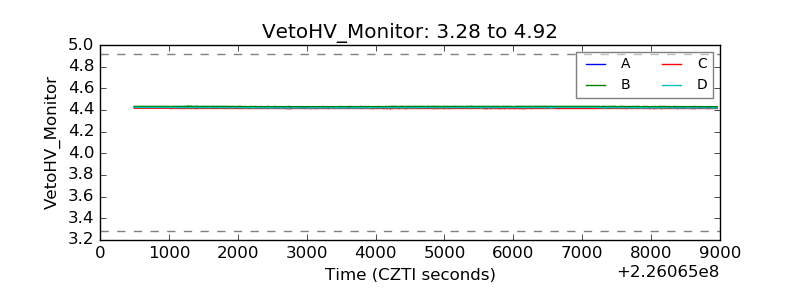 |
| Veto LLD | 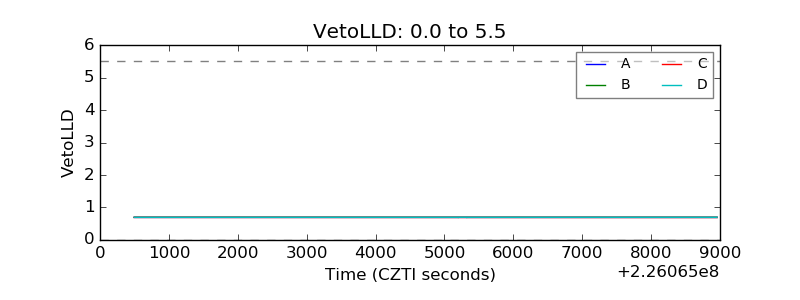 |
| Alpha Counter | 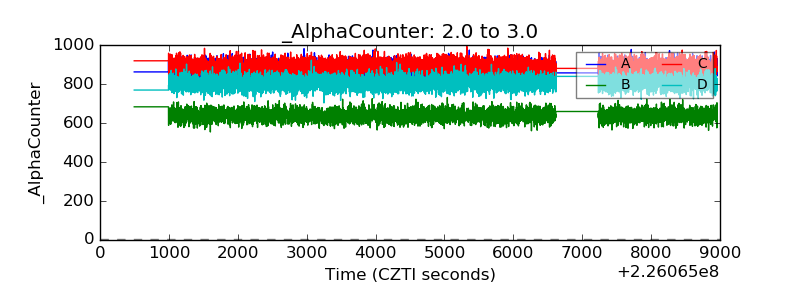 |
| _CPM_Rate | 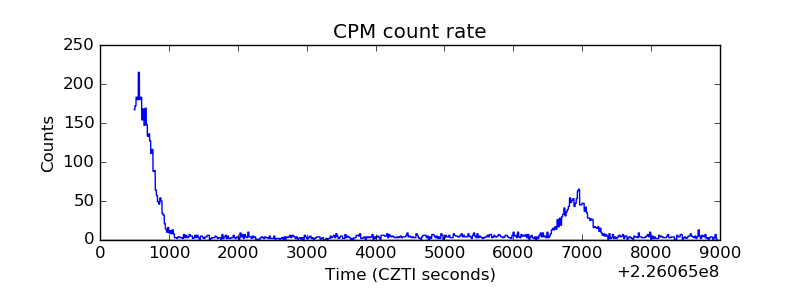 |
| CZT Counter | 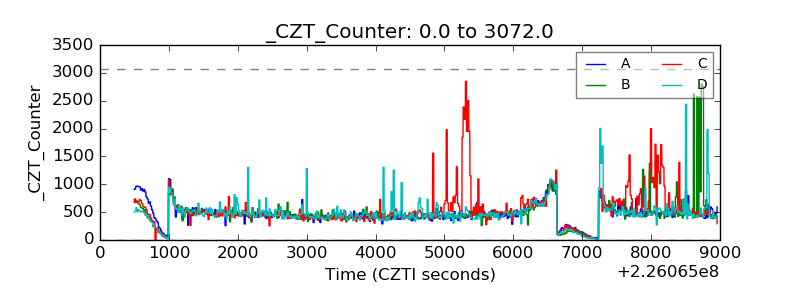 |
| +2.5 Volts monitor |  |
| +5 Volts monitor | 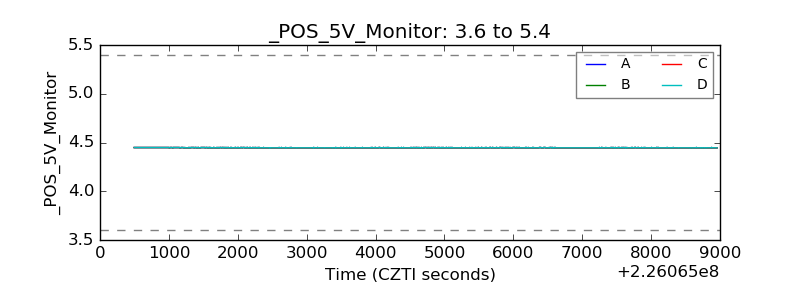 |
| _ROLL_ROT | 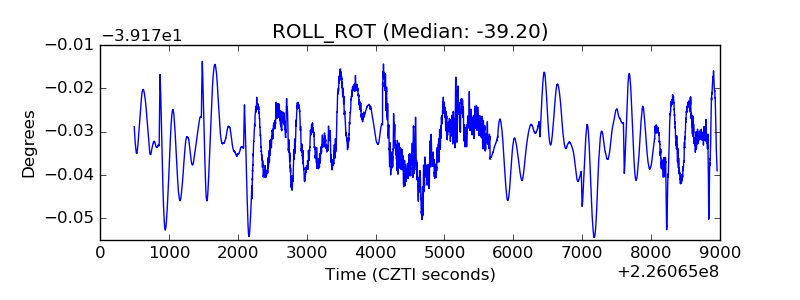 |
| _Roll_DEC | 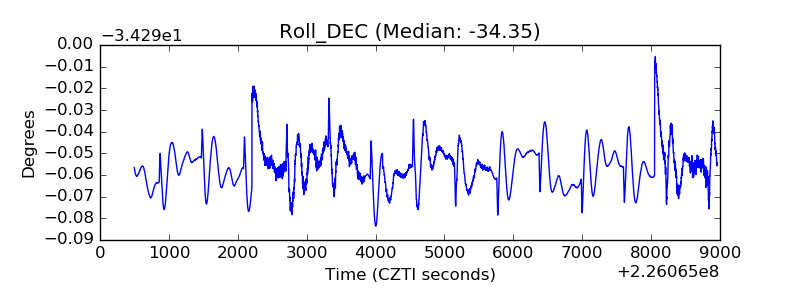 |
| _Roll_RA | 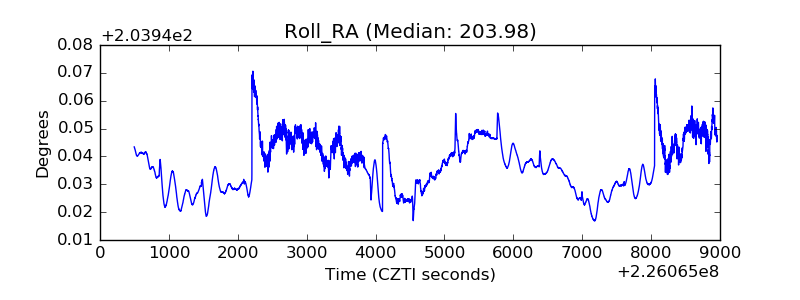 |
| Veto Counter | 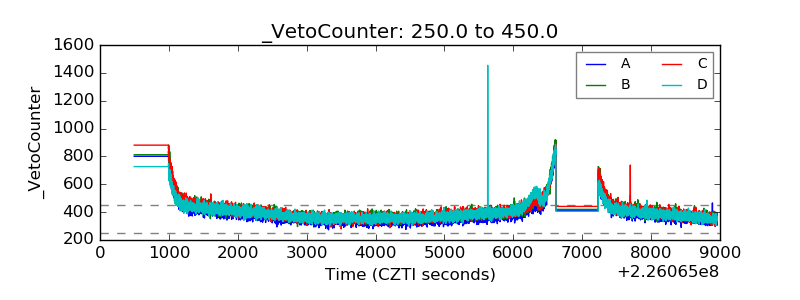 |