| Param | Original file | Final file |
|---|---|---|
| Filename | modeM0/AS1A02_155T01_9000001062_07709cztM0_level2.evt | modeM0/AS1A02_155T01_9000001062_07709cztM0_level2_quad_clean.evt |
| Size (bytes) | 201,309,120 | 23,592,960 |
| Size | 192.0 MB | 22.5 MB |
| Events in quadrant A | 1,299,705 | 131,322 |
| Events in quadrant B | 1,423,792 | 132,939 |
| Events in quadrant C | 1,898,045 | 130,426 |
| Events in quadrant D | 1,292,608 | 128,767 |
| Mode SS | |||
|---|---|---|---|
| Quadrant | BADHDUFLAG | Total packets | Discarded packets |
| A | 0 | 54 | 0 |
| B | 0 | 54 | 0 |
| C | 0 | 54 | 0 |
| D | 0 | 54 | 0 |
| Mode M0 | |||
|---|---|---|---|
| Quadrant | BADHDUFLAG | Total packets | Discarded packets |
| A | 0 | 5590 | 1 |
| B | 0 | 6045 | 0 |
| C | 0 | 7424 | 0 |
| D | 0 | 5730 | 0 |
| Quadrant | Total seconds | Saturated seconds | Saturation percentage |
|---|---|---|---|
| A | 2652 | 3 | 0.113122% |
| B | 2652 | 88 | 3.318250% |
| C | 2652 | 22 | 0.829563% |
| D | 2652 | 22 | 0.829563% |
Noise dominated data is calculated using 1-second bins in cleaned event files. If a bin has >2000 counts, and if more than 50% of those come from <1% of pixels, then it is considered to be noise-dominated and hence unusable.
| Quadrant | # 1 sec bins | Bins with >0 counts | Bins with >2000 counts | High rate bins dominated by noise | Noise dominated (total time) | Noise dominated (detector-on time) | Marked lightcurve |
|---|---|---|---|---|---|---|---|
| A | 2652 | 2652 | 1 | 1 | 0.04% | 0.04% |  |
| B | 2652 | 2652 | 74 | 74 | 2.79% | 2.79% |  |
| C | 2652 | 2652 | 8 | 8 | 0.30% | 0.30% |  |
| D | 2652 | 2652 | 20 | 20 | 0.75% | 0.75% |  |
Top three noisy pixels from each quadrant. If the there are fewer than three noisy pixels in the level2.evt file, extra rows are filled as -1
| Pixel properties | Quadrant properties | ||||||
|---|---|---|---|---|---|---|---|
| Quadrant | DetID | PixID | Counts | Sigma | Mean | Median | Sigma |
| A | 0 | 23 | 127732 | 2000.94 | 301 | 294 | 63.7 |
| A | 0 | 226 | 11344 | 173.5 | 301 | 294 | 63.7 |
| A | 4 | 2 | 2826 | 39.76 | 301 | 294 | 63.7 |
| B | 4 | 239 | 257429 | 4389.31 | 296 | 289 | 58.6 |
| B | 0 | 213 | 10161 | 168.51 | 296 | 289 | 58.6 |
| B | 0 | 214 | 7875 | 129.49 | 296 | 289 | 58.6 |
| C | 9 | 68 | 770231 | 11165.41 | 288 | 289 | 69.0 |
| C | 13 | 61 | 2261 | 28.6 | 288 | 289 | 69.0 |
| C | 8 | 222 | 1578 | 18.69 | 288 | 289 | 69.0 |
| D | 2 | 152 | 82273 | 1125.19 | 291 | 281 | 72.9 |
| D | 13 | 105 | 43313 | 590.54 | 291 | 281 | 72.9 |
| D | 13 | 104 | 39169 | 533.67 | 291 | 281 | 72.9 |
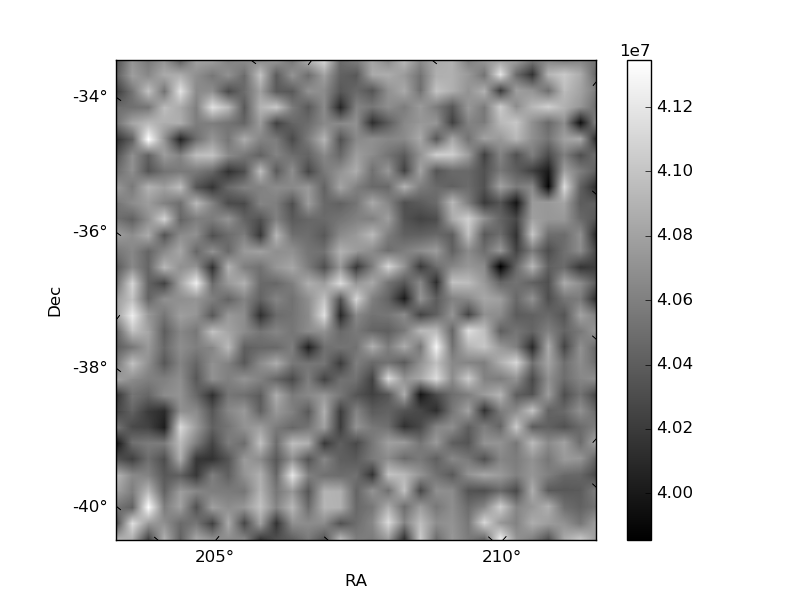
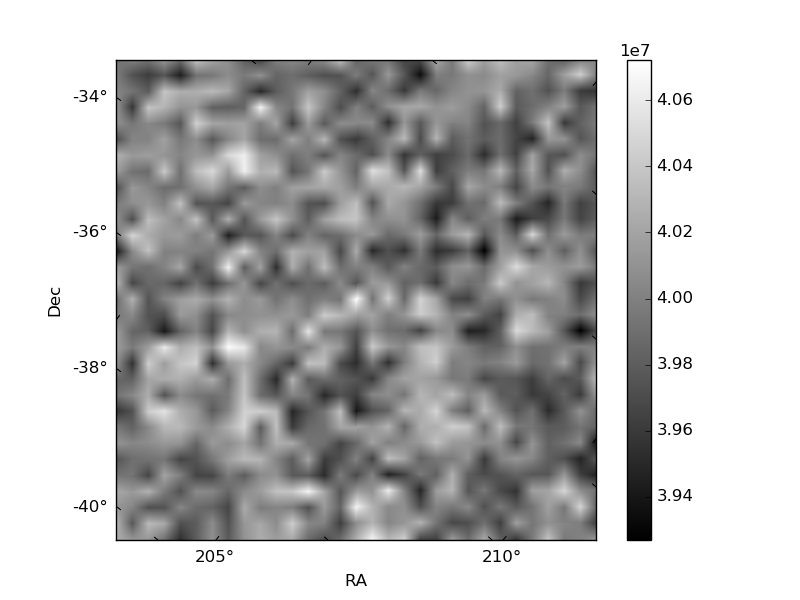
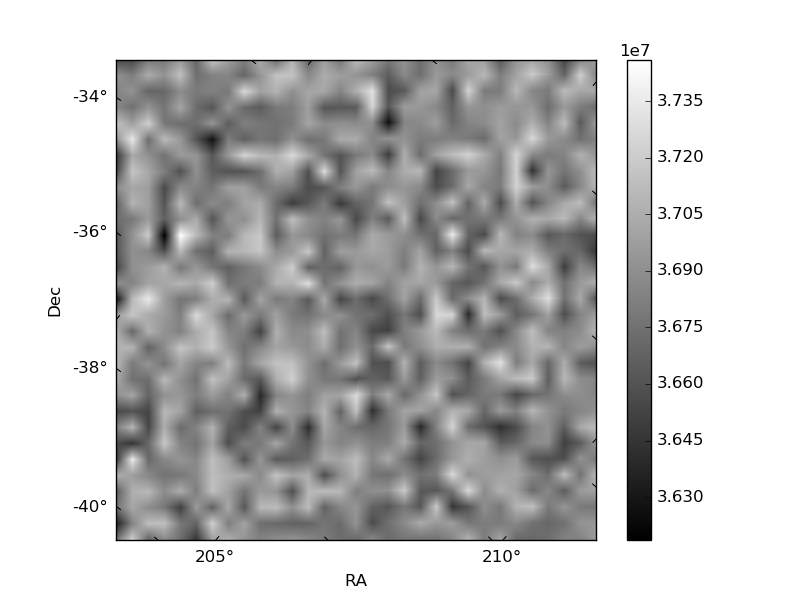
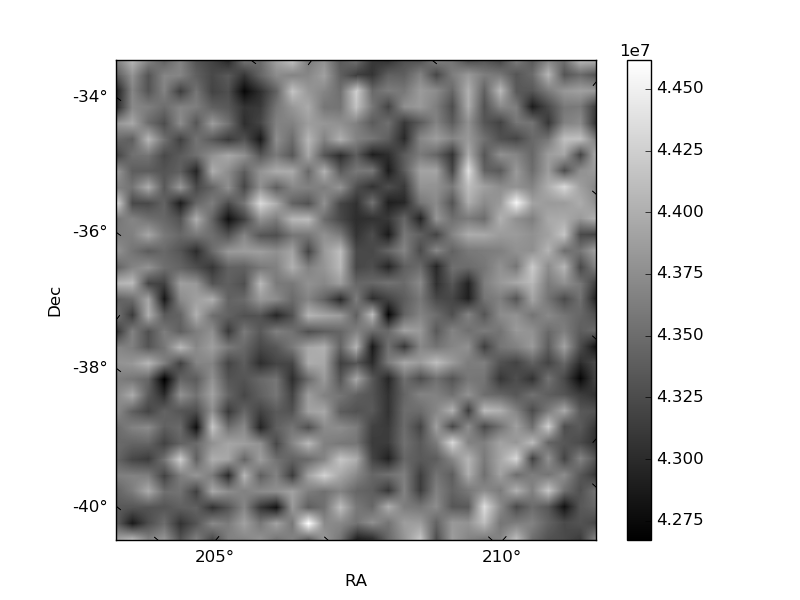
Histogram calculated using DETX and DETY for each event in the final _common_clean file
| Quadrant A |  |
 |
Quadrant B |
|---|---|---|---|
| Quadrant D | 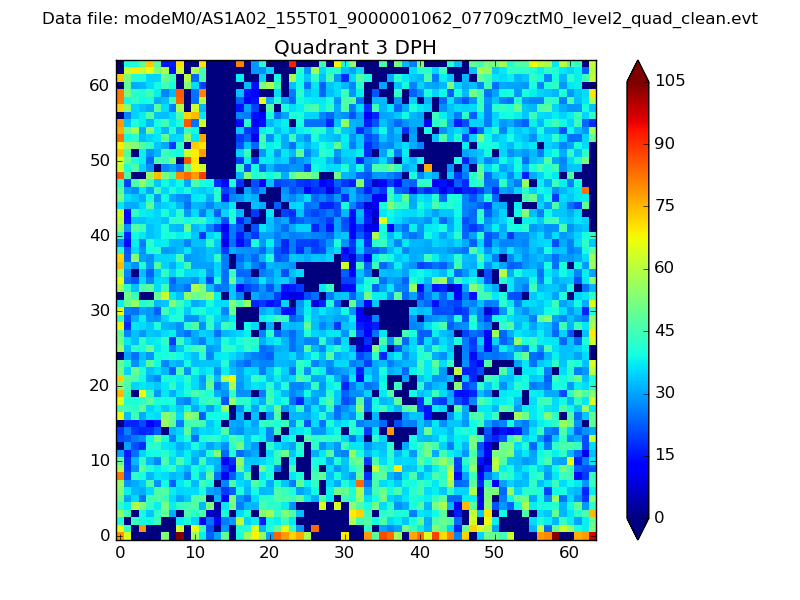 |
 |
Quadrant C |
| Plot type | Count rate plots | Images |
|---|---|---|
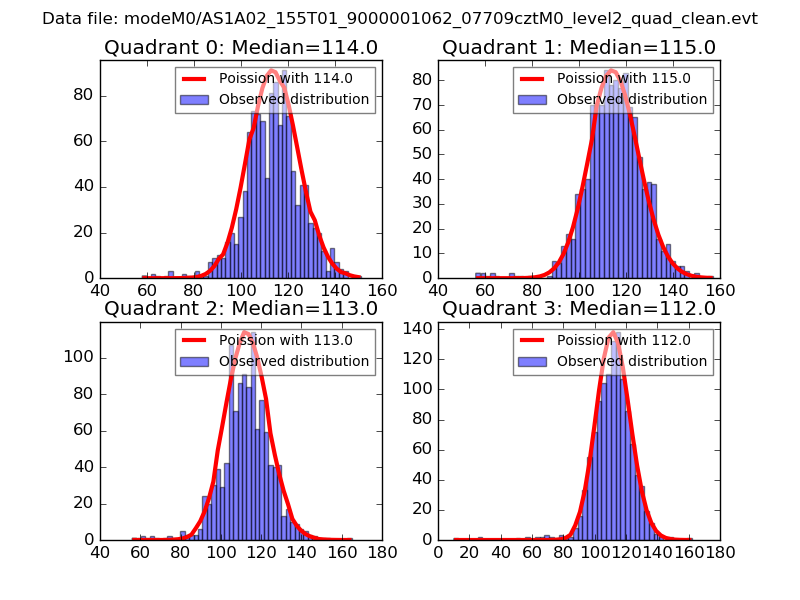
| Comparison with Poisson distribution Blue bars denote a histogram of data divided into 1 sec bins. Red curve is a Poisson curve with rate = median count rate of data. |
 |
 |
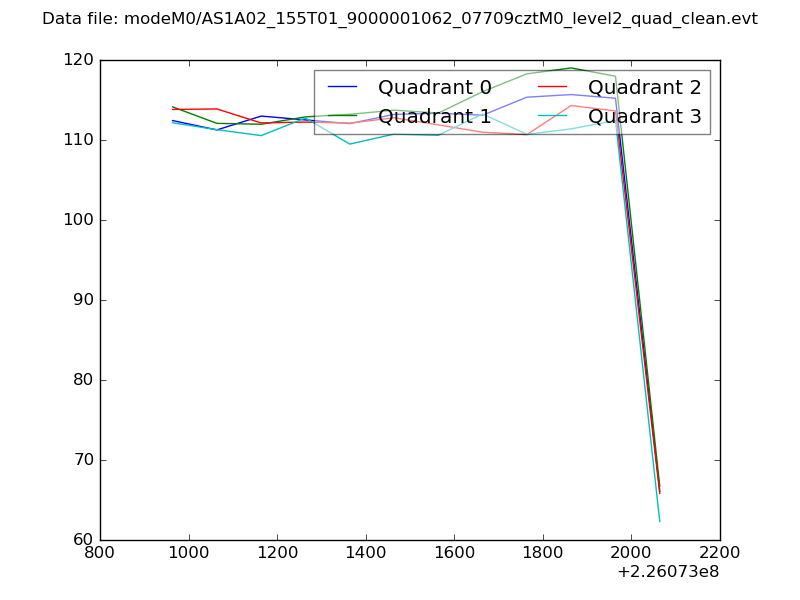
| Quadrant-wise count rates Data is divided into 100 sec bins |
 |
|
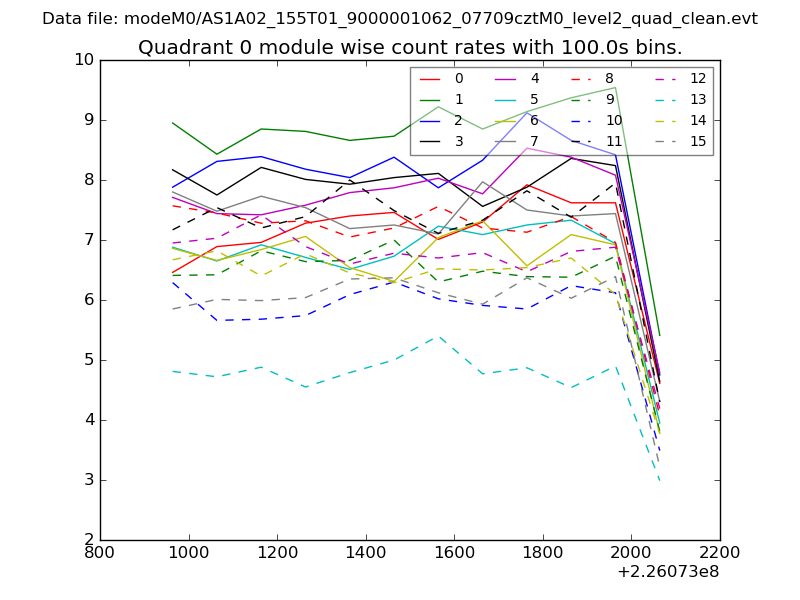
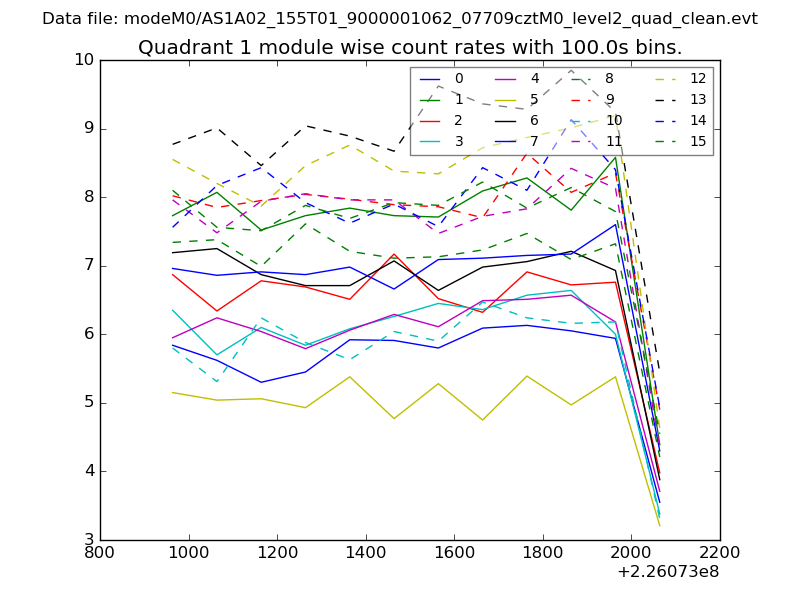
| Module-wise count rates for Quadrant A Data is divided into 100 sec bins |
 |
 |
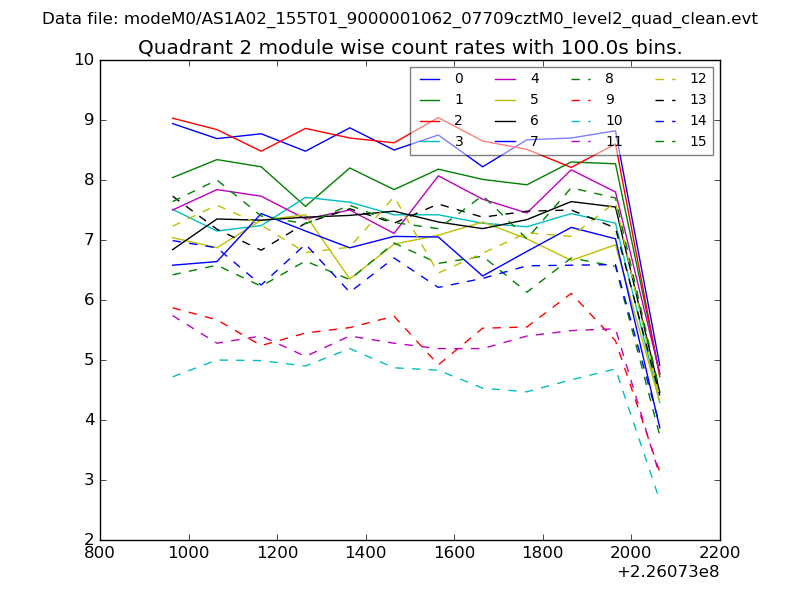
| Module-wise count rates for Quadrant B Data is divided into 100 sec bins |
 |
 |
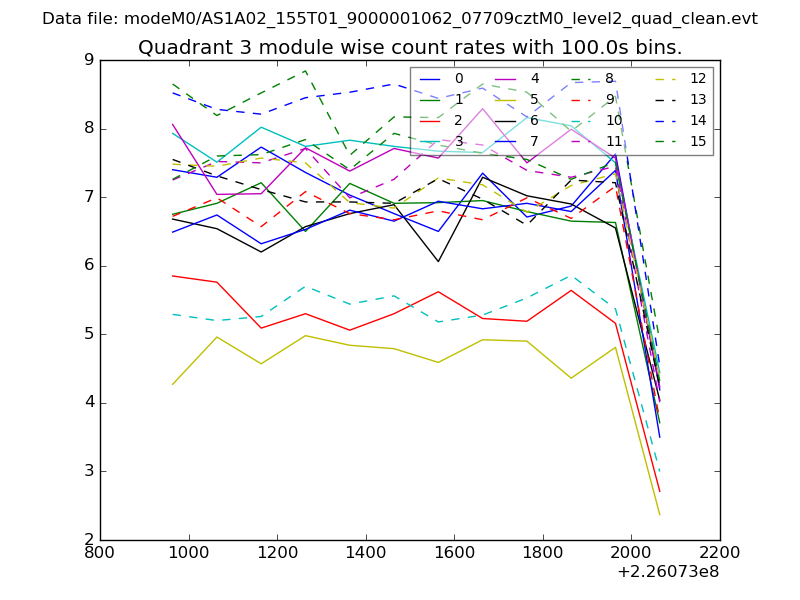
| Module-wise count rates for Quadrant C Data is divided into 100 sec bins |
 |
 |
| Module-wise count rates for Quadrant D Data is divided into 100 sec bins |
 |
 |
| Parameter | Plot |
|---|---|
| CZT HV Monitor | 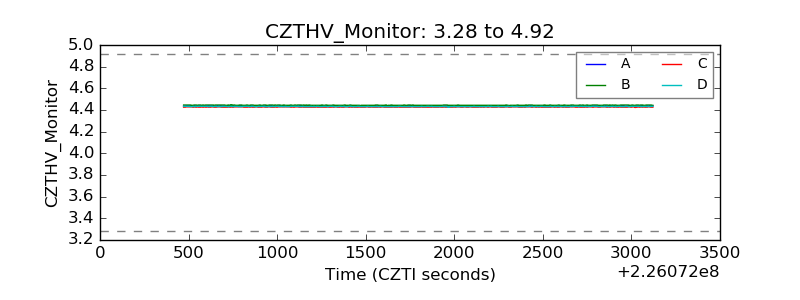 |
| D_VDD | 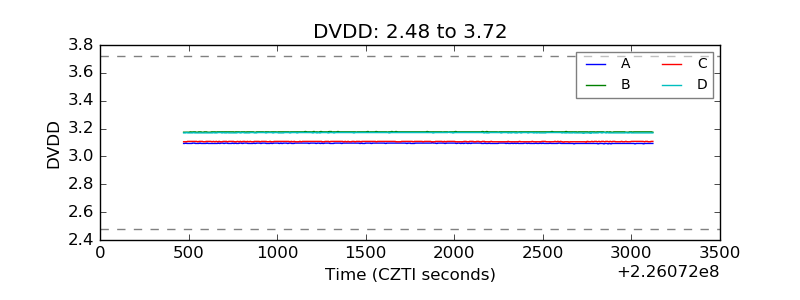 |
| Temperature 1 | 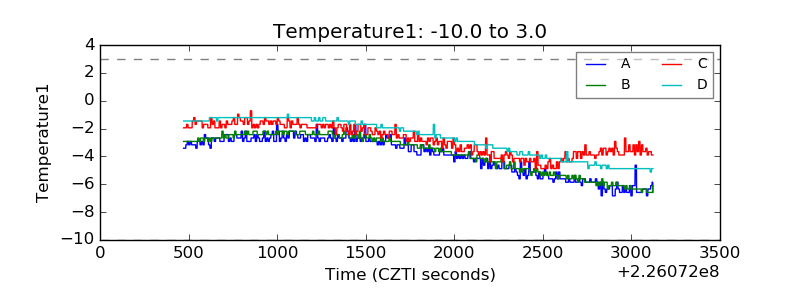 |
| Veto HV Monitor | 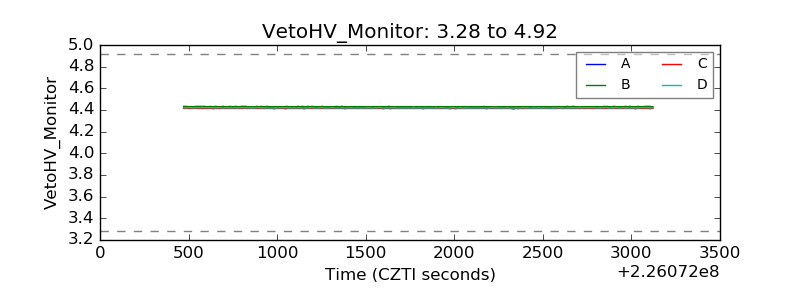 |
| Veto LLD | 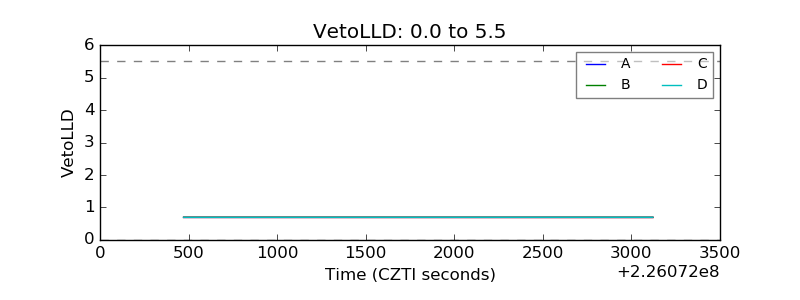 |
| Alpha Counter | 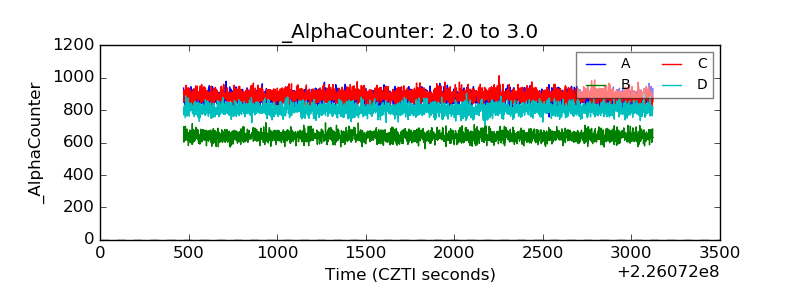 |
| _CPM_Rate | 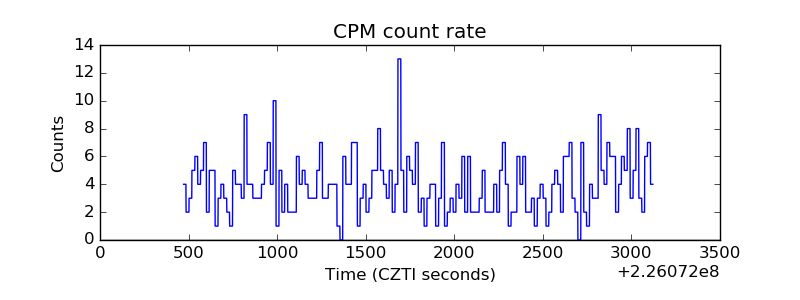 |
| CZT Counter |  |
| +2.5 Volts monitor |  |
| +5 Volts monitor | 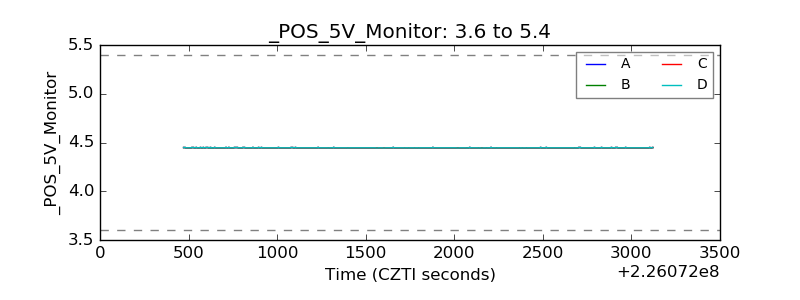 |
| _ROLL_ROT | 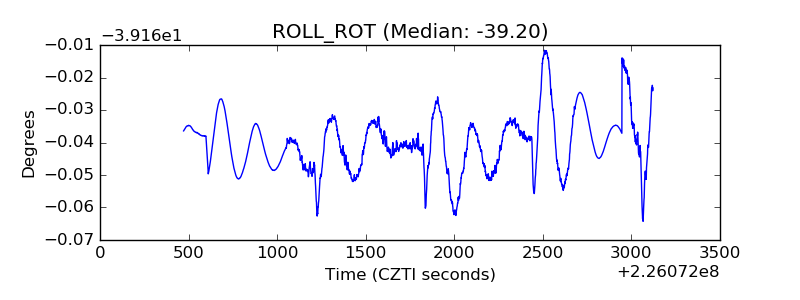 |
| _Roll_DEC | 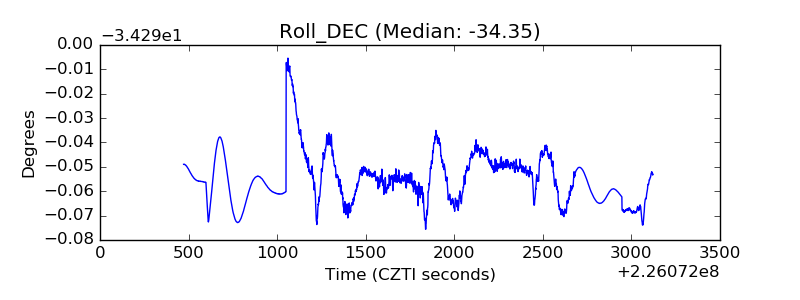 |
| _Roll_RA | 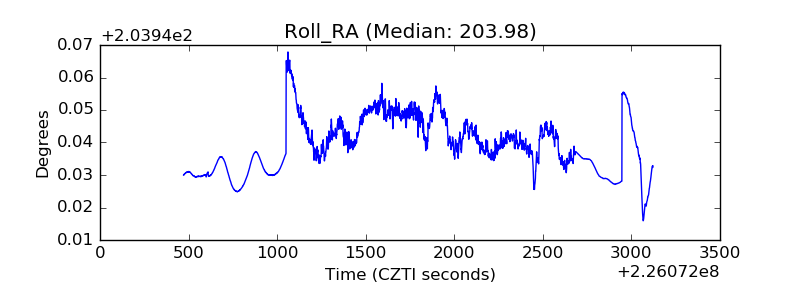 |
| Veto Counter | 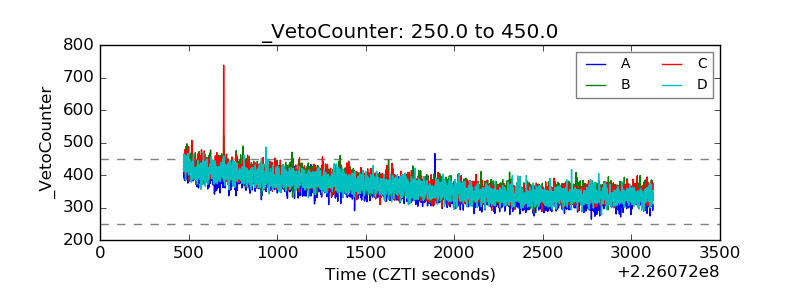 |