| Param | Original file | Final file |
|---|---|---|
| Filename | modeM0/AS1A02_155T01_9000001062_07710cztM0_level2.evt | modeM0/AS1A02_155T01_9000001062_07710cztM0_level2_quad_clean.evt |
| Size (bytes) | 1,732,818,240 | 317,652,480 |
| Size | 1.6 GB | 302.9 MB |
| Events in quadrant A | 11,450,304 | 1,999,067 |
| Events in quadrant B | 11,815,669 | 2,036,810 |
| Events in quadrant C | 14,615,088 | 1,965,997 |
| Events in quadrant D | 12,917,376 | 1,908,605 |
| Mode M9 | |||
|---|---|---|---|
| Quadrant | BADHDUFLAG | Total packets | Discarded packets |
| A | 0 | 13 | 0 |
| B | 0 | 13 | 0 |
| C | 0 | 13 | 0 |
| D | 0 | 13 | 0 |
| Mode SS | |||
|---|---|---|---|
| Quadrant | BADHDUFLAG | Total packets | Discarded packets |
| A | 0 | 506 | 0 |
| B | 0 | 506 | 0 |
| C | 0 | 506 | 0 |
| D | 0 | 506 | 0 |
| Mode M0 | |||
|---|---|---|---|
| Quadrant | BADHDUFLAG | Total packets | Discarded packets |
| A | 0 | 51625 | 4 |
| B | 0 | 52171 | 4 |
| C | 0 | 59455 | 4 |
| D | 0 | 56318 | 4 |
| Quadrant | Total seconds | Saturated seconds | Saturation percentage |
|---|---|---|---|
| A | 24866 | 312 | 1.254725% |
| B | 24866 | 433 | 1.741334% |
| C | 24866 | 519 | 2.087187% |
| D | 24866 | 423 | 1.701118% |
Noise dominated data is calculated using 1-second bins in cleaned event files. If a bin has >2000 counts, and if more than 50% of those come from <1% of pixels, then it is considered to be noise-dominated and hence unusable.
| Quadrant | # 1 sec bins | Bins with >0 counts | Bins with >2000 counts | High rate bins dominated by noise | Noise dominated (total time) | Noise dominated (detector-on time) | Marked lightcurve |
|---|---|---|---|---|---|---|---|
| A | 26181 | 24870 | 0 | 0 | 0.00% | 0.00% | 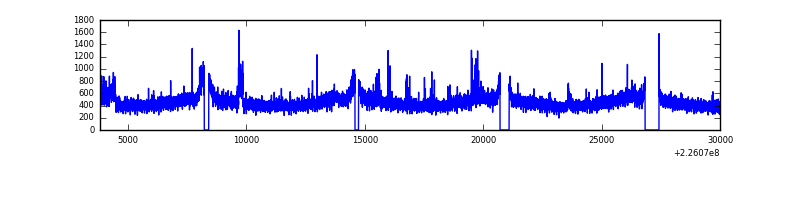 |
| B | 26181 | 24868 | 42 | 42 | 0.16% | 0.17% | 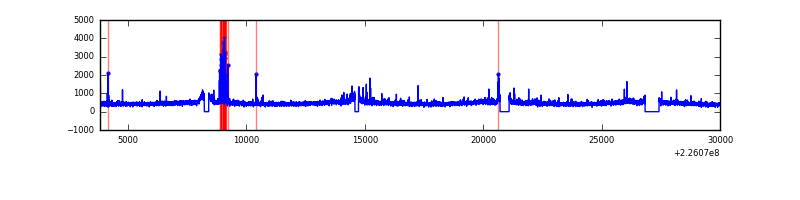 |
| C | 26181 | 24869 | 205 | 205 | 0.78% | 0.82% |  |
| D | 26181 | 24870 | 184 | 184 | 0.70% | 0.74% | 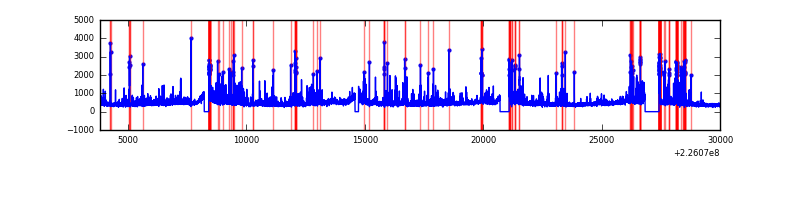 |
Top three noisy pixels from each quadrant. If the there are fewer than three noisy pixels in the level2.evt file, extra rows are filled as -1
| Pixel properties | Quadrant properties | ||||||
|---|---|---|---|---|---|---|---|
| Quadrant | DetID | PixID | Counts | Sigma | Mean | Median | Sigma |
| A | 0 | 23 | 198469 | 330.2 | 2903 | 2835 | 592.5 |
| A | 3 | 1 | 46780 | 74.17 | 2903 | 2835 | 592.5 |
| A | 0 | 226 | 40226 | 63.11 | 2903 | 2835 | 592.5 |
| B | 4 | 239 | 282641 | 501.52 | 2929 | 2861 | 557.9 |
| B | 0 | 219 | 72182 | 124.26 | 2929 | 2861 | 557.9 |
| B | 12 | 111 | 58910 | 100.47 | 2929 | 2861 | 557.9 |
| C | 9 | 68 | 3168539 | 4849.83 | 2822 | 2834 | 652.7 |
| C | 8 | 229 | 364233 | 553.66 | 2822 | 2834 | 652.7 |
| C | 10 | 22 | 36387 | 51.4 | 2822 | 2834 | 652.7 |
| D | 2 | 152 | 1488434 | 2168.55 | 2809 | 2719 | 685.1 |
| D | 12 | 221 | 328034 | 474.83 | 2809 | 2719 | 685.1 |
| D | 13 | 104 | 200995 | 289.4 | 2809 | 2719 | 685.1 |
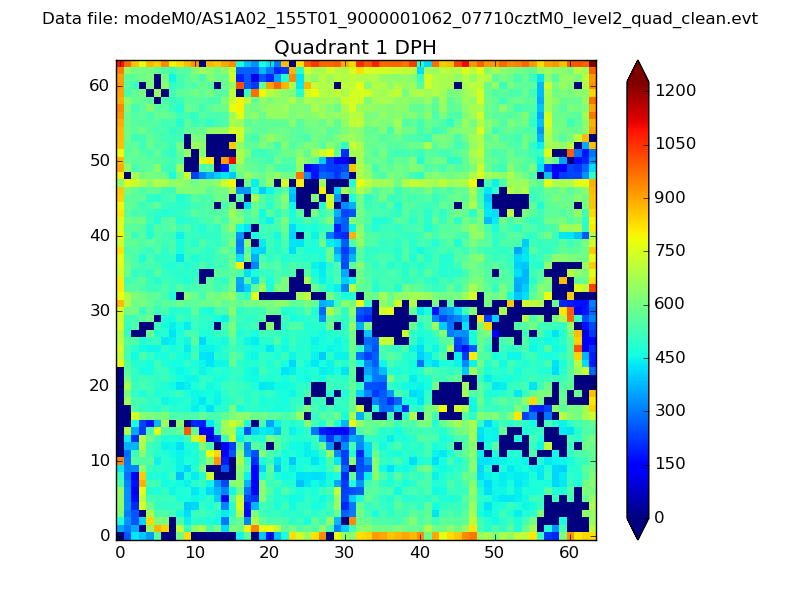
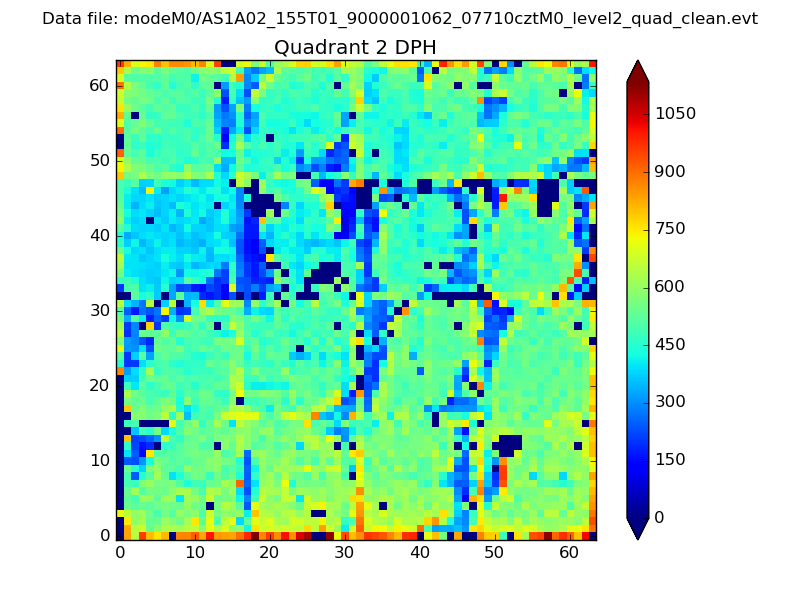
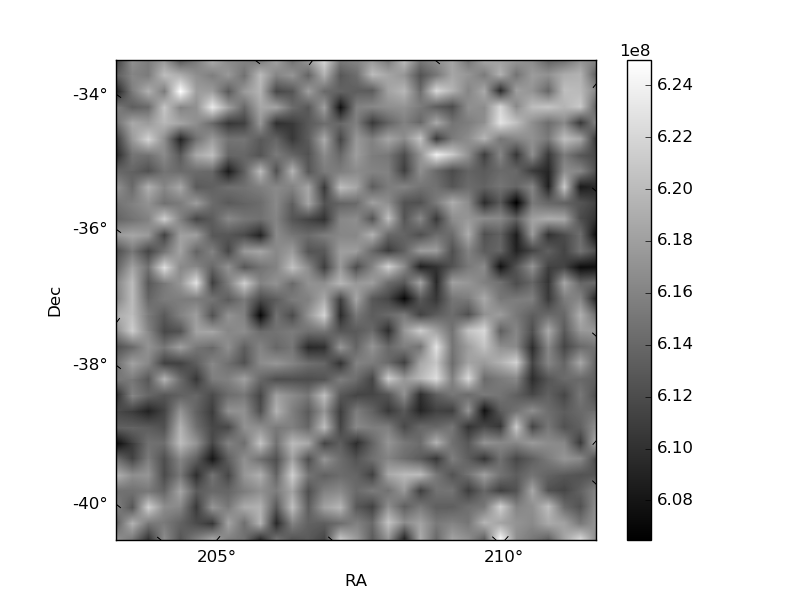
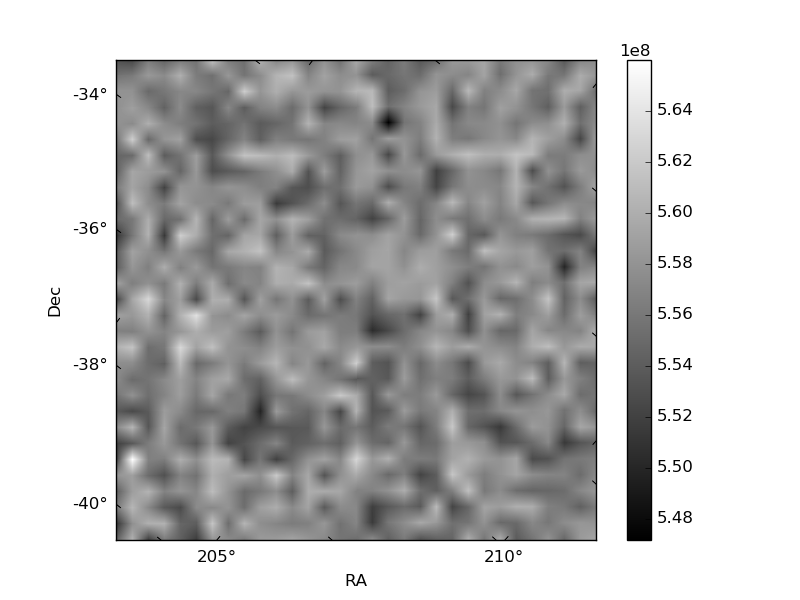
Histogram calculated using DETX and DETY for each event in the final _common_clean file
| Quadrant A | 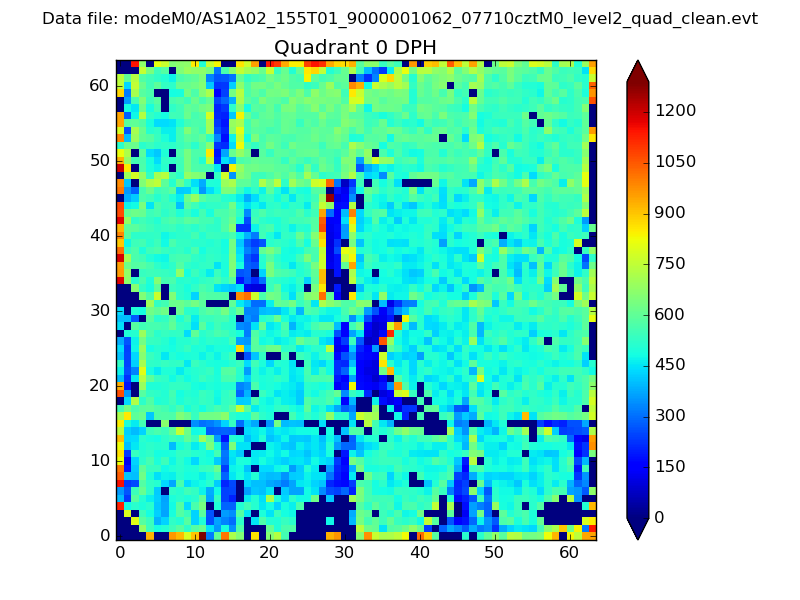 |
 |
Quadrant B |
|---|---|---|---|
| Quadrant D |  |
 |
Quadrant C |
| Plot type | Count rate plots | Images |
|---|---|---|
| Comparison with Poisson distribution Blue bars denote a histogram of data divided into 1 sec bins. Red curve is a Poisson curve with rate = median count rate of data. |
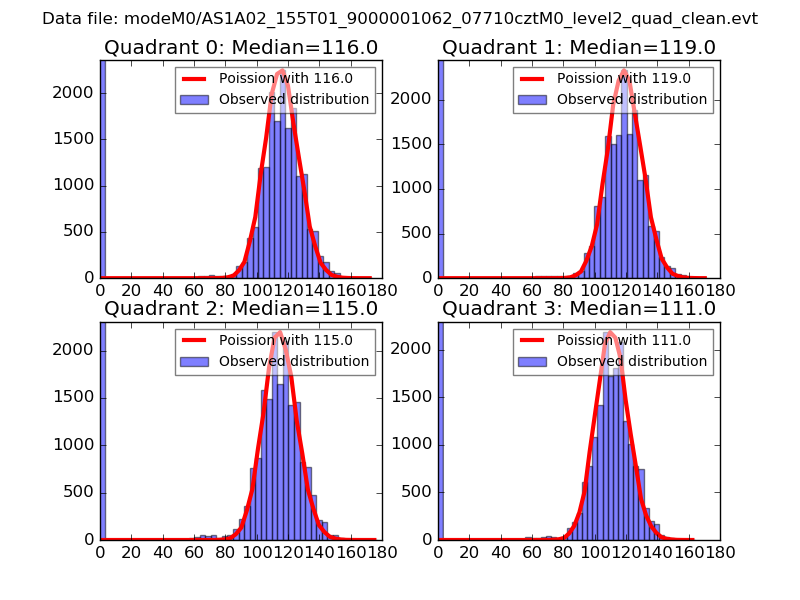 |
 |
| Quadrant-wise count rates Data is divided into 100 sec bins |
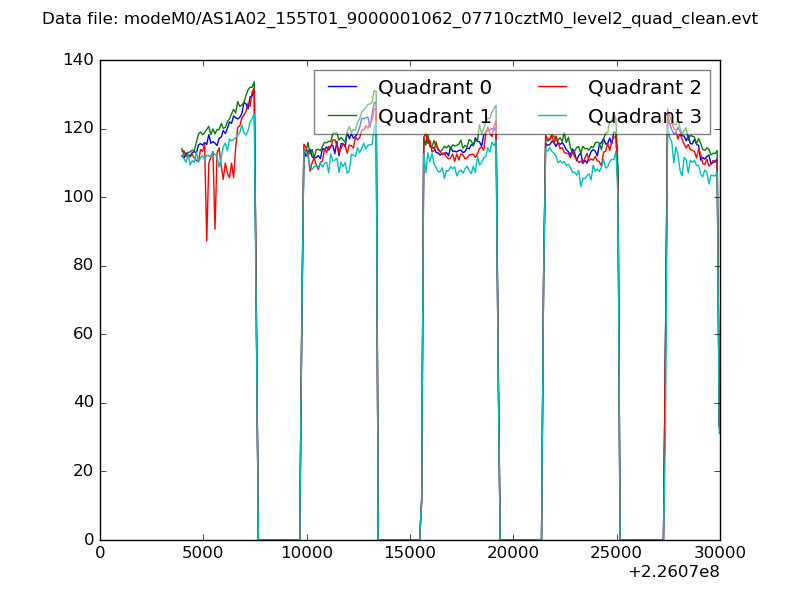 |
|
| Module-wise count rates for Quadrant A Data is divided into 100 sec bins |
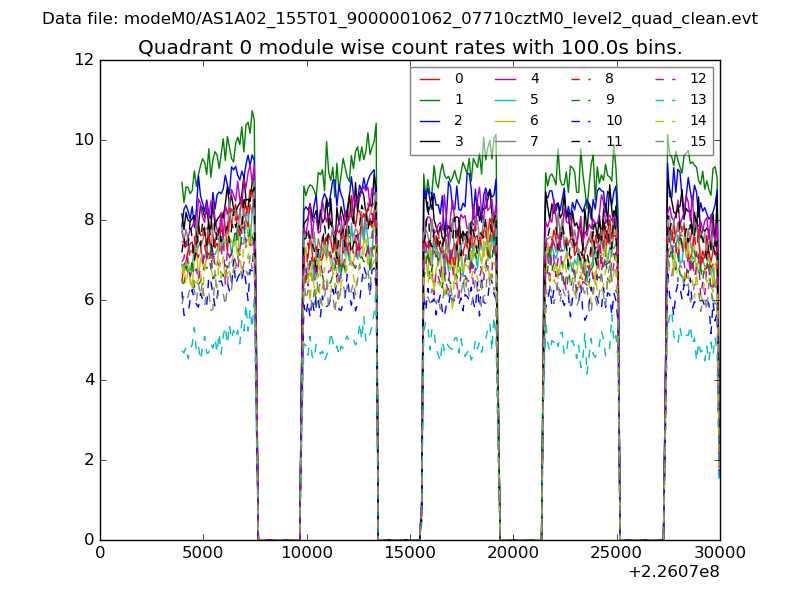 |
 |
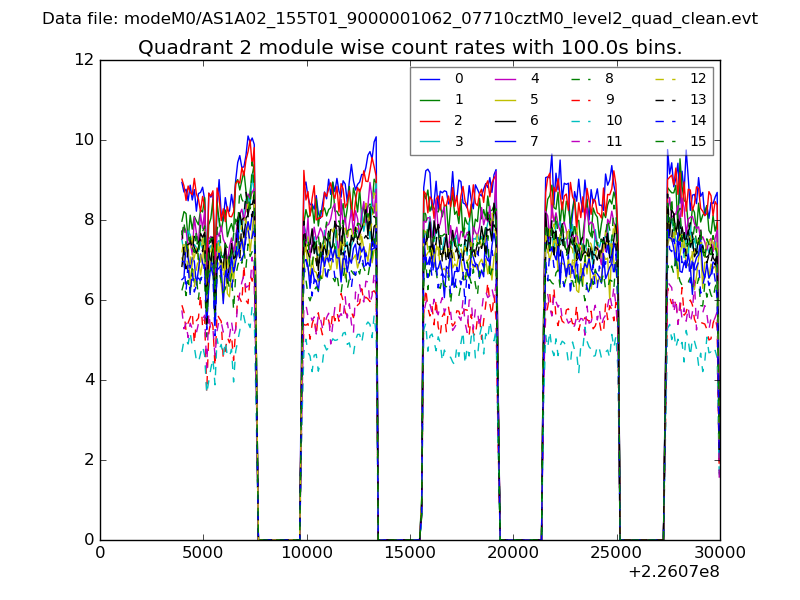
| Module-wise count rates for Quadrant B Data is divided into 100 sec bins |
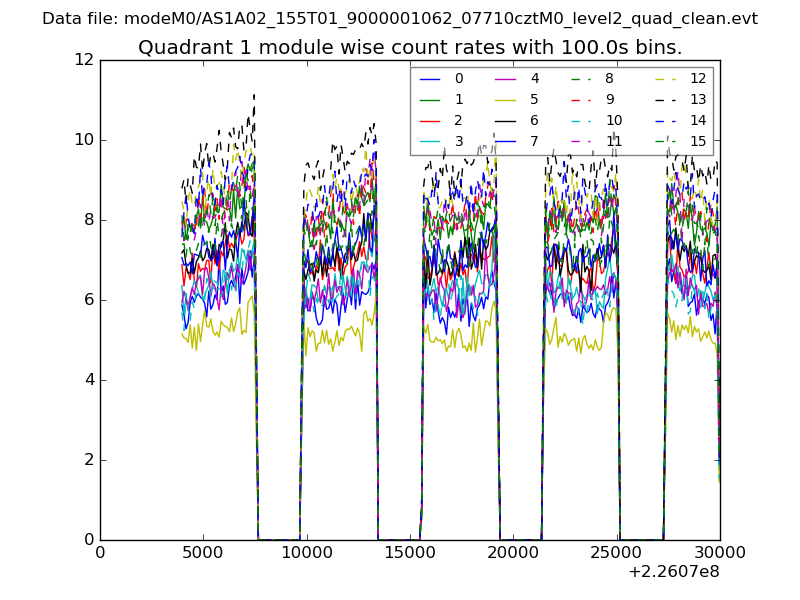 |
 |
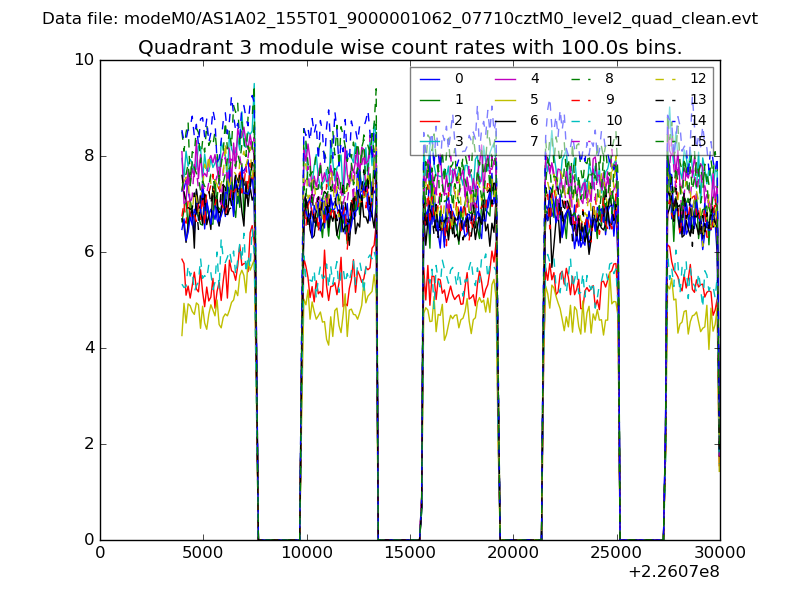
| Module-wise count rates for Quadrant C Data is divided into 100 sec bins |
 |
 |
| Module-wise count rates for Quadrant D Data is divided into 100 sec bins |
 |
 |
| Parameter | Plot |
|---|---|
| CZT HV Monitor |  |
| D_VDD | 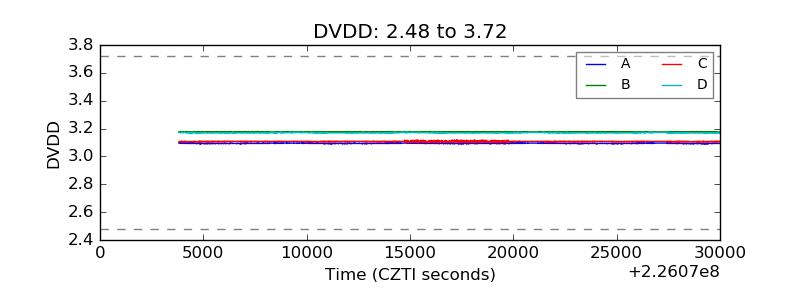 |
| Temperature 1 | 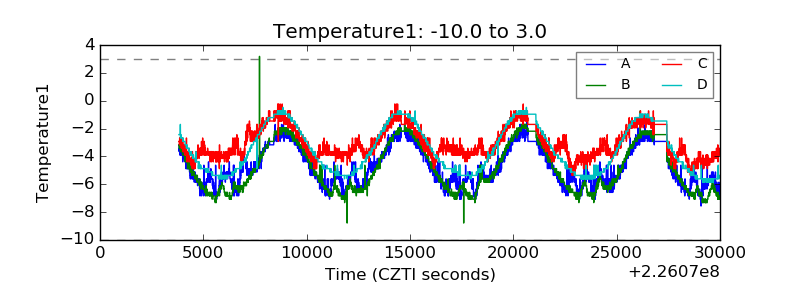 |
| Veto HV Monitor | 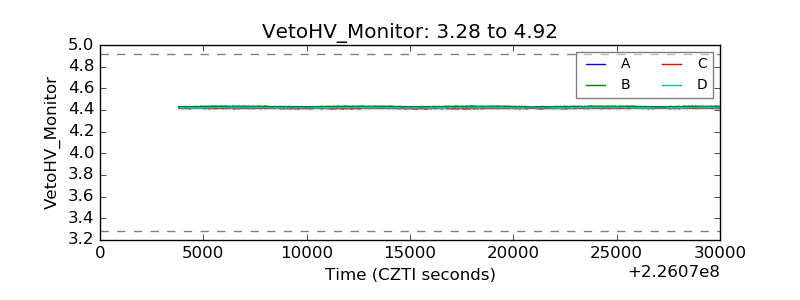 |
| Veto LLD | 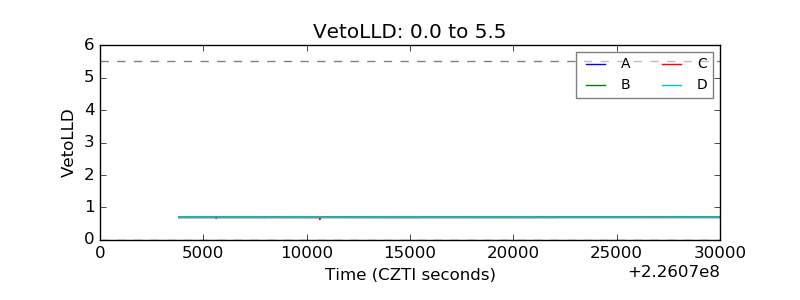 |
| Alpha Counter | 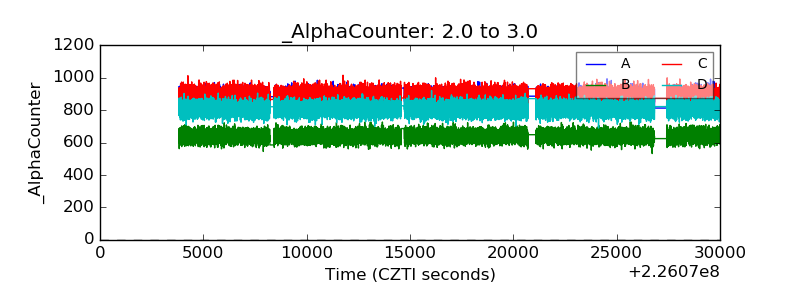 |
| _CPM_Rate | 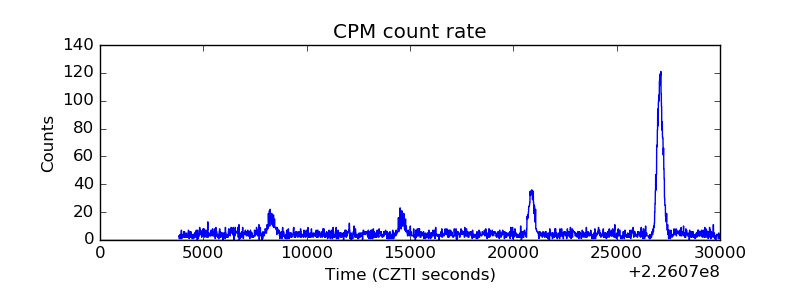 |
| CZT Counter | 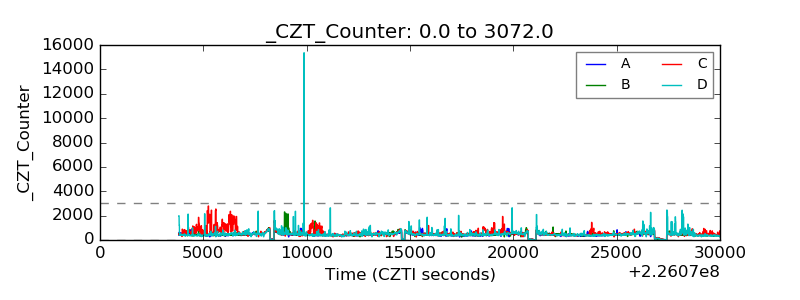 |
| +2.5 Volts monitor |  |
| +5 Volts monitor | 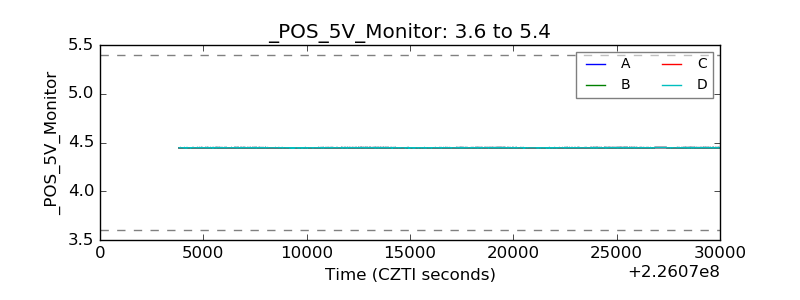 |
| _ROLL_ROT | 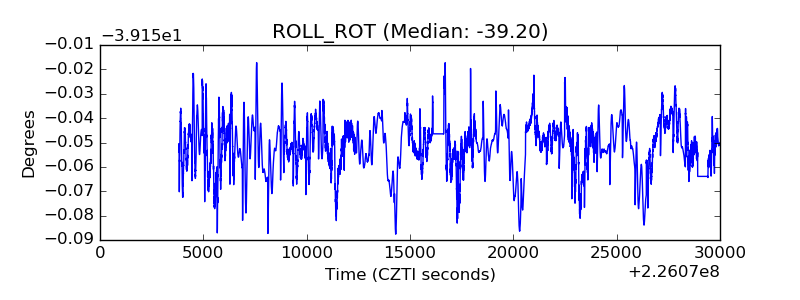 |
| _Roll_DEC | 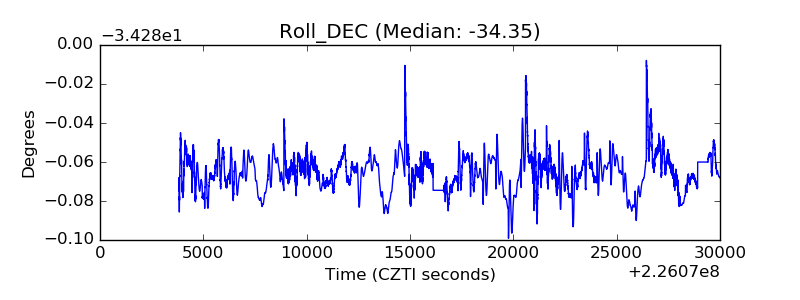 |
| _Roll_RA | 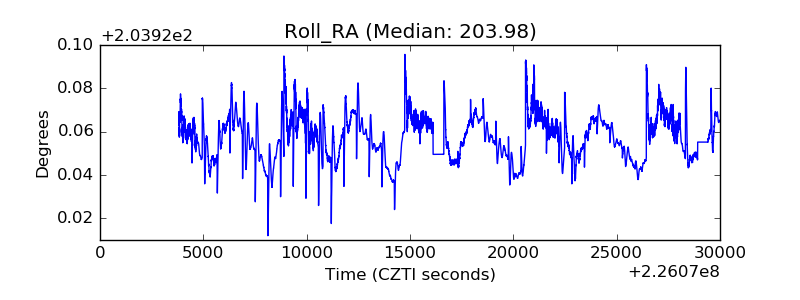 |
| Veto Counter | 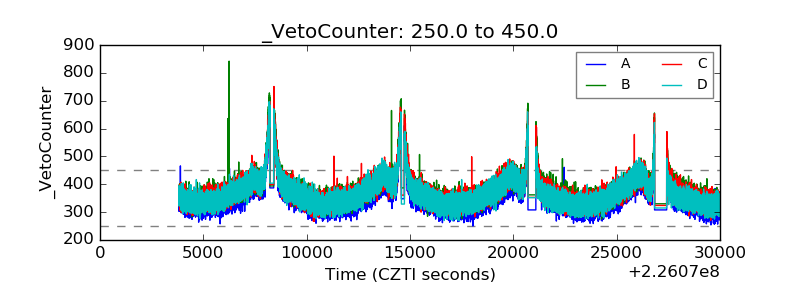 |