| Param | Original file | Final file |
|---|---|---|
| Filename | modeM0/AS1A02_158T01_9000001064cztM0_level2.fits | modeM0/AS1A02_158T01_9000001064cztM0_level2_quad_clean.evt |
| Size (bytes) | 456,209,280 | 357,148,800 |
| Size | 435.1 MB | 340.6 MB |
| Events in quadrant A | 2,774,612 | 1,956,307 |
| Events in quadrant B | 2,678,500 | 1,982,311 |
| Events in quadrant C | 2,757,220 | 1,883,730 |
| Events in quadrant D | 2,320,228 | 1,707,373 |
| Mode M9 | |||
|---|---|---|---|
| Quadrant | BADHDUFLAG | Total packets | Discarded packets |
| A | 0 | 95 | 0 |
| B | 0 | 95 | 0 |
| C | 0 | 95 | 0 |
| D | 0 | 95 | 0 |
| Mode SS | |||
|---|---|---|---|
| Quadrant | BADHDUFLAG | Total packets | Discarded packets |
| A | 0 | 972 | 0 |
| B | 0 | 972 | 0 |
| C | 0 | 972 | 0 |
| D | 0 | 972 | 0 |
| Mode M0 | |||
|---|---|---|---|
| Quadrant | BADHDUFLAG | Total packets | Discarded packets |
| A | 0 | 100436 | 0 |
| B | 0 | 100942 | 0 |
| C | 0 | 101252 | 0 |
| D | 0 | 118660 | 0 |
| Quadrant | Total seconds | Saturated seconds | Saturation percentage |
|---|---|---|---|
| A | 47876 | 672 | 1.403626% |
| B | 47876 | 658 | 1.374384% |
| C | 47876 | 581 | 1.213552% |
| D | 47876 | 2499 | 5.219734% |
Noise dominated data is calculated using 1-second bins in cleaned event files. If a bin has >2000 counts, and if more than 50% of those come from <1% of pixels, then it is considered to be noise-dominated and hence unusable.
| Quadrant | # 1 sec bins | Bins with >0 counts | Bins with >2000 counts | High rate bins dominated by noise | Noise dominated (total time) | Noise dominated (detector-on time) | Marked lightcurve |
|---|---|---|---|---|---|---|---|
| A | 57271 | 47862 | 0 | 0 | 0.00% | 0.00% | 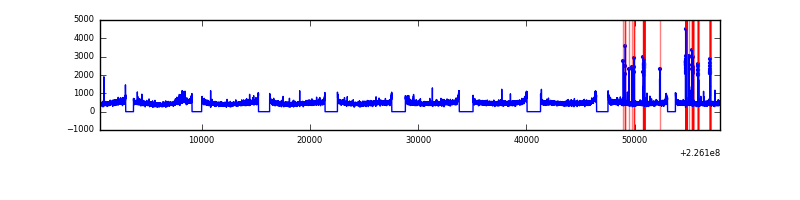 |
| B | 57271 | 47872 | 0 | 0 | 0.00% | 0.00% | 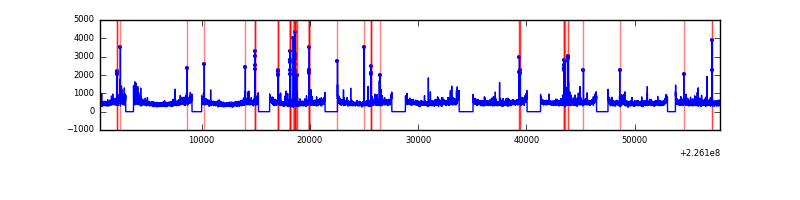 |
| C | 57271 | 47874 | 0 | 0 | 0.00% | 0.00% | 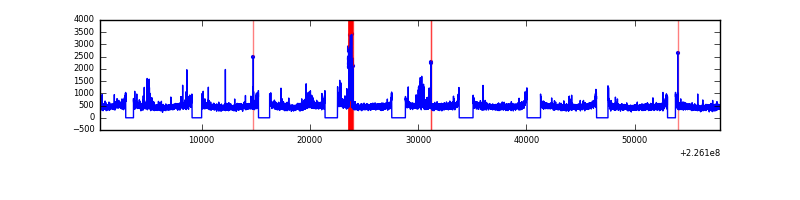 |
| D | 57271 | 47837 | 0 | 0 | 0.00% | 0.00% |  |
Top three noisy pixels from each quadrant. If the there are fewer than three noisy pixels in the level2.evt file, extra rows are filled as -1
| Pixel properties | Quadrant properties | ||||||
|---|---|---|---|---|---|---|---|
| Quadrant | DetID | PixID | Counts | Sigma | Mean | Median | Sigma |
| A | 0 | 29 | 2731 | 11.3 | 721 | 674 | 182.1 |
| A | 7 | 110 | 2331 | 9.1 | 721 | 674 | 182.1 |
| A | 0 | 30 | 2103 | 7.85 | 721 | 674 | 182.1 |
| B | 2 | 9 | 2281 | 11.38 | 705 | 671 | 141.5 |
| B | 3 | 17 | 1815 | 8.08 | 705 | 671 | 141.5 |
| B | 12 | 226 | 1795 | 7.94 | 705 | 671 | 141.5 |
| C | 1 | 80 | 2040 | 7.06 | 728 | 675 | 193.3 |
| C | 1 | 81 | 2004 | 6.88 | 728 | 675 | 193.3 |
| C | 12 | 241 | 1927 | 6.48 | 728 | 675 | 193.3 |
| D | 7 | 5 | 1697 | 6.16 | 664 | 606 | 177.0 |
| D | 7 | 3 | 1660 | 5.95 | 664 | 606 | 177.0 |
| D | 6 | 231 | 1640 | 5.84 | 664 | 606 | 177.0 |
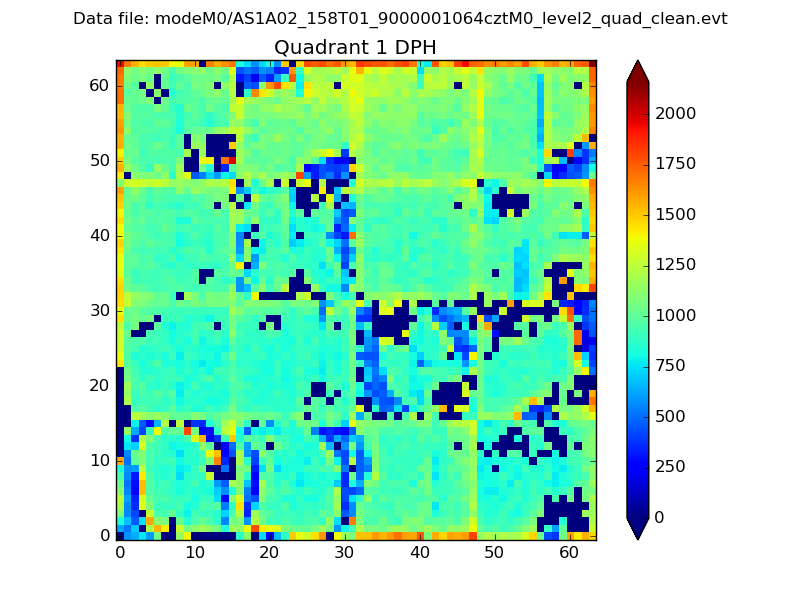
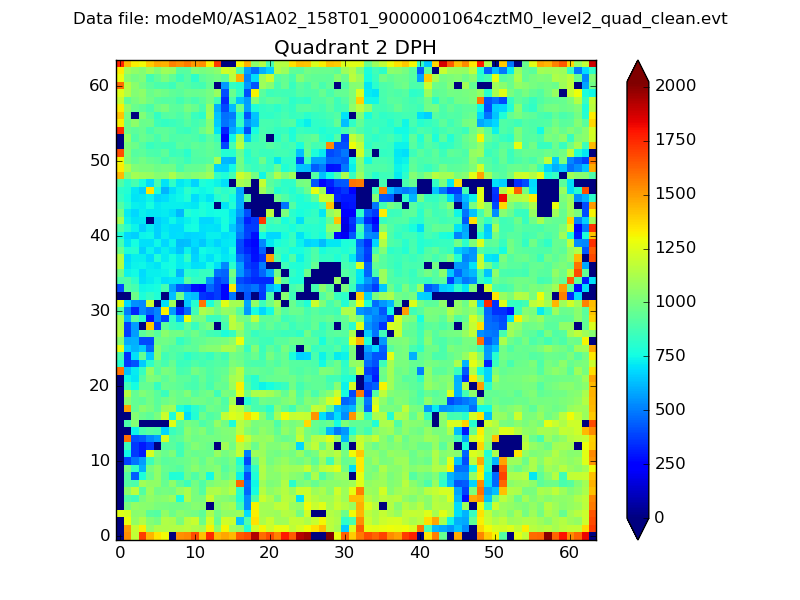
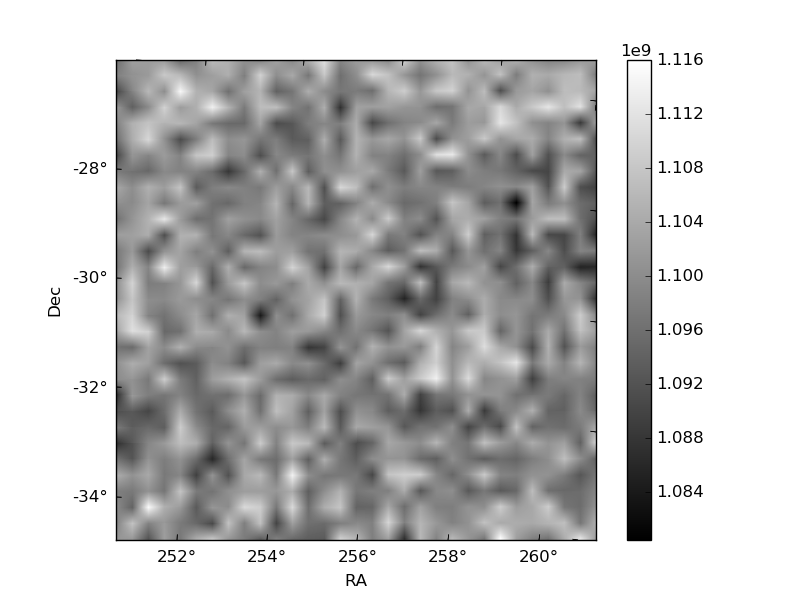
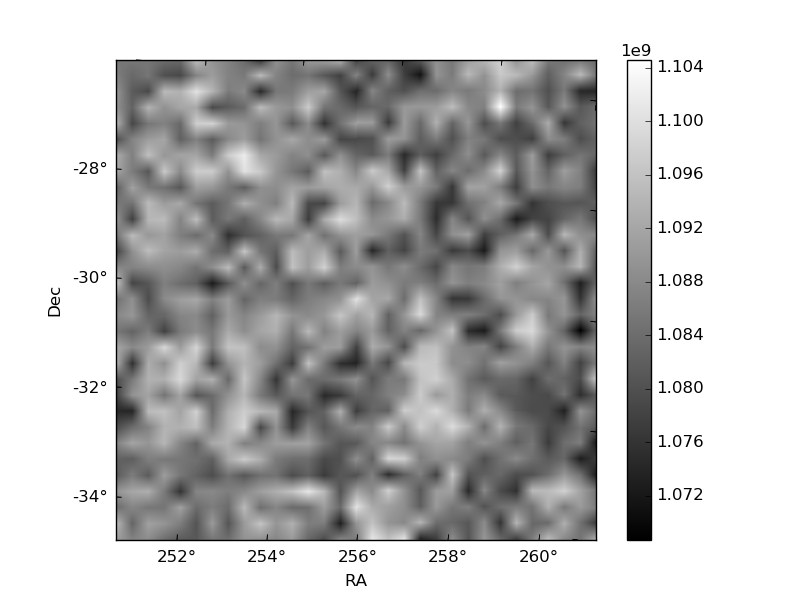
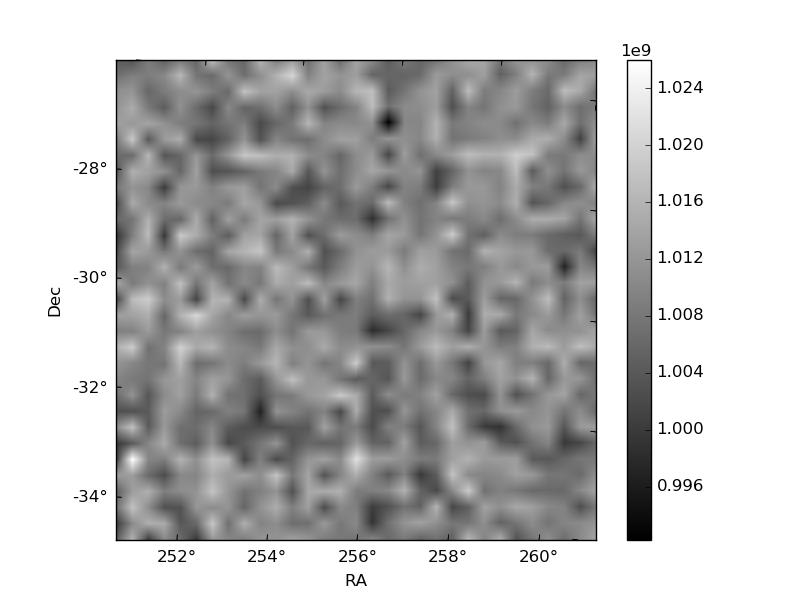
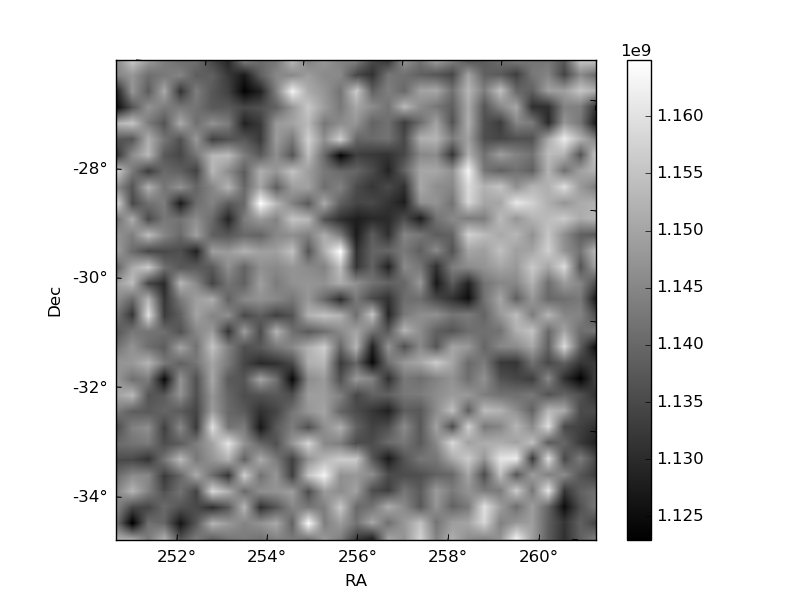
Histogram calculated using DETX and DETY for each event in the final _common_clean file
| Quadrant A | 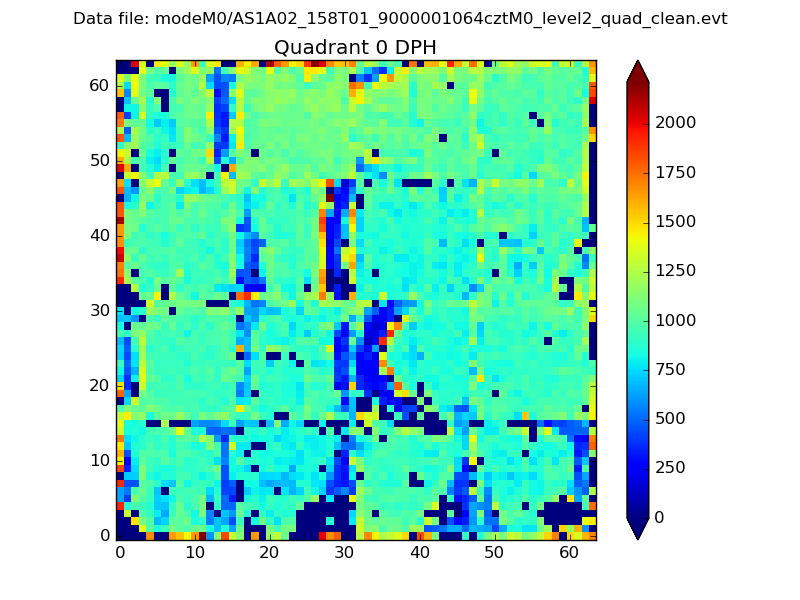 |
 |
Quadrant B |
|---|---|---|---|
| Quadrant D | 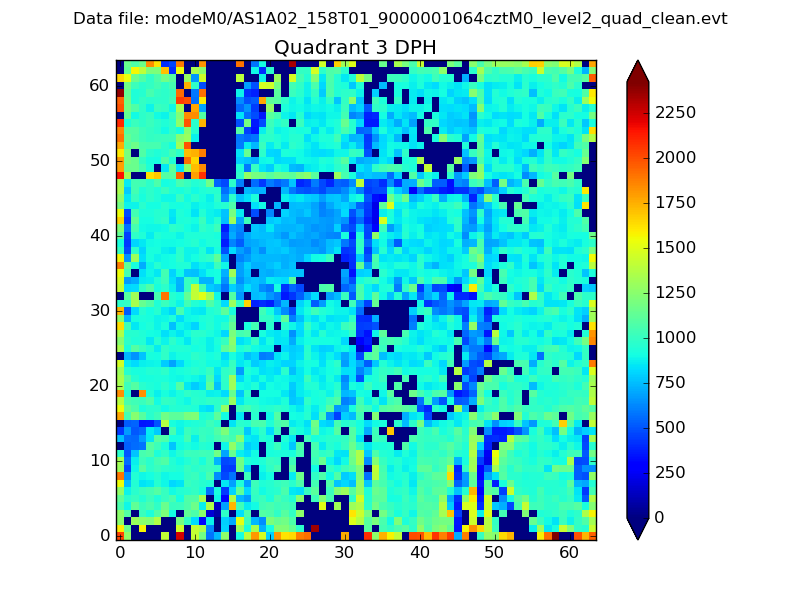 |
 |
Quadrant C |
| Plot type | Count rate plots | Images |
|---|---|---|
| Comparison with Poisson distribution Blue bars denote a histogram of data divided into 1 sec bins. Red curve is a Poisson curve with rate = median count rate of data. |
 |
 |
| Quadrant-wise count rates Data is divided into 100 sec bins |
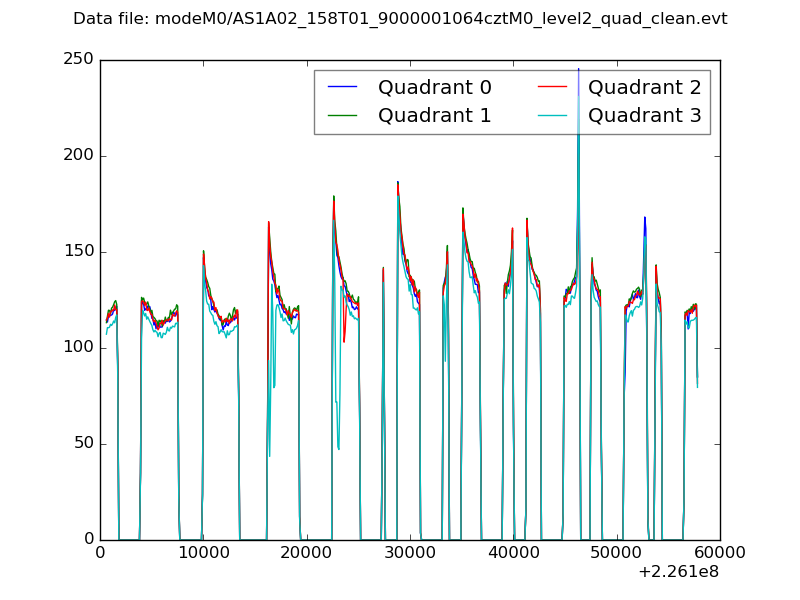 |
|
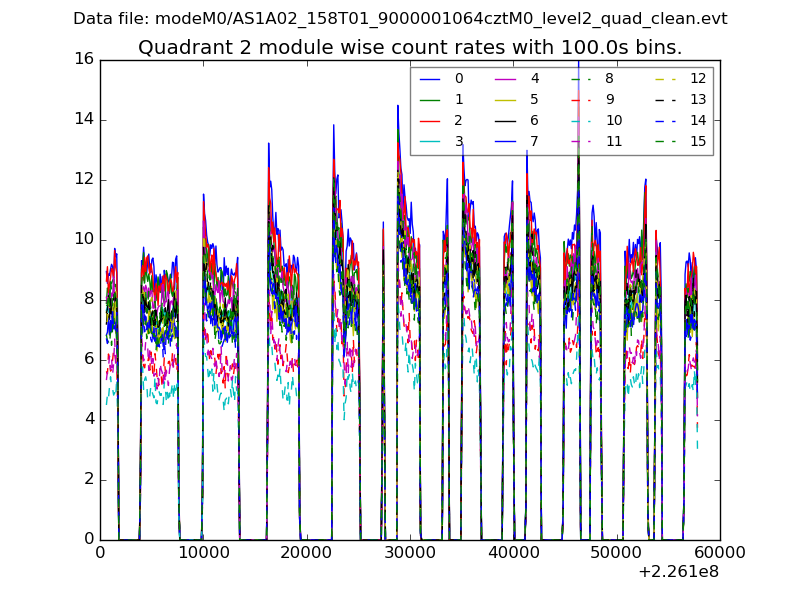
| Module-wise count rates for Quadrant A Data is divided into 100 sec bins |
 |
 |
| Module-wise count rates for Quadrant B Data is divided into 100 sec bins |
 |
 |
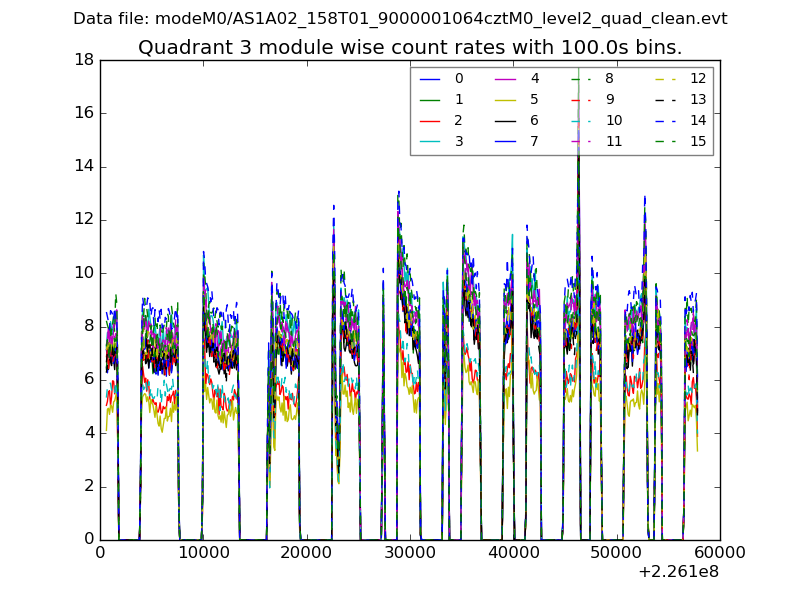
| Module-wise count rates for Quadrant C Data is divided into 100 sec bins |
 |
 |
| Module-wise count rates for Quadrant D Data is divided into 100 sec bins |
 |
 |
| Parameter | Plot |
|---|---|
| CZT HV Monitor |  |
| D_VDD | 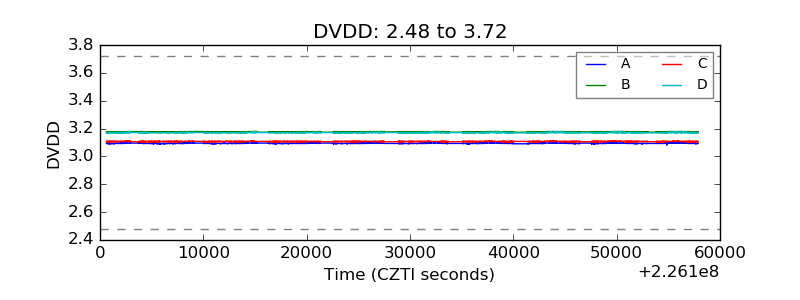 |
| Temperature 1 | 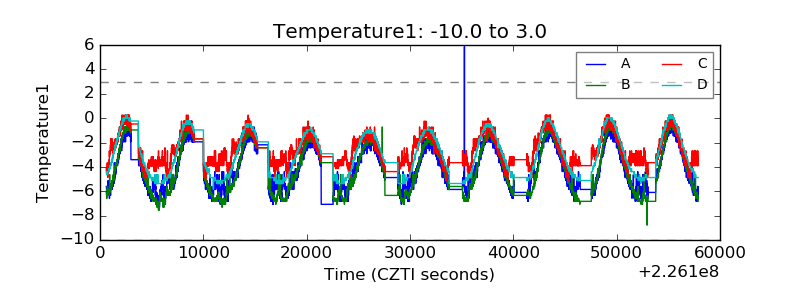 |
| Veto HV Monitor |  |
| Veto LLD | 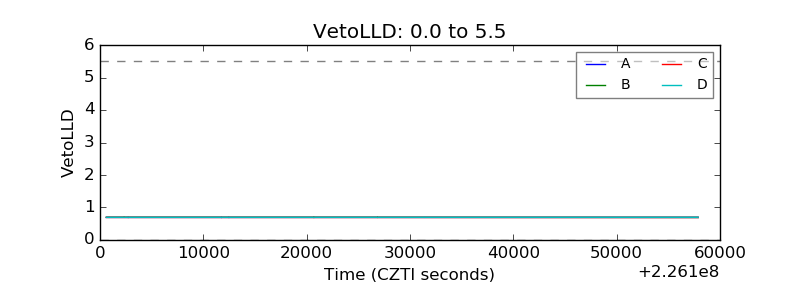 |
| Alpha Counter | 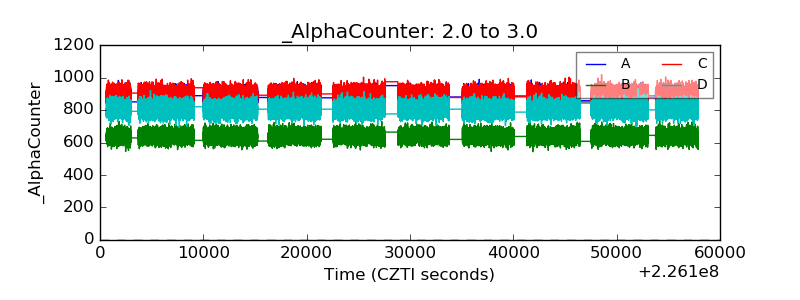 |
| _CPM_Rate | 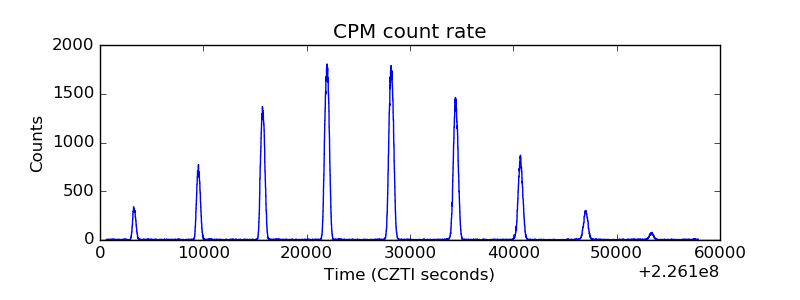 |
| CZT Counter | 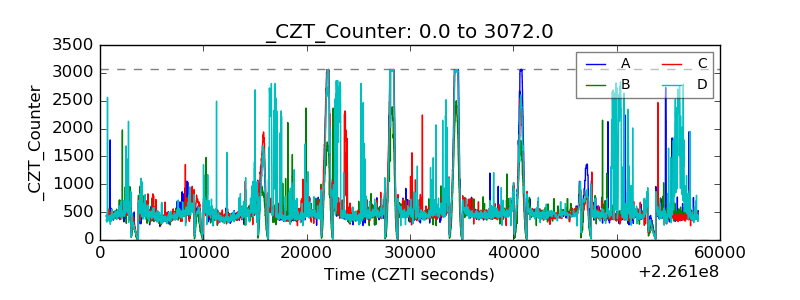 |
| +2.5 Volts monitor |  |
| +5 Volts monitor |  |
| _ROLL_ROT | 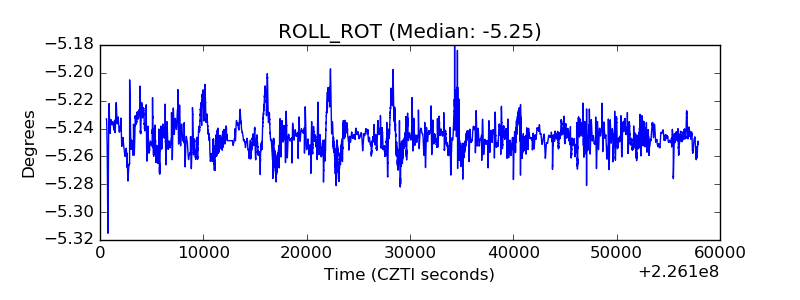 |
| _Roll_DEC | 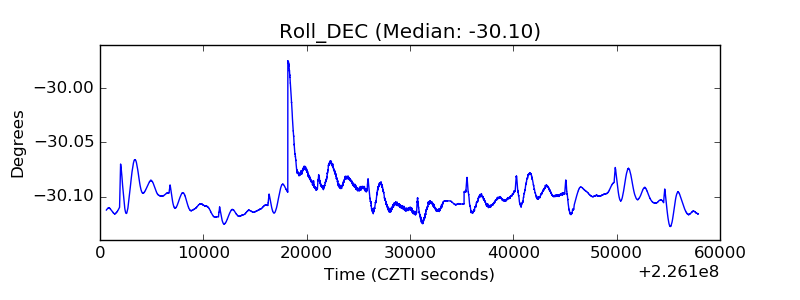 |
| _Roll_RA | 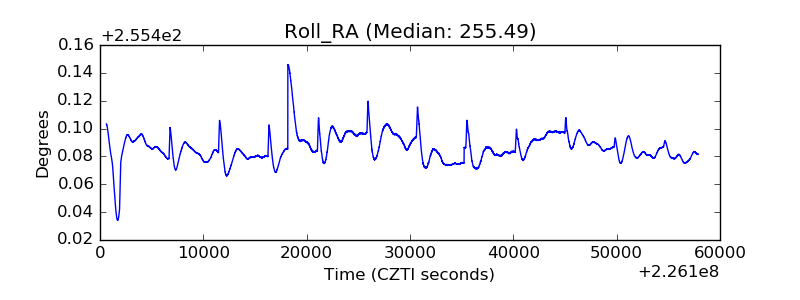 |
| Veto Counter | 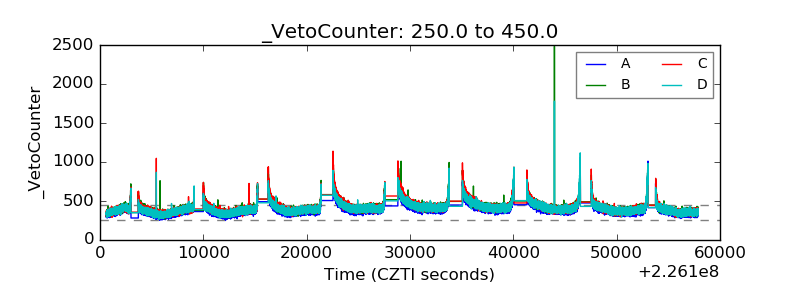 |