| Param | Original file | Final file |
|---|---|---|
| Filename | modeM0/AS1A02_158T01_9000001064_07713cztM0_level2.evt | modeM0/AS1A02_158T01_9000001064_07713cztM0_level2_quad_clean.evt |
| Size (bytes) | 428,754,240 | 82,848,960 |
| Size | 408.9 MB | 79.0 MB |
| Events in quadrant A | 2,838,815 | 527,012 |
| Events in quadrant B | 2,924,874 | 538,484 |
| Events in quadrant C | 3,384,957 | 526,366 |
| Events in quadrant D | 3,426,087 | 495,714 |
| Mode M9 | |||
|---|---|---|---|
| Quadrant | BADHDUFLAG | Total packets | Discarded packets |
| A | 0 | 13 | 0 |
| B | 0 | 13 | 0 |
| C | 0 | 13 | 0 |
| D | 0 | 13 | 0 |
| Mode SS | |||
|---|---|---|---|
| Quadrant | BADHDUFLAG | Total packets | Discarded packets |
| A | 0 | 122 | 0 |
| B | 0 | 122 | 0 |
| C | 0 | 122 | 0 |
| D | 0 | 122 | 0 |
| Mode M0 | |||
|---|---|---|---|
| Quadrant | BADHDUFLAG | Total packets | Discarded packets |
| A | 0 | 12345 | 2 |
| B | 0 | 12527 | 1 |
| C | 0 | 13940 | 1 |
| D | 0 | 14156 | 1 |
| Quadrant | Total seconds | Saturated seconds | Saturation percentage |
|---|---|---|---|
| A | 6032 | 11 | 0.182361% |
| B | 6032 | 30 | 0.497347% |
| C | 6032 | 160 | 2.652520% |
| D | 6032 | 214 | 3.547745% |
Noise dominated data is calculated using 1-second bins in cleaned event files. If a bin has >2000 counts, and if more than 50% of those come from <1% of pixels, then it is considered to be noise-dominated and hence unusable.
| Quadrant | # 1 sec bins | Bins with >0 counts | Bins with >2000 counts | High rate bins dominated by noise | Noise dominated (total time) | Noise dominated (detector-on time) | Marked lightcurve |
|---|---|---|---|---|---|---|---|
| A | 7292 | 6033 | 0 | 0 | 0.00% | 0.00% | 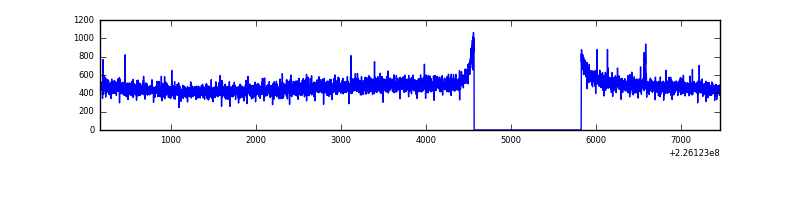 |
| B | 7292 | 6033 | 6 | 6 | 0.08% | 0.10% | 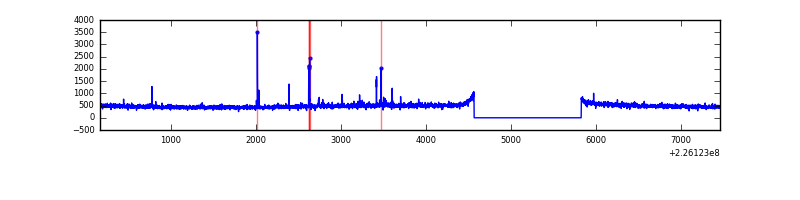 |
| C | 7292 | 6033 | 101 | 101 | 1.39% | 1.67% | 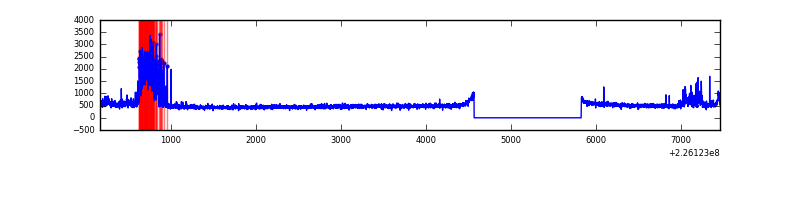 |
| D | 7292 | 6033 | 189 | 189 | 2.59% | 3.13% | 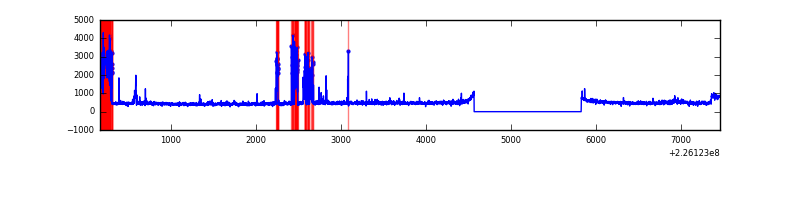 |
Top three noisy pixels from each quadrant. If the there are fewer than three noisy pixels in the level2.evt file, extra rows are filled as -1
| Pixel properties | Quadrant properties | ||||||
|---|---|---|---|---|---|---|---|
| Quadrant | DetID | PixID | Counts | Sigma | Mean | Median | Sigma |
| A | 12 | 112 | 7582 | 45.99 | 735 | 720 | 149.2 |
| A | 0 | 226 | 7045 | 42.39 | 735 | 720 | 149.2 |
| A | 12 | 194 | 6530 | 38.94 | 735 | 720 | 149.2 |
| B | 4 | 239 | 35122 | 247.46 | 738 | 719 | 139.0 |
| B | 12 | 111 | 13656 | 93.05 | 738 | 719 | 139.0 |
| B | 10 | 245 | 11675 | 78.81 | 738 | 719 | 139.0 |
| C | 9 | 68 | 555891 | 3320.91 | 723 | 729 | 167.2 |
| C | 13 | 61 | 5754 | 30.06 | 723 | 729 | 167.2 |
| C | 8 | 222 | 3789 | 18.3 | 723 | 729 | 167.2 |
| D | 12 | 221 | 581738 | 3370.44 | 713 | 693 | 172.4 |
| D | 13 | 112 | 38282 | 218.04 | 713 | 693 | 172.4 |
| D | 9 | 101 | 38185 | 217.48 | 713 | 693 | 172.4 |
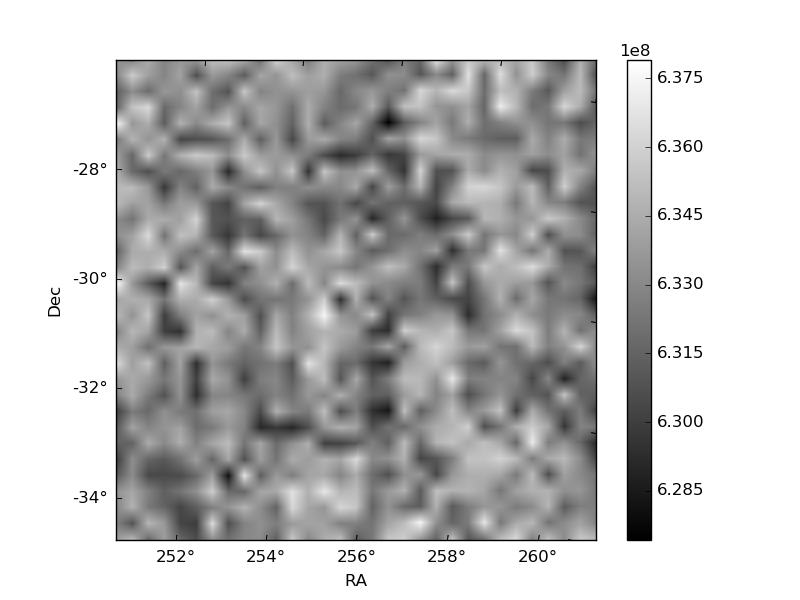
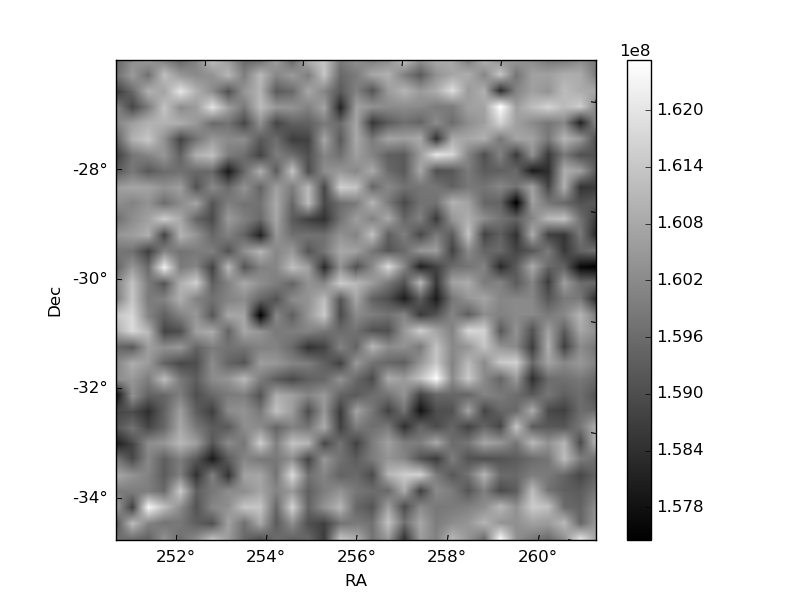
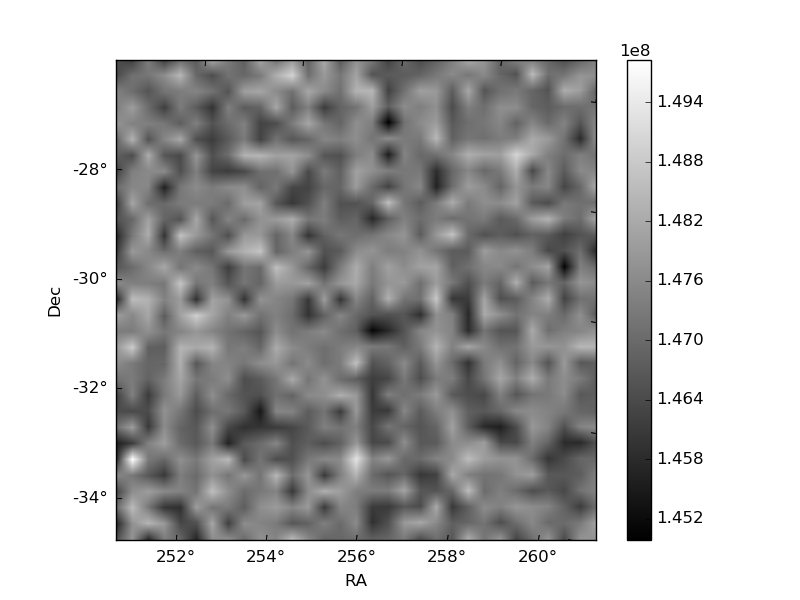
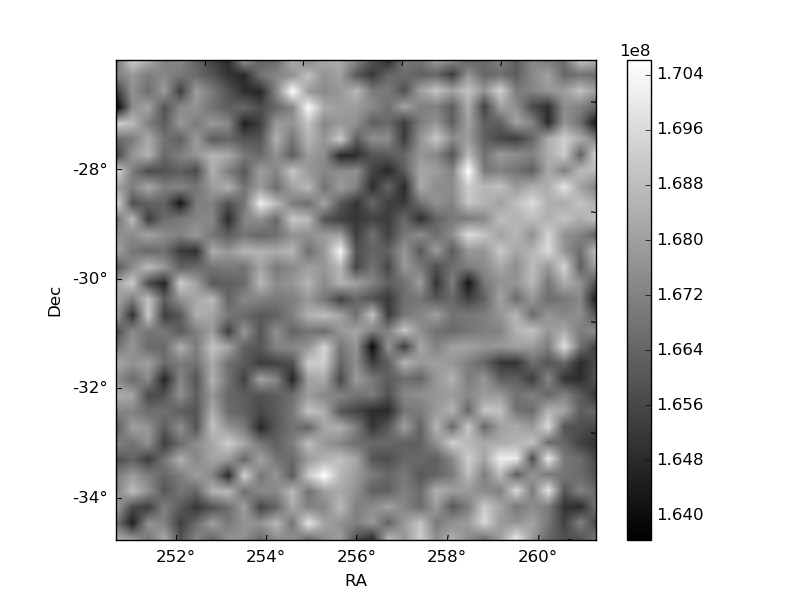
Histogram calculated using DETX and DETY for each event in the final _common_clean file
| Quadrant A | 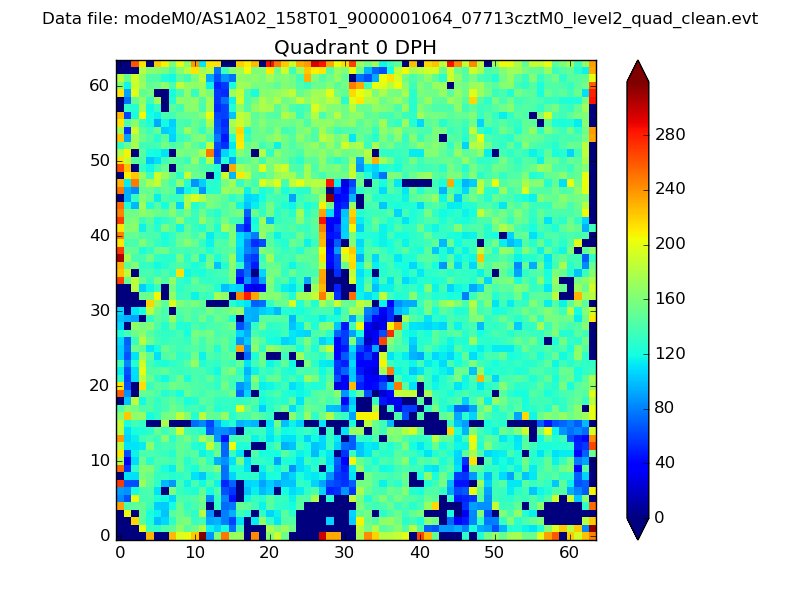 |
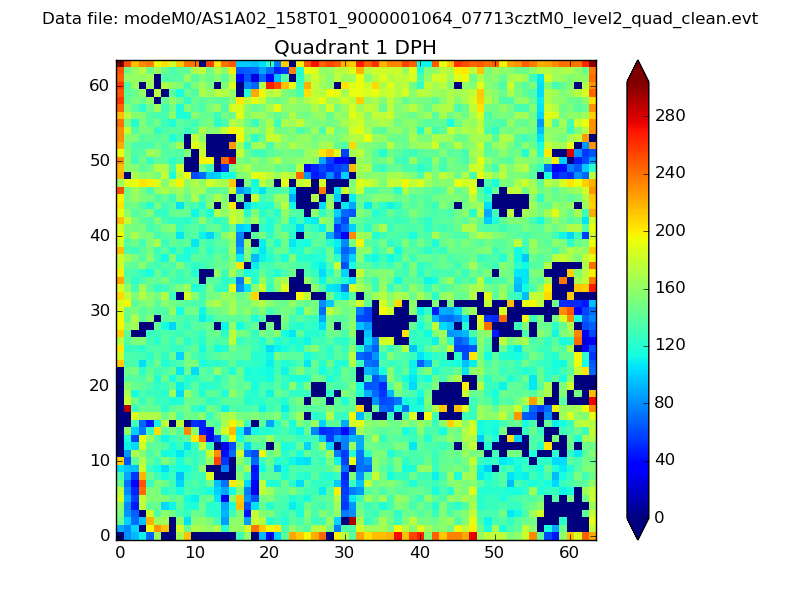 |
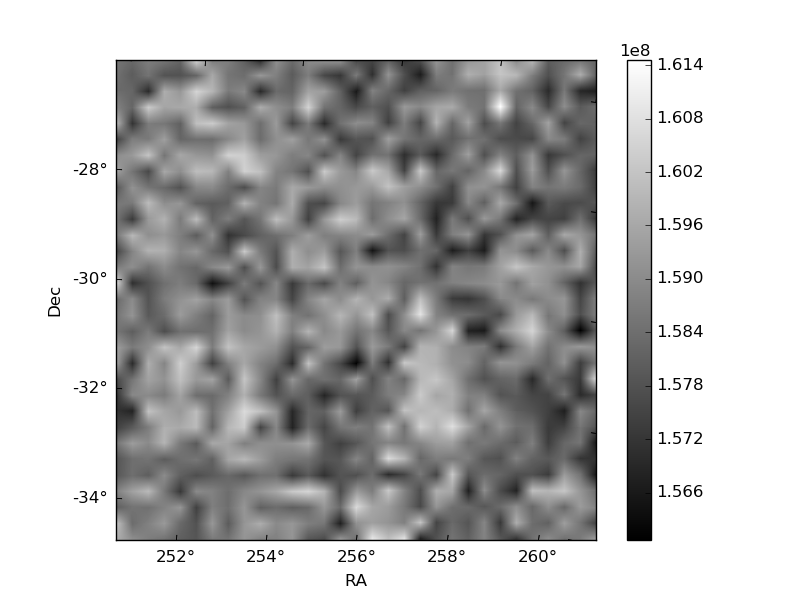
Quadrant B |
|---|---|---|---|
| Quadrant D | 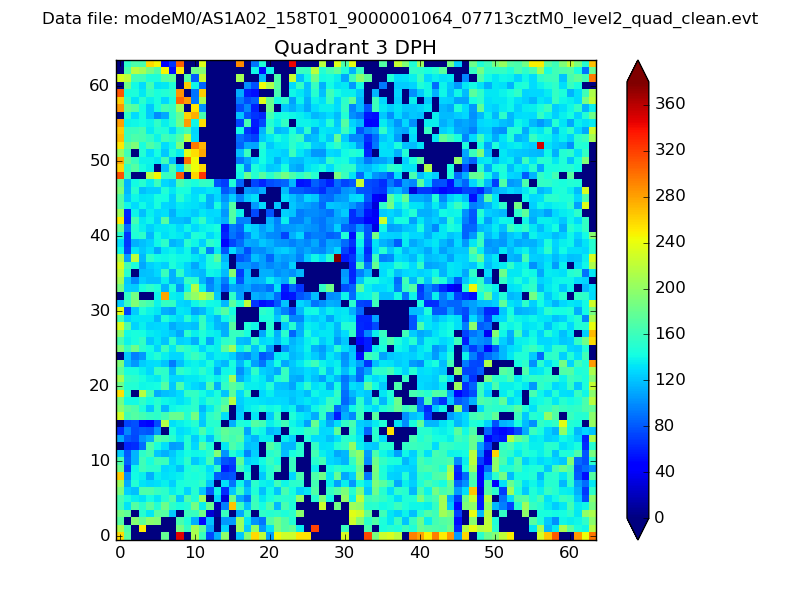 |
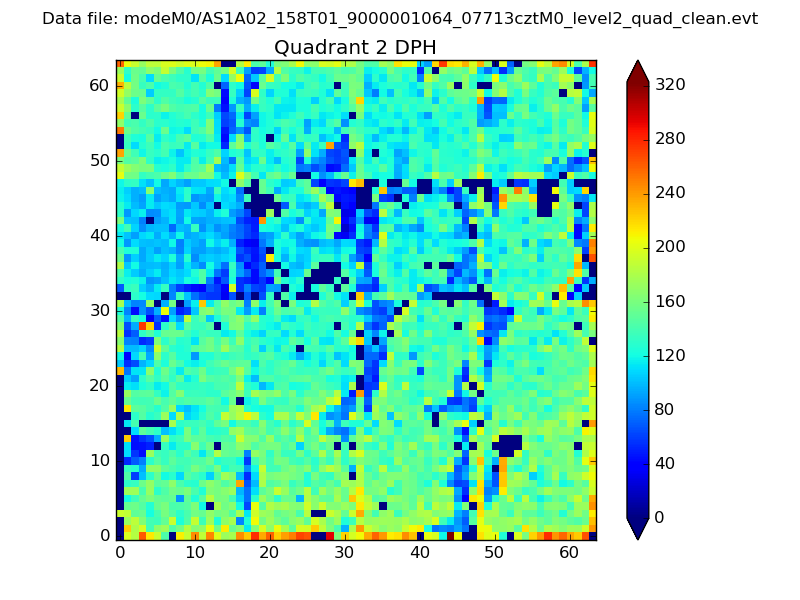 |
Quadrant C |
| Plot type | Count rate plots | Images |
|---|---|---|
| Comparison with Poisson distribution Blue bars denote a histogram of data divided into 1 sec bins. Red curve is a Poisson curve with rate = median count rate of data. |
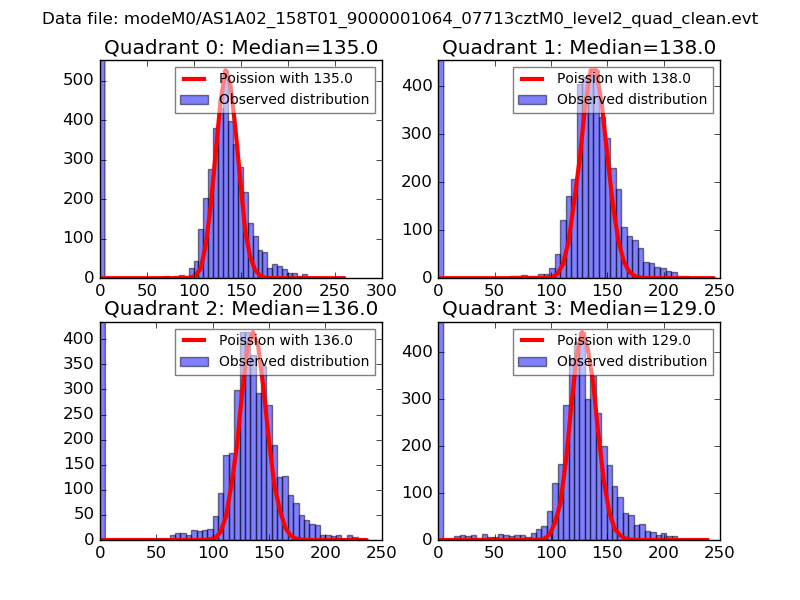 |
 |
| Quadrant-wise count rates Data is divided into 100 sec bins |
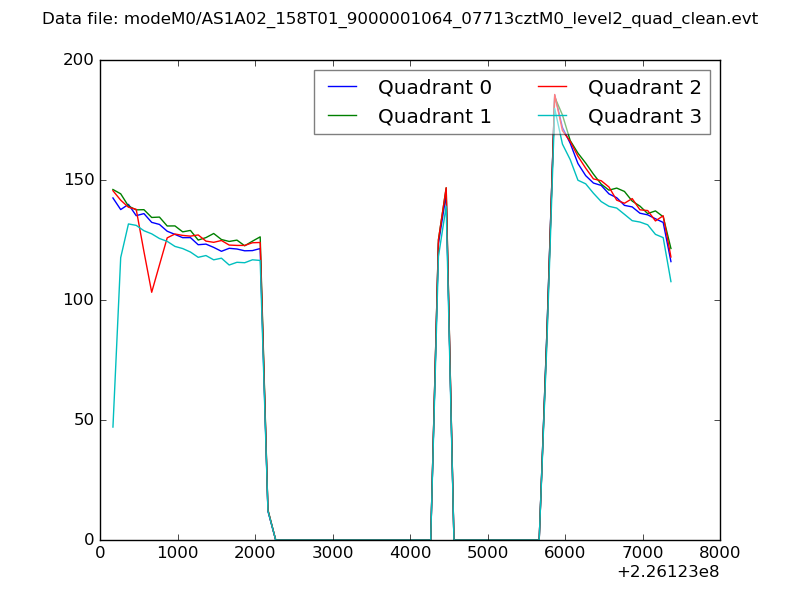 |
|
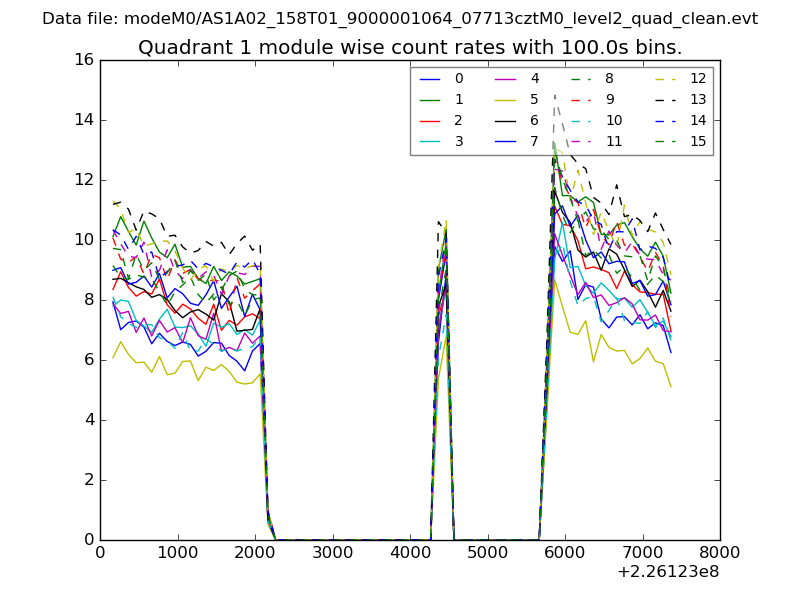
| Module-wise count rates for Quadrant A Data is divided into 100 sec bins |
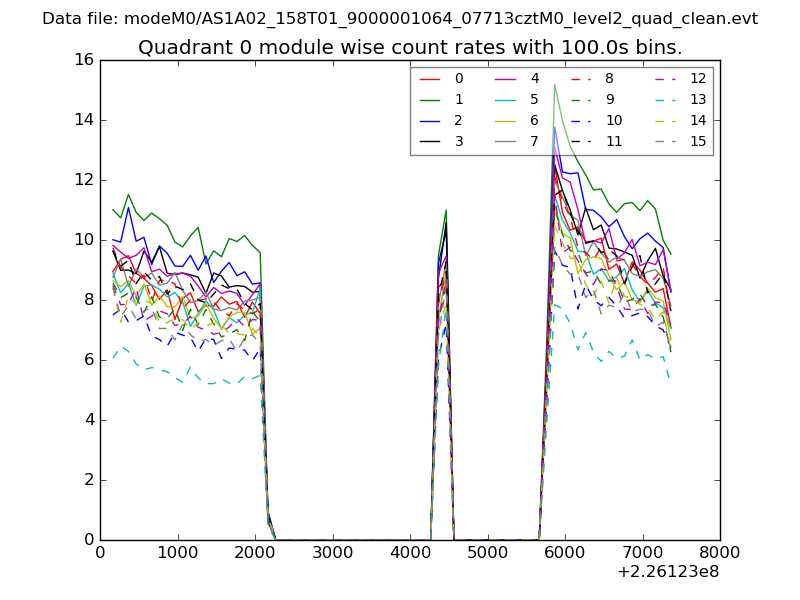 |
 |
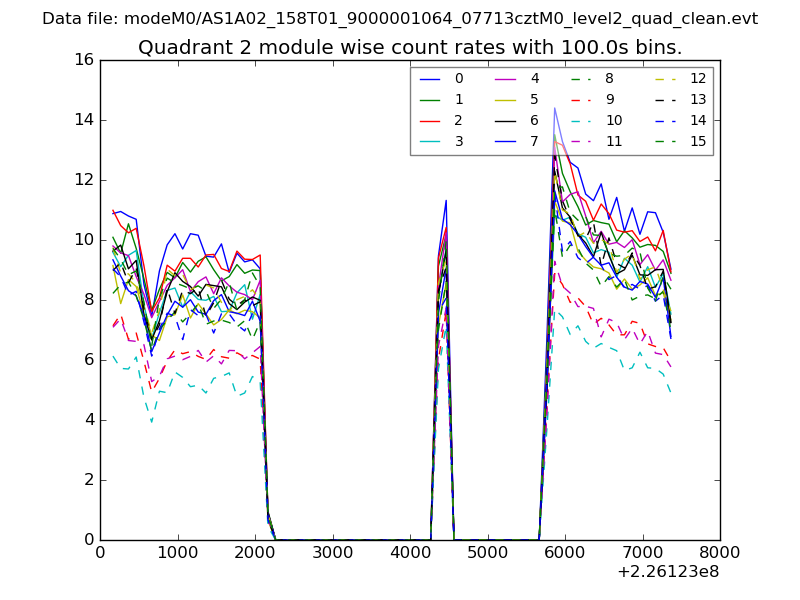
| Module-wise count rates for Quadrant B Data is divided into 100 sec bins |
 |
 |
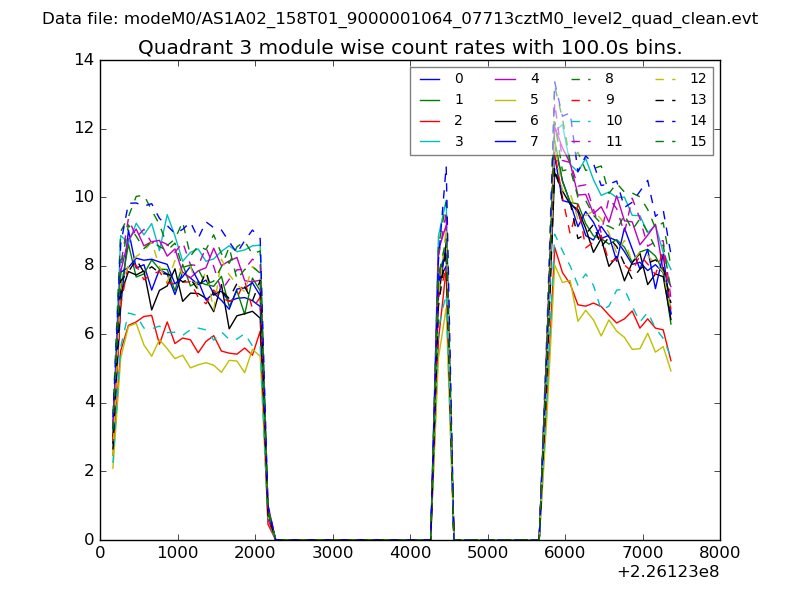
| Module-wise count rates for Quadrant C Data is divided into 100 sec bins |
 |
 |
| Module-wise count rates for Quadrant D Data is divided into 100 sec bins |
 |
 |
| Parameter | Plot |
|---|---|
| CZT HV Monitor | 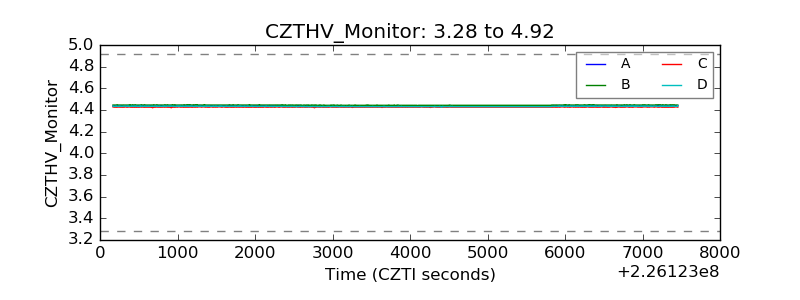 |
| D_VDD | 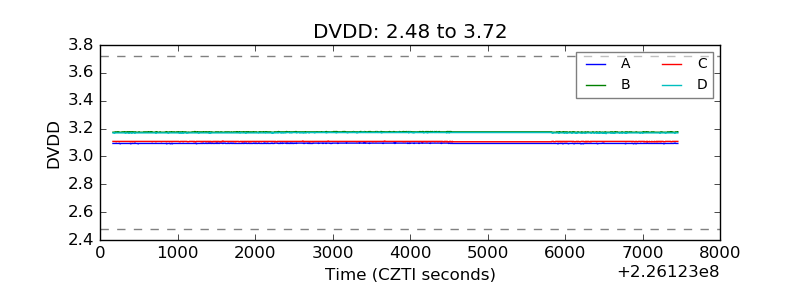 |
| Temperature 1 | 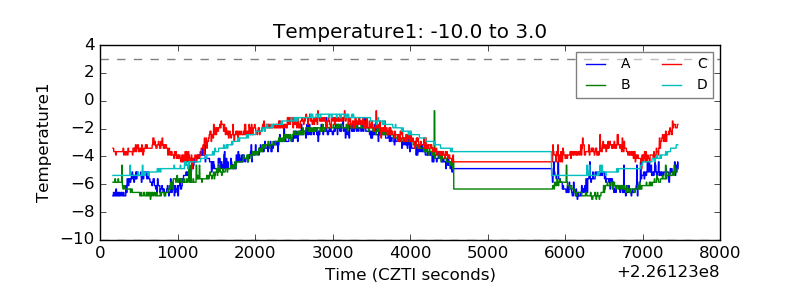 |
| Veto HV Monitor | 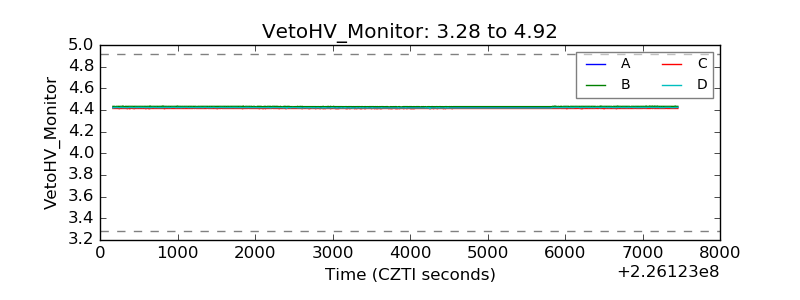 |
| Veto LLD | 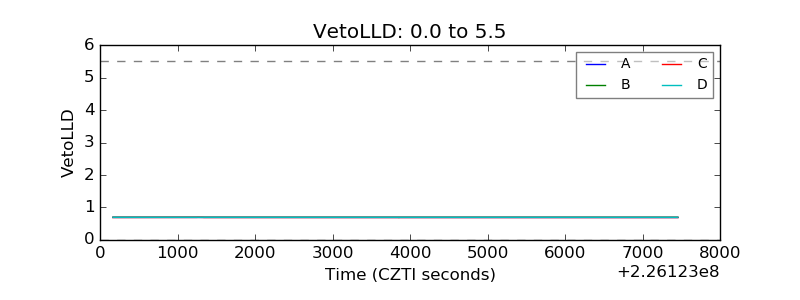 |
| Alpha Counter | 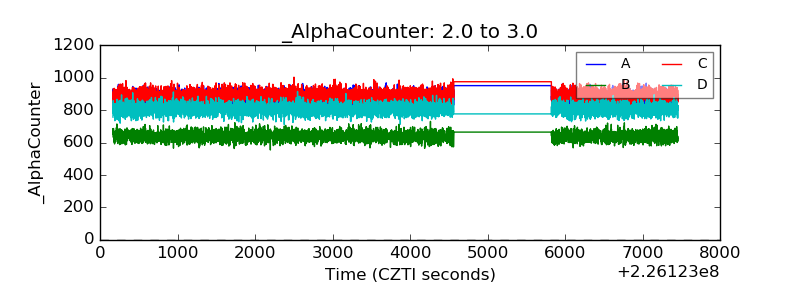 |
| _CPM_Rate | 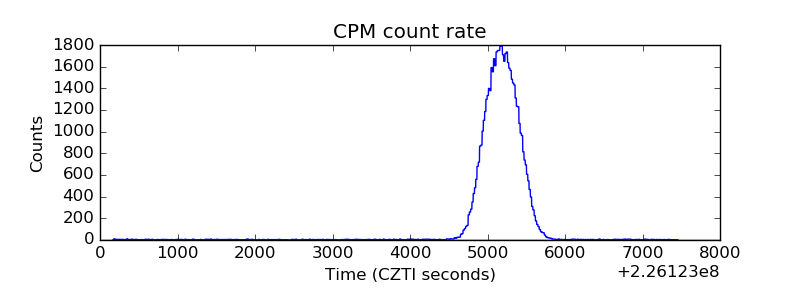 |
| CZT Counter | 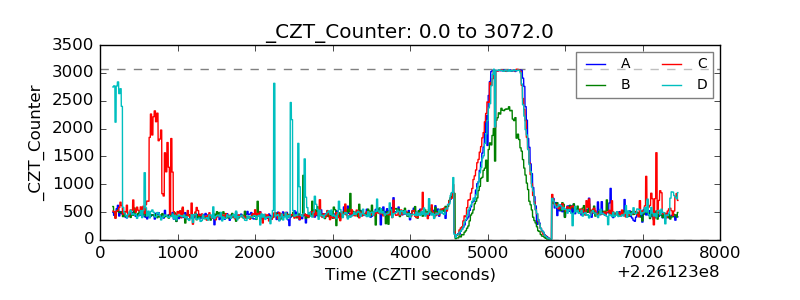 |
| +2.5 Volts monitor |  |
| +5 Volts monitor |  |
| _ROLL_ROT | 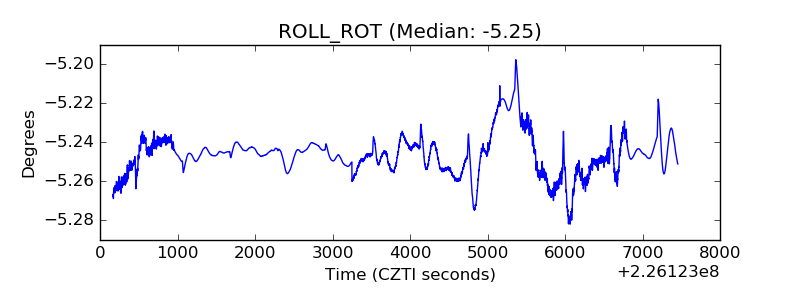 |
| _Roll_DEC | 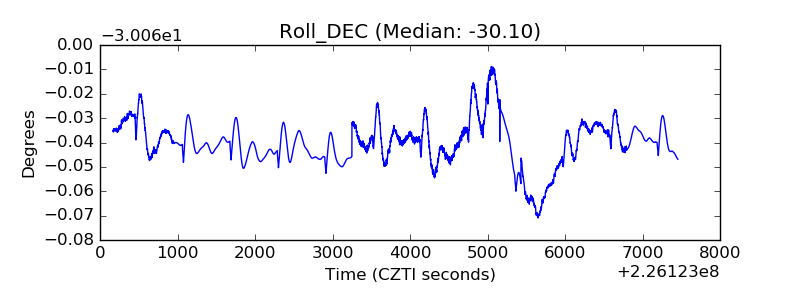 |
| _Roll_RA | 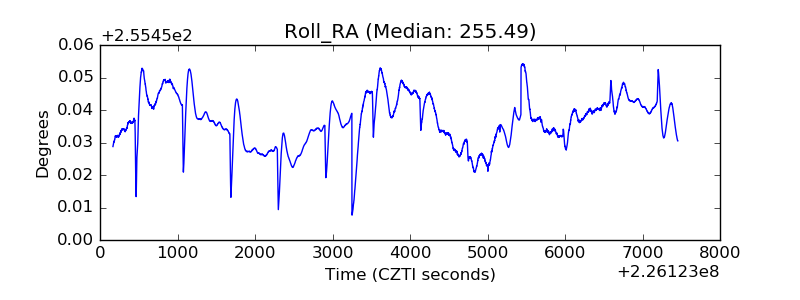 |
| Veto Counter | 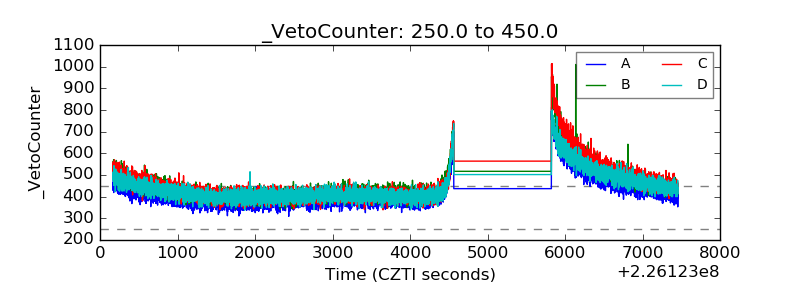 |