| Param | Original file | Final file |
|---|---|---|
| Filename | modeM0/AS1A02_158T01_9000001064_07714cztM0_level2.evt | modeM0/AS1A02_158T01_9000001064_07714cztM0_level2_quad_clean.evt |
| Size (bytes) | 444,078,720 | 92,280,960 |
| Size | 423.5 MB | 88.0 MB |
| Events in quadrant A | 3,086,996 | 591,464 |
| Events in quadrant B | 3,163,126 | 605,293 |
| Events in quadrant C | 3,284,097 | 596,478 |
| Events in quadrant D | 3,487,456 | 562,672 |
| Mode M9 | |||
|---|---|---|---|
| Quadrant | BADHDUFLAG | Total packets | Discarded packets |
| A | 0 | 13 | 0 |
| B | 0 | 13 | 0 |
| C | 0 | 13 | 0 |
| D | 0 | 13 | 0 |
| Mode SS | |||
|---|---|---|---|
| Quadrant | BADHDUFLAG | Total packets | Discarded packets |
| A | 0 | 128 | 0 |
| B | 0 | 128 | 0 |
| C | 0 | 128 | 0 |
| D | 0 | 128 | 0 |
| Mode M0 | |||
|---|---|---|---|
| Quadrant | BADHDUFLAG | Total packets | Discarded packets |
| A | 0 | 13032 | 3 |
| B | 0 | 13195 | 2 |
| C | 0 | 13608 | 2 |
| D | 0 | 14336 | 2 |
| Quadrant | Total seconds | Saturated seconds | Saturation percentage |
|---|---|---|---|
| A | 6285 | 48 | 0.763723% |
| B | 6285 | 59 | 0.938743% |
| C | 6285 | 39 | 0.620525% |
| D | 6286 | 147 | 2.338530% |
Noise dominated data is calculated using 1-second bins in cleaned event files. If a bin has >2000 counts, and if more than 50% of those come from <1% of pixels, then it is considered to be noise-dominated and hence unusable.
| Quadrant | # 1 sec bins | Bins with >0 counts | Bins with >2000 counts | High rate bins dominated by noise | Noise dominated (total time) | Noise dominated (detector-on time) | Marked lightcurve |
|---|---|---|---|---|---|---|---|
| A | 7570 | 6286 | 0 | 0 | 0.00% | 0.00% |  |
| B | 7570 | 6286 | 0 | 0 | 0.00% | 0.00% | 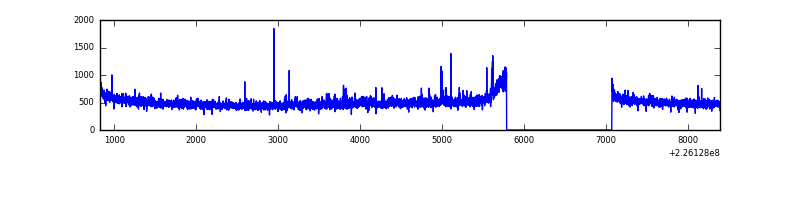 |
| C | 7570 | 6286 | 2 | 2 | 0.03% | 0.03% | 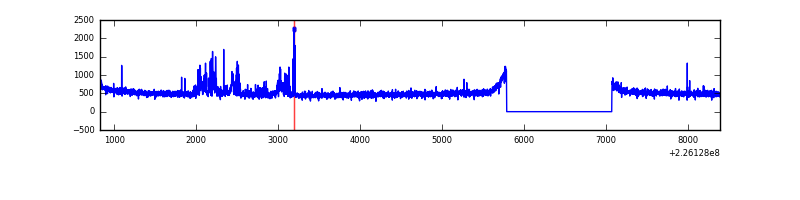 |
| D | 7571 | 6287 | 96 | 96 | 1.27% | 1.53% |  |
Top three noisy pixels from each quadrant. If the there are fewer than three noisy pixels in the level2.evt file, extra rows are filled as -1
| Pixel properties | Quadrant properties | ||||||
|---|---|---|---|---|---|---|---|
| Quadrant | DetID | PixID | Counts | Sigma | Mean | Median | Sigma |
| A | 12 | 112 | 7634 | 42.51 | 799 | 784 | 161.2 |
| A | 0 | 226 | 7589 | 42.23 | 799 | 784 | 161.2 |
| A | 12 | 194 | 6944 | 38.23 | 799 | 784 | 161.2 |
| B | 0 | 214 | 30642 | 199.73 | 801 | 782 | 149.5 |
| B | 0 | 230 | 15240 | 96.71 | 801 | 782 | 149.5 |
| B | 12 | 111 | 14916 | 94.54 | 801 | 782 | 149.5 |
| C | 9 | 68 | 196569 | 1072.12 | 788 | 795 | 182.6 |
| C | 13 | 61 | 6080 | 28.94 | 788 | 795 | 182.6 |
| C | 8 | 222 | 5572 | 26.16 | 788 | 795 | 182.6 |
| D | 13 | 105 | 330741 | 1743.94 | 781 | 759 | 189.2 |
| D | 9 | 101 | 58914 | 307.35 | 781 | 759 | 189.2 |
| D | 13 | 112 | 46292 | 240.64 | 781 | 759 | 189.2 |
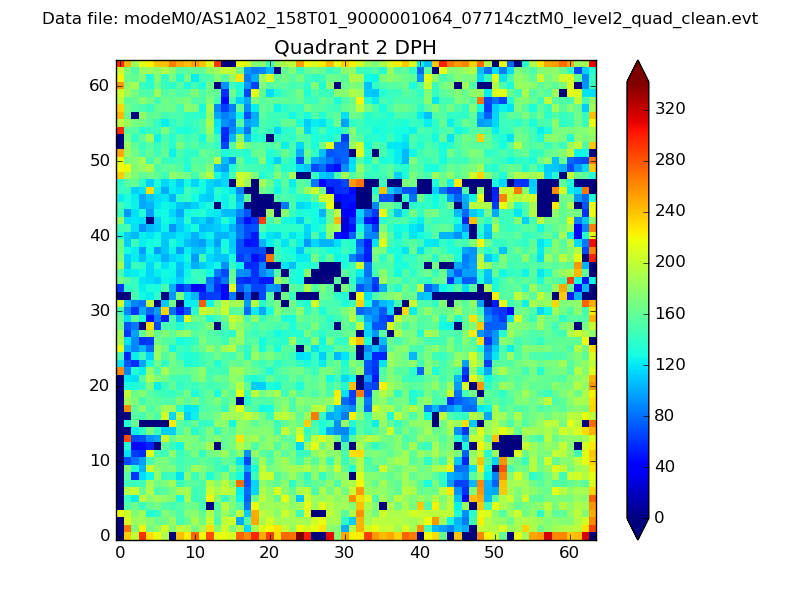
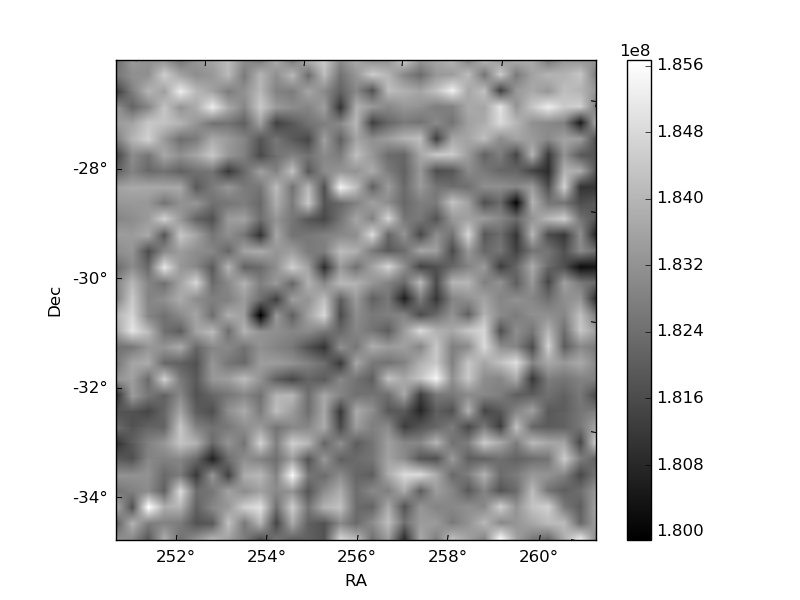
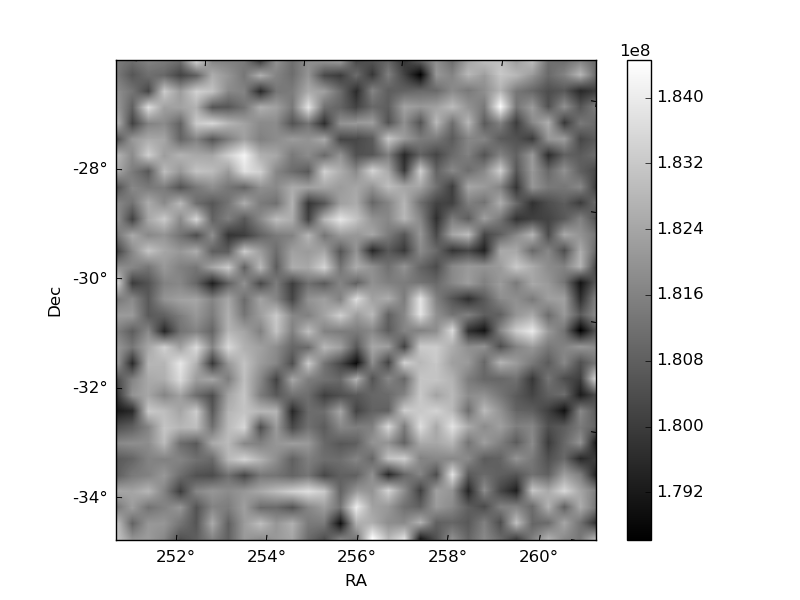
Histogram calculated using DETX and DETY for each event in the final _common_clean file
| Quadrant A | 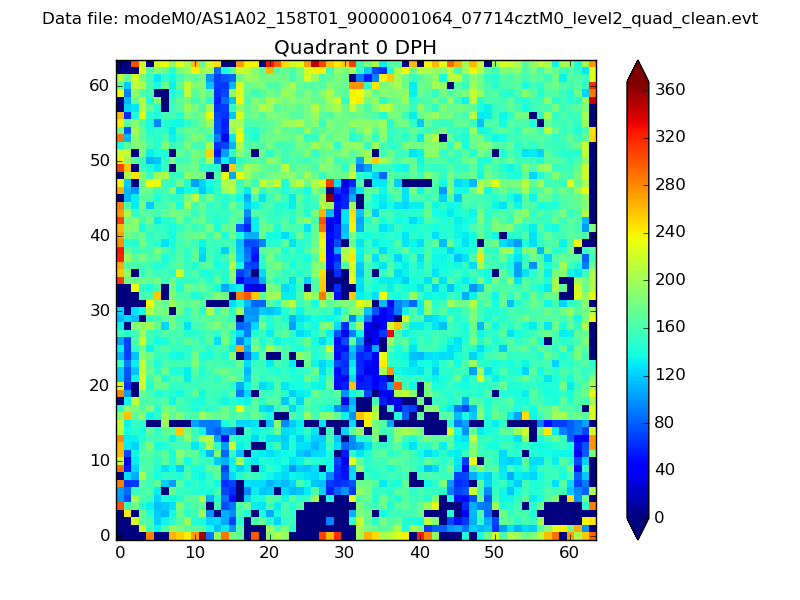 |
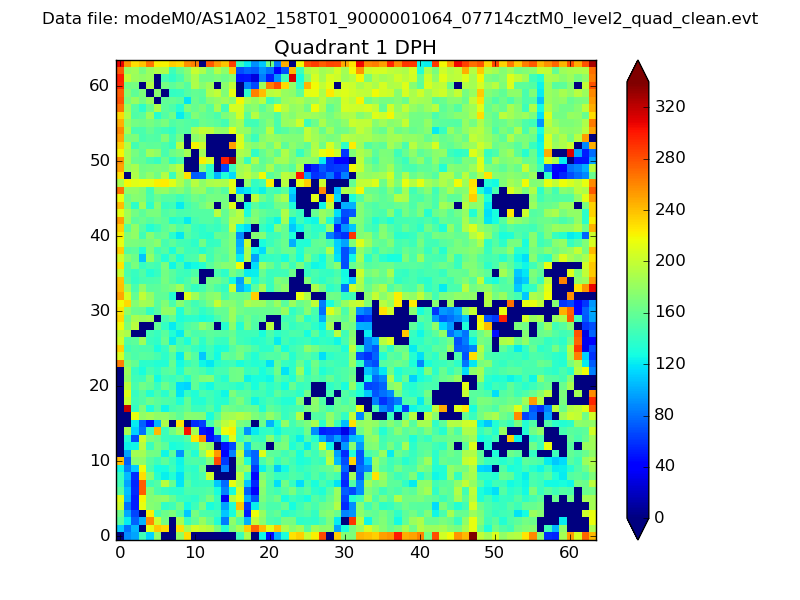 |
Quadrant B |
|---|---|---|---|
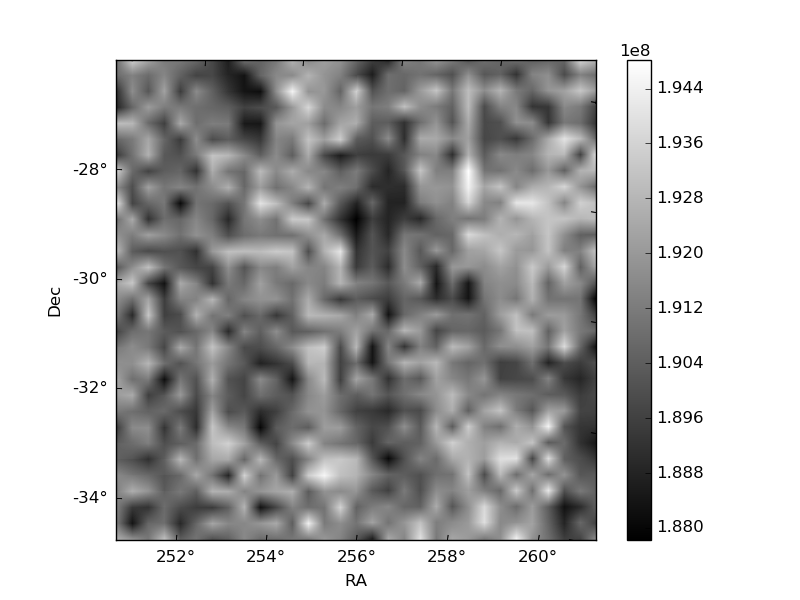
| Quadrant D | 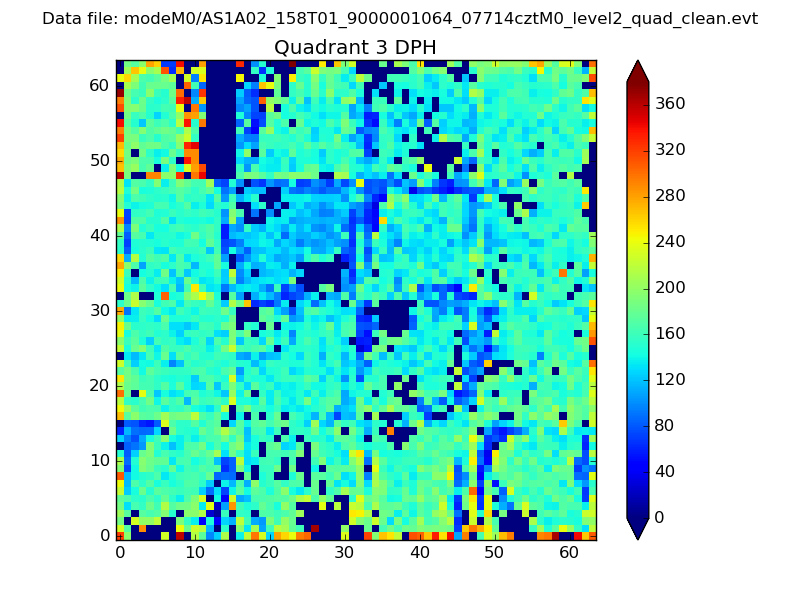 |
 |
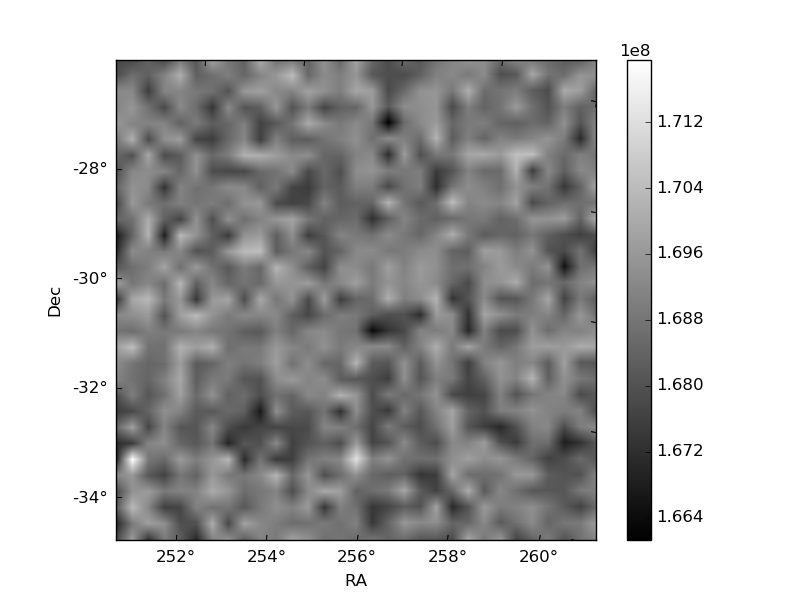
Quadrant C |
| Plot type | Count rate plots | Images |
|---|---|---|
| Comparison with Poisson distribution Blue bars denote a histogram of data divided into 1 sec bins. Red curve is a Poisson curve with rate = median count rate of data. |
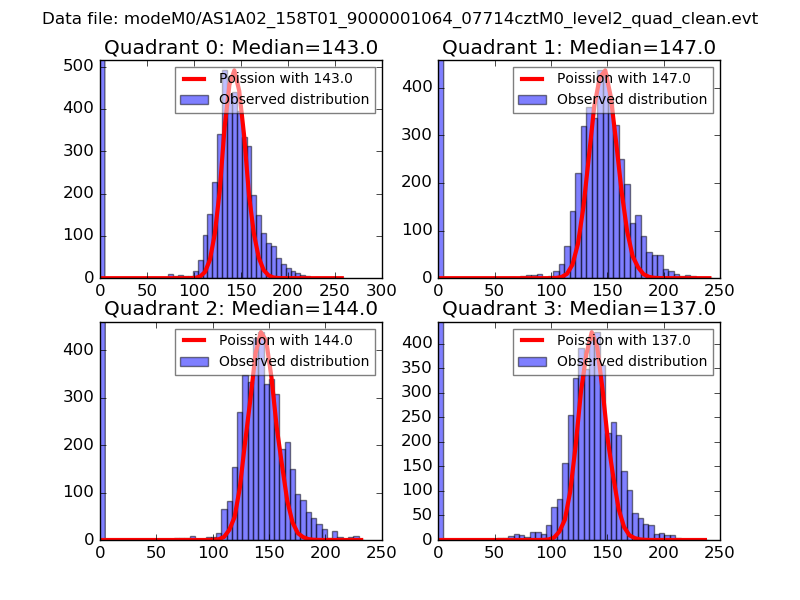 |
 |
| Quadrant-wise count rates Data is divided into 100 sec bins |
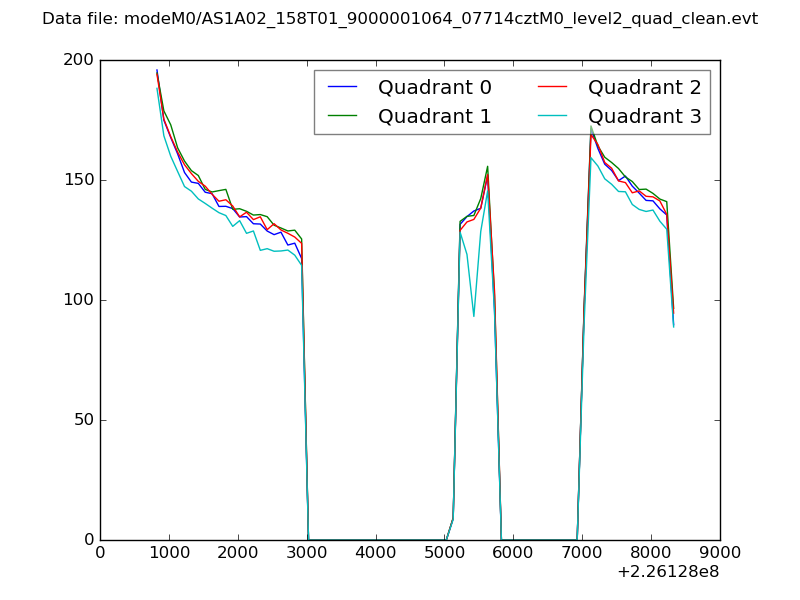 |
|
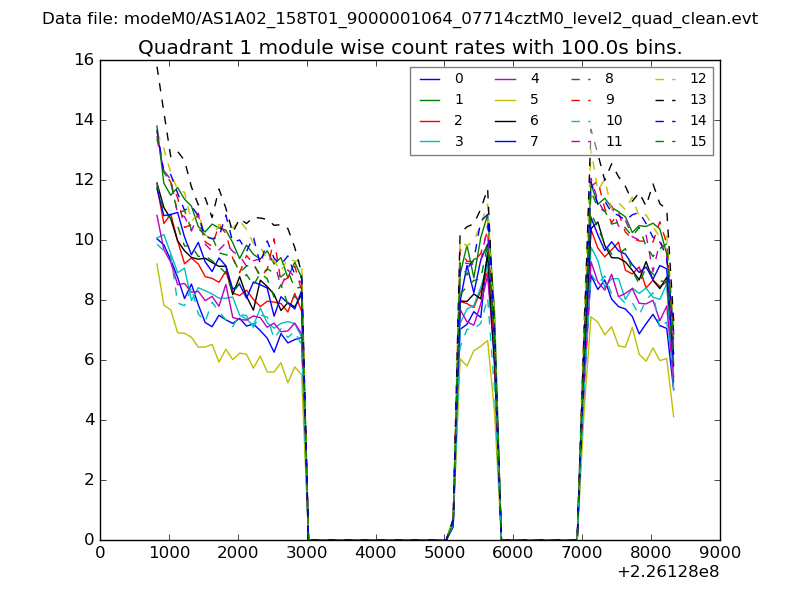
| Module-wise count rates for Quadrant A Data is divided into 100 sec bins |
 |
 |
| Module-wise count rates for Quadrant B Data is divided into 100 sec bins |
 |
 |
| Module-wise count rates for Quadrant C Data is divided into 100 sec bins |
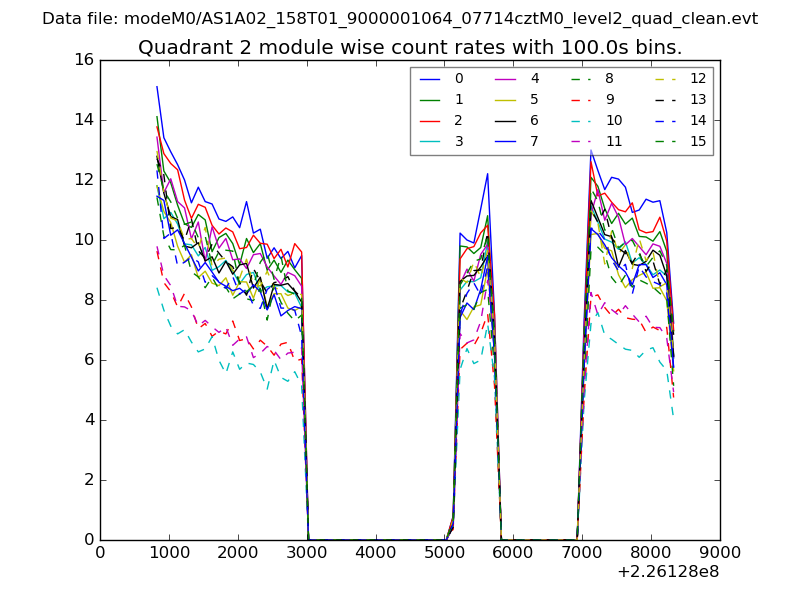 |
 |
| Module-wise count rates for Quadrant D Data is divided into 100 sec bins |
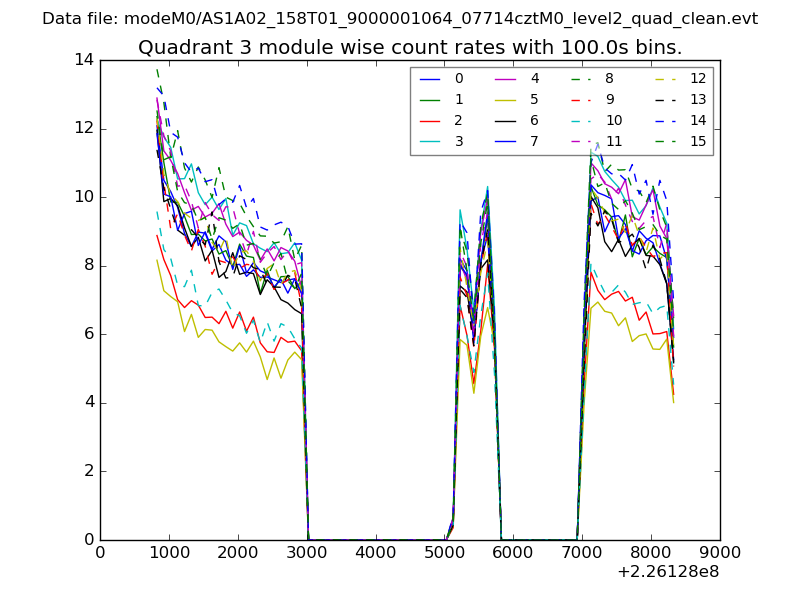 |
 |
| Parameter | Plot |
|---|---|
| CZT HV Monitor | 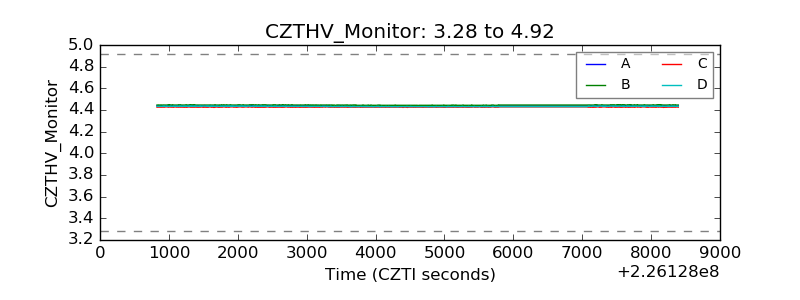 |
| D_VDD | 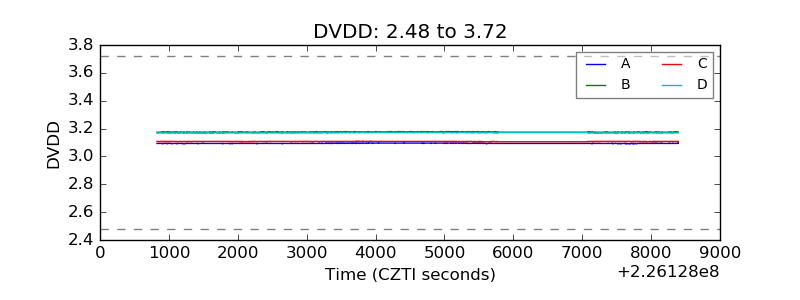 |
| Temperature 1 |  |
| Veto HV Monitor | 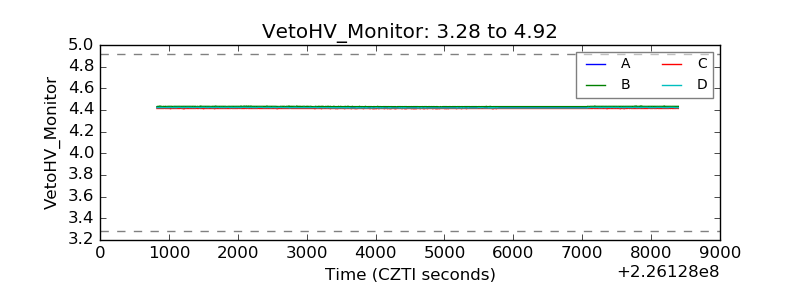 |
| Veto LLD | 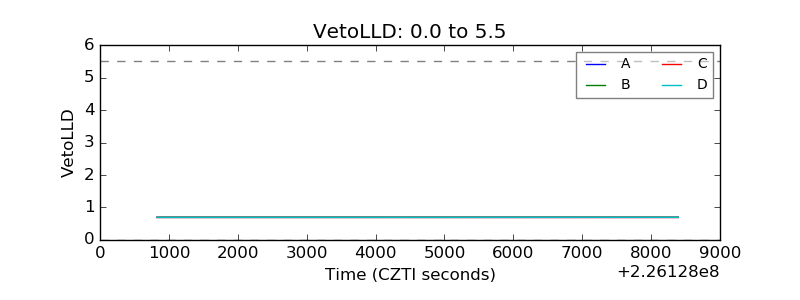 |
| Alpha Counter | 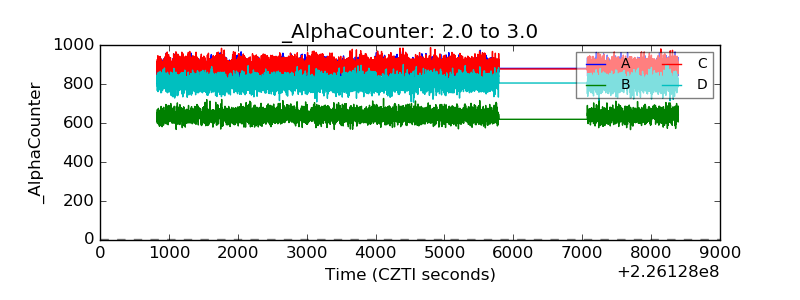 |
| _CPM_Rate | 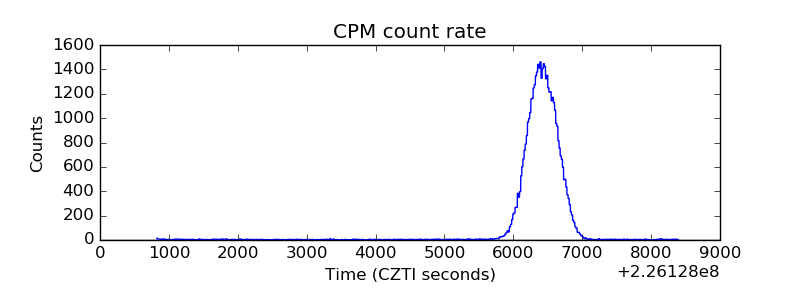 |
| CZT Counter | 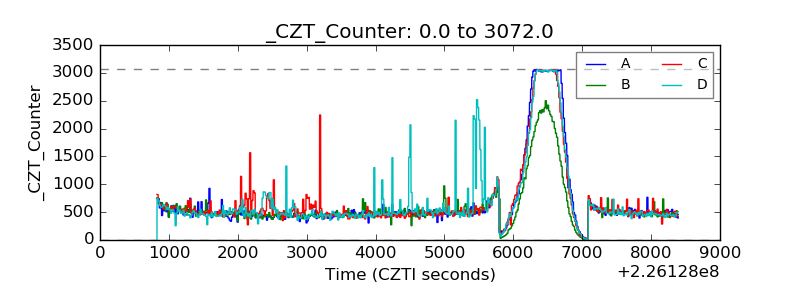 |
| +2.5 Volts monitor |  |
| +5 Volts monitor |  |
| _ROLL_ROT | 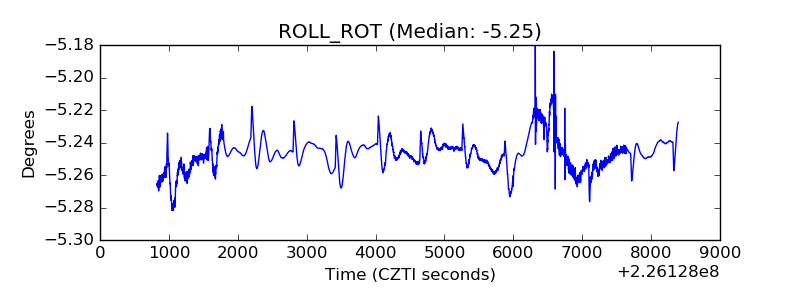 |
| _Roll_DEC | 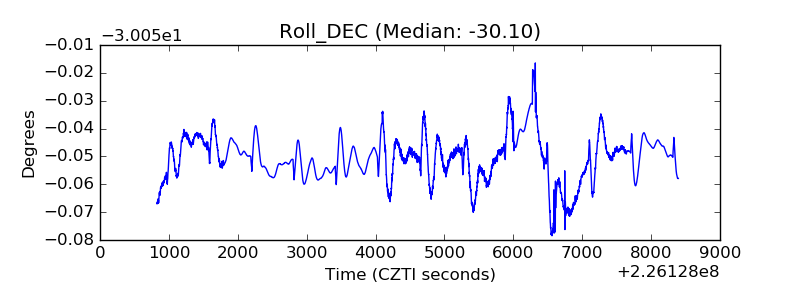 |
| _Roll_RA | 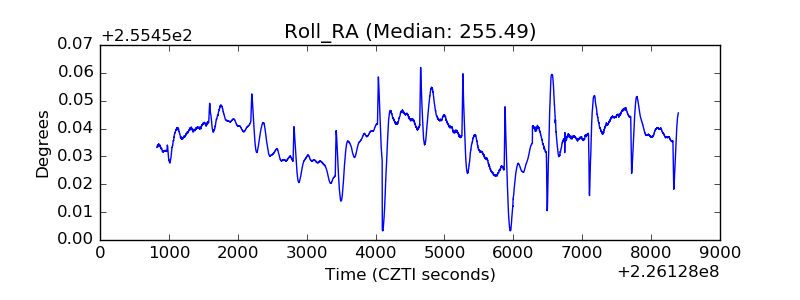 |
| Veto Counter | 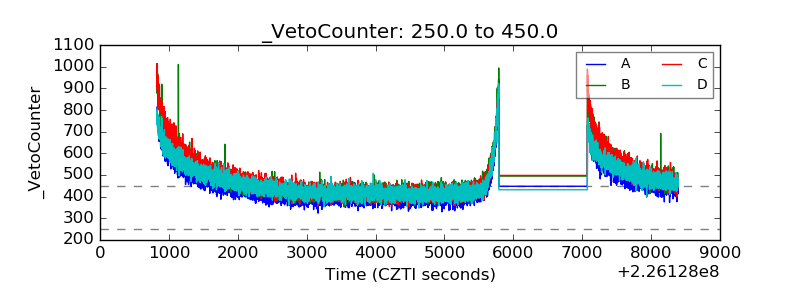 |