| Param | Original file | Final file |
|---|---|---|
| Filename | modeM0/AS1A02_158T01_9000001064_07718cztM0_level2.evt | modeM0/AS1A02_158T01_9000001064_07718cztM0_level2_quad_clean.evt |
| Size (bytes) | 296,680,320 | 36,699,840 |
| Size | 282.9 MB | 35.0 MB |
| Events in quadrant A | 1,984,381 | 208,595 |
| Events in quadrant B | 1,829,703 | 213,286 |
| Events in quadrant C | 1,695,468 | 210,590 |
| Events in quadrant D | 3,206,792 | 200,598 |
| Mode SS | |||
|---|---|---|---|
| Quadrant | BADHDUFLAG | Total packets | Discarded packets |
| A | 0 | 78 | 0 |
| B | 0 | 78 | 0 |
| C | 0 | 78 | 0 |
| D | 0 | 78 | 0 |
| Mode M0 | |||
|---|---|---|---|
| Quadrant | BADHDUFLAG | Total packets | Discarded packets |
| A | 0 | 8624 | 0 |
| B | 0 | 8021 | 0 |
| C | 0 | 7890 | 0 |
| D | 0 | 12171 | 0 |
| Quadrant | Total seconds | Saturated seconds | Saturation percentage |
|---|---|---|---|
| A | 3934 | 95 | 2.414845% |
| B | 3934 | 6 | 0.152517% |
| C | 3934 | 2 | 0.050839% |
| D | 3934 | 331 | 8.413828% |
Noise dominated data is calculated using 1-second bins in cleaned event files. If a bin has >2000 counts, and if more than 50% of those come from <1% of pixels, then it is considered to be noise-dominated and hence unusable.
| Quadrant | # 1 sec bins | Bins with >0 counts | Bins with >2000 counts | High rate bins dominated by noise | Noise dominated (total time) | Noise dominated (detector-on time) | Marked lightcurve |
|---|---|---|---|---|---|---|---|
| A | 3934 | 3934 | 71 | 71 | 1.80% | 1.80% | 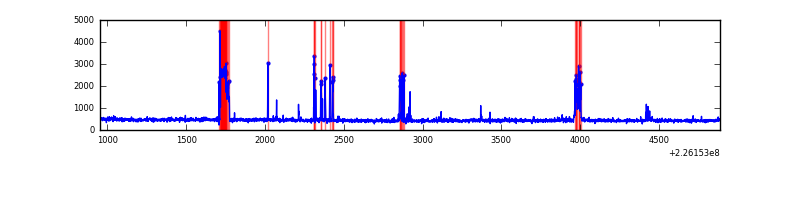 |
| B | 3934 | 3934 | 3 | 3 | 0.08% | 0.08% | 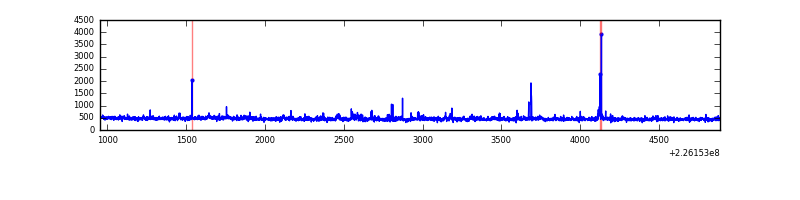 |
| C | 3934 | 3934 | 1 | 1 | 0.03% | 0.03% |  |
| D | 3934 | 3934 | 307 | 307 | 7.80% | 7.80% | 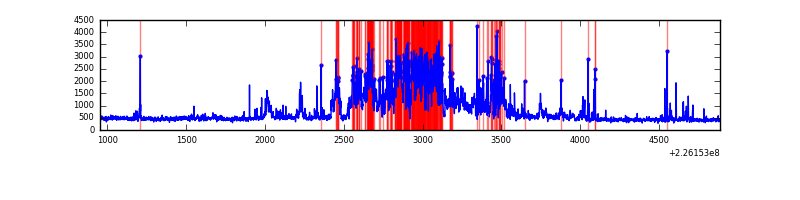 |
Top three noisy pixels from each quadrant. If the there are fewer than three noisy pixels in the level2.evt file, extra rows are filled as -1
| Pixel properties | Quadrant properties | ||||||
|---|---|---|---|---|---|---|---|
| Quadrant | DetID | PixID | Counts | Sigma | Mean | Median | Sigma |
| A | 15 | 234 | 278725 | 3062.74 | 441 | 432 | 90.9 |
| A | 3 | 1 | 5166 | 52.1 | 441 | 432 | 90.9 |
| A | 0 | 226 | 4316 | 42.75 | 441 | 432 | 90.9 |
| B | 0 | 229 | 32228 | 364.05 | 447 | 437 | 87.3 |
| B | 4 | 173 | 20255 | 226.95 | 447 | 437 | 87.3 |
| B | 4 | 239 | 16675 | 185.95 | 447 | 437 | 87.3 |
| C | 10 | 22 | 4559 | 40.67 | 432 | 434 | 101.4 |
| C | 13 | 61 | 3405 | 29.29 | 432 | 434 | 101.4 |
| C | 9 | 68 | 2843 | 23.75 | 432 | 434 | 101.4 |
| D | 1 | 239 | 1318503 | 12427.48 | 423 | 409 | 106.1 |
| D | 13 | 104 | 166687 | 1567.73 | 423 | 409 | 106.1 |
| D | 7 | 55 | 39026 | 364.1 | 423 | 409 | 106.1 |
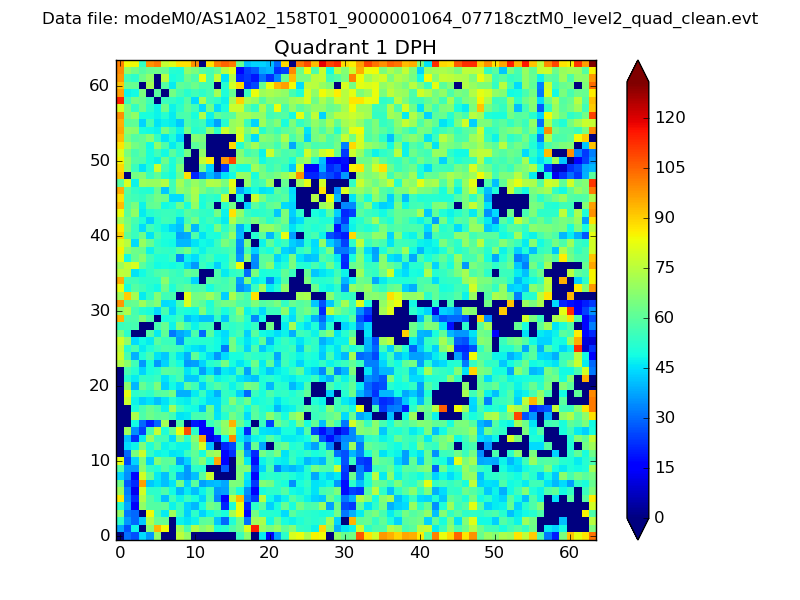
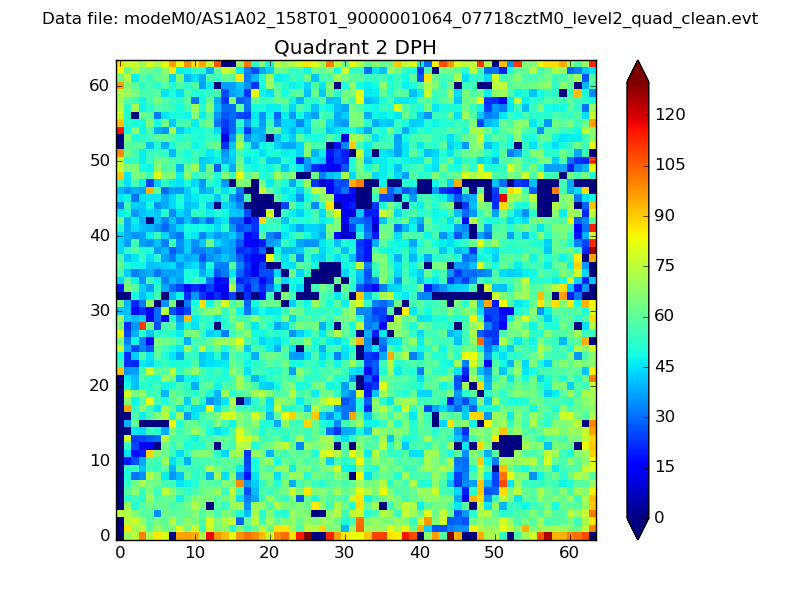
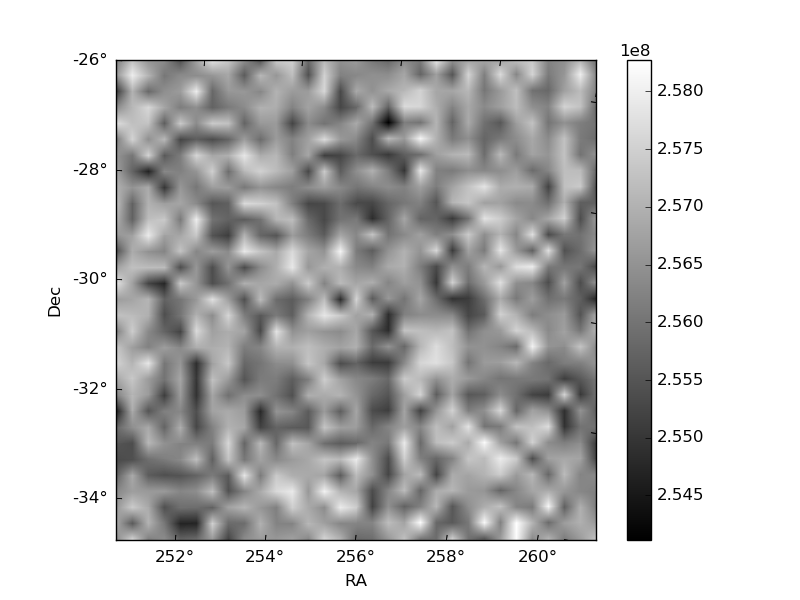
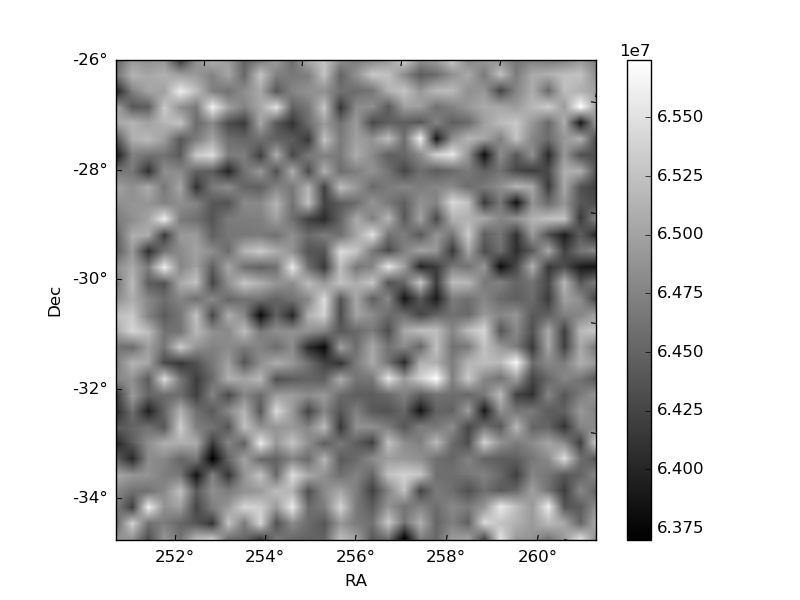
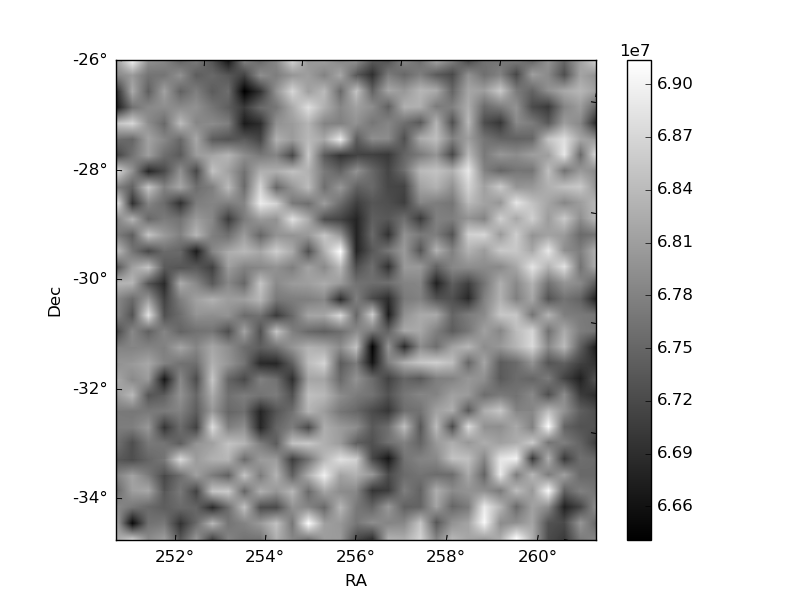
Histogram calculated using DETX and DETY for each event in the final _common_clean file
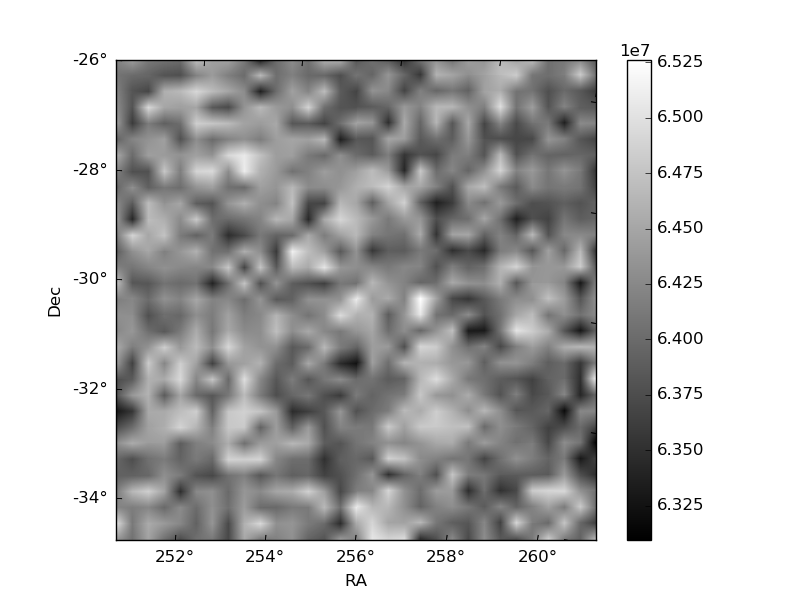
| Quadrant A | 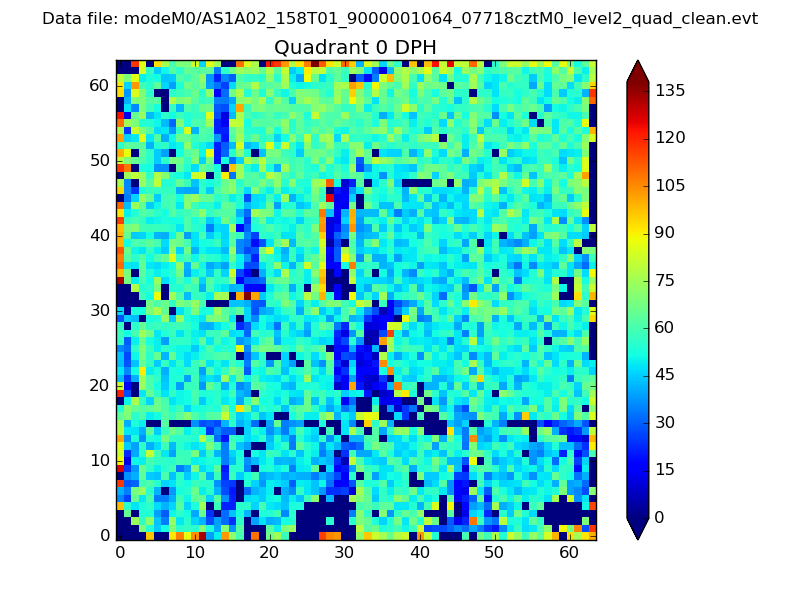 |
 |
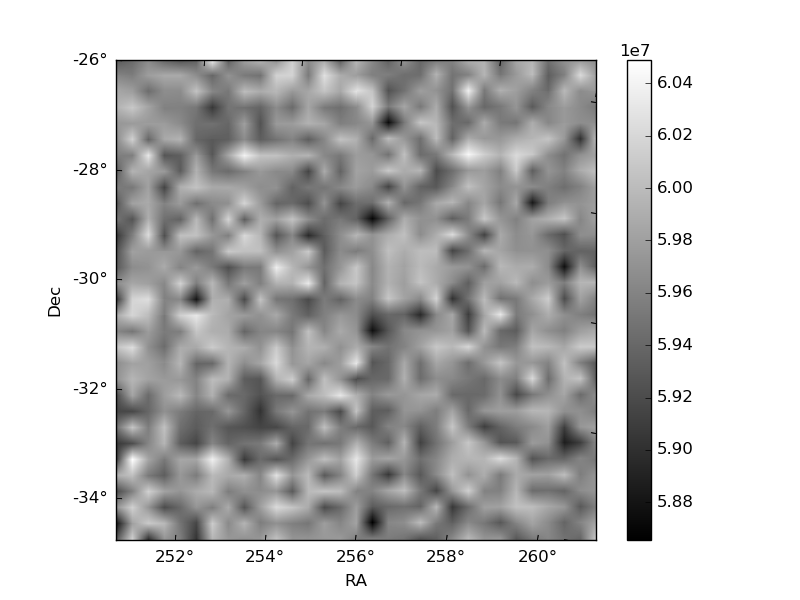
Quadrant B |
|---|---|---|---|
| Quadrant D | 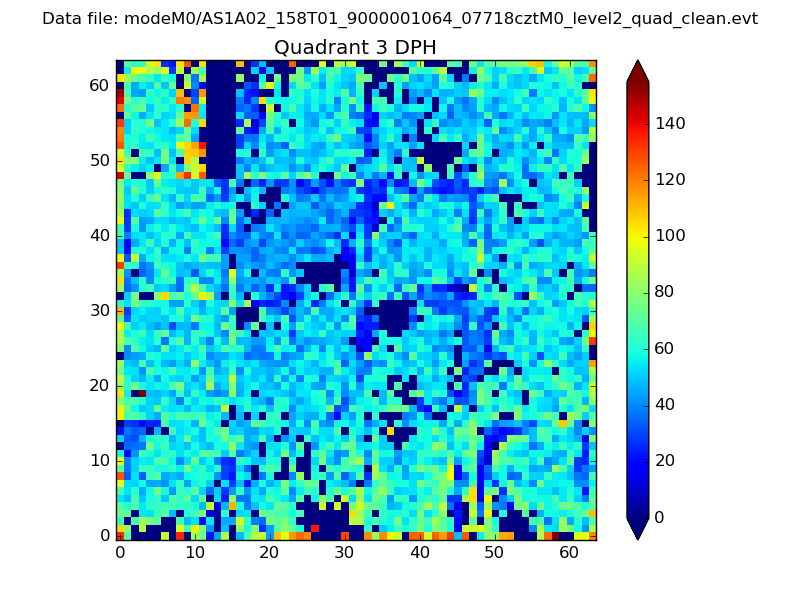 |
 |
Quadrant C |
| Plot type | Count rate plots | Images |
|---|---|---|
| Comparison with Poisson distribution Blue bars denote a histogram of data divided into 1 sec bins. Red curve is a Poisson curve with rate = median count rate of data. |
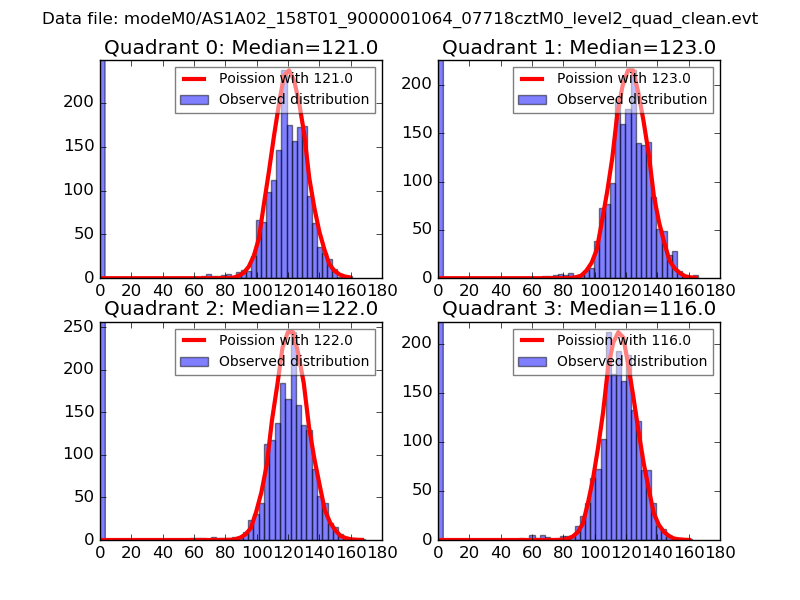 |
 |
| Quadrant-wise count rates Data is divided into 100 sec bins |
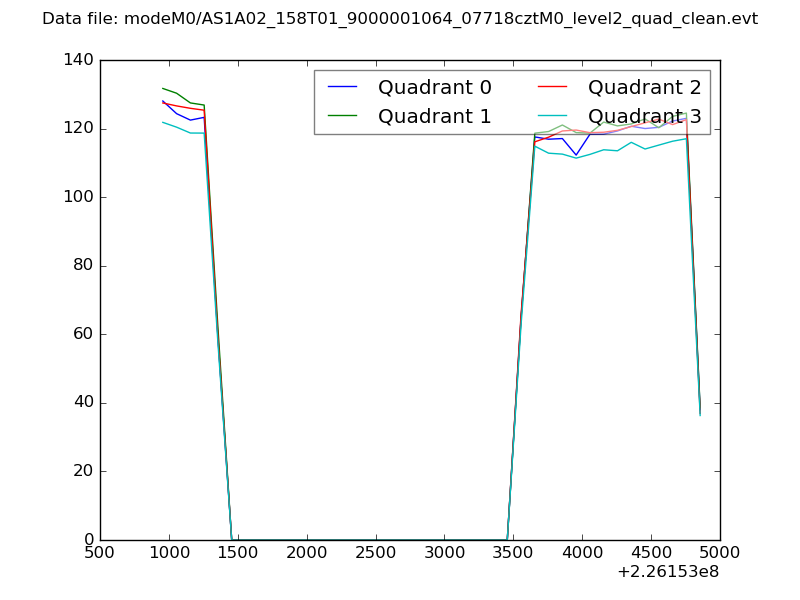 |
|
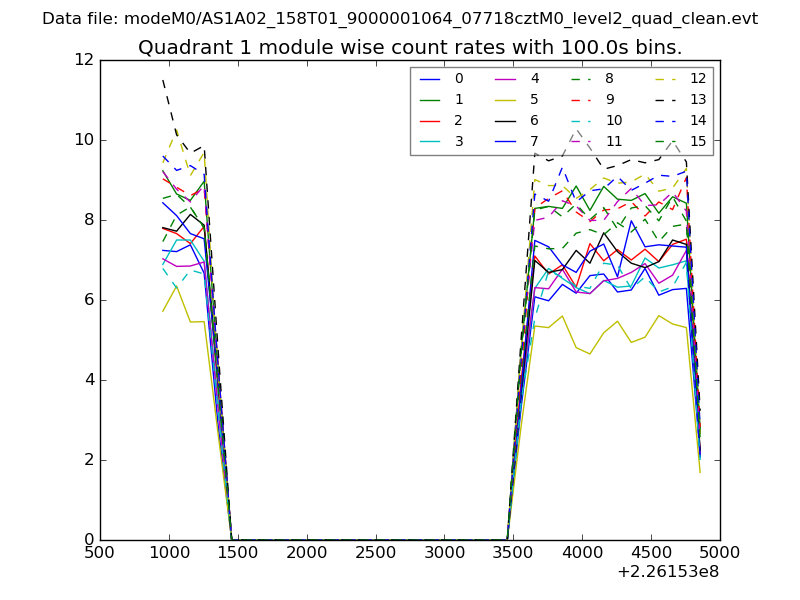
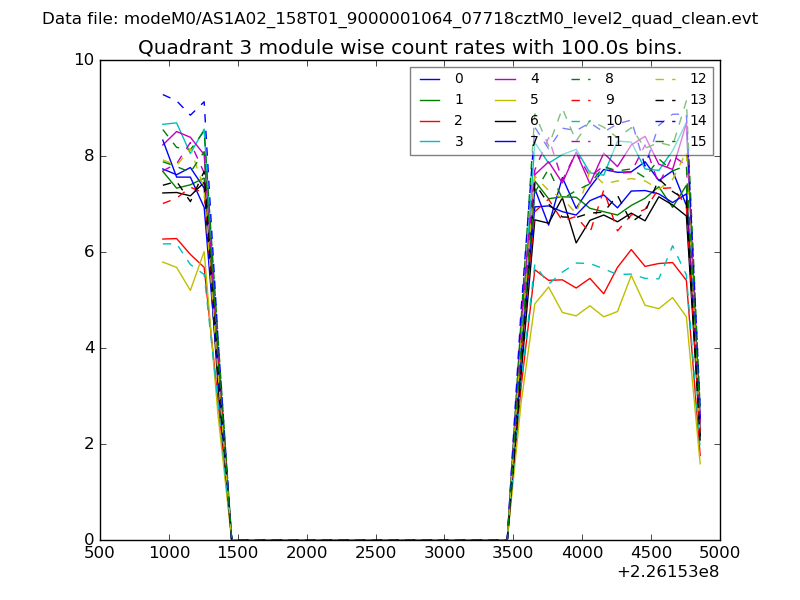
| Module-wise count rates for Quadrant A Data is divided into 100 sec bins |
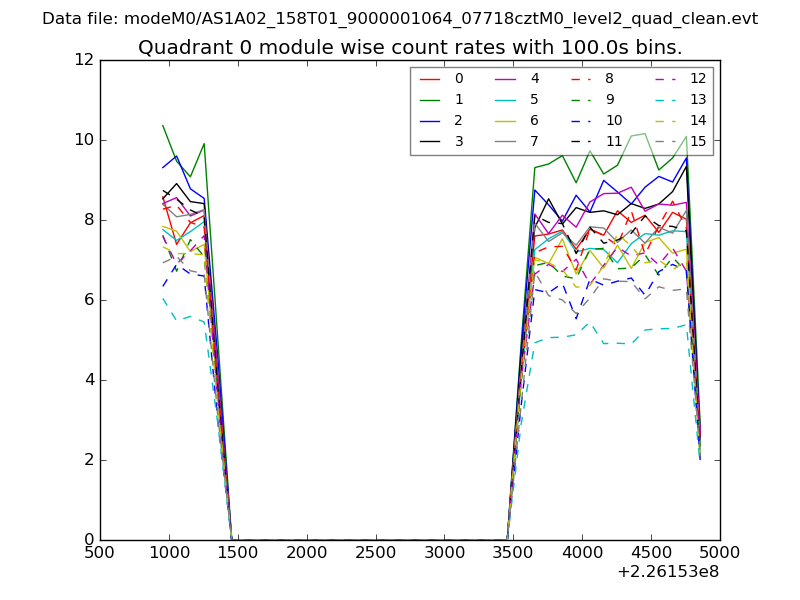 |
 |
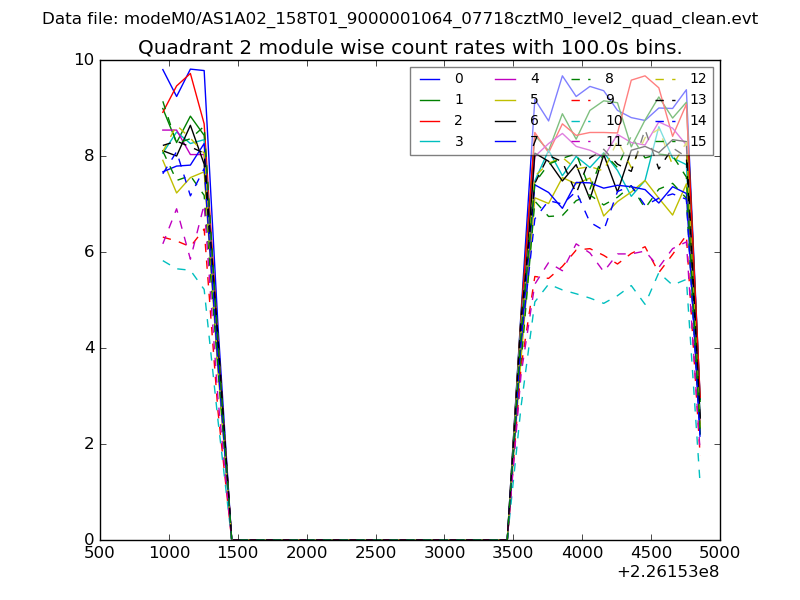
| Module-wise count rates for Quadrant B Data is divided into 100 sec bins |
 |
 |
| Module-wise count rates for Quadrant C Data is divided into 100 sec bins |
 |
 |
| Module-wise count rates for Quadrant D Data is divided into 100 sec bins |
 |
 |
| Parameter | Plot |
|---|---|
| CZT HV Monitor | 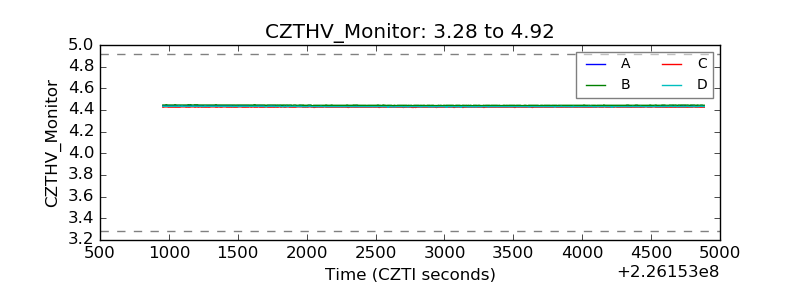 |
| D_VDD | 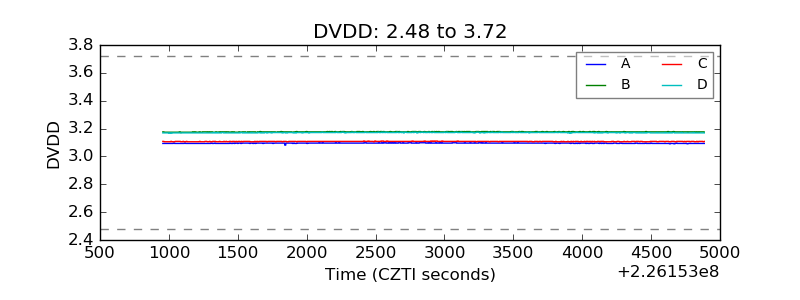 |
| Temperature 1 | 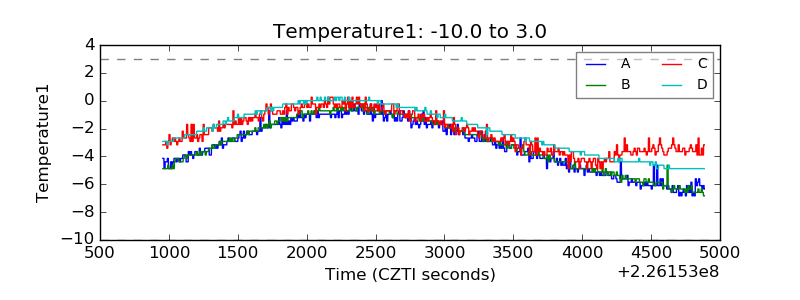 |
| Veto HV Monitor | 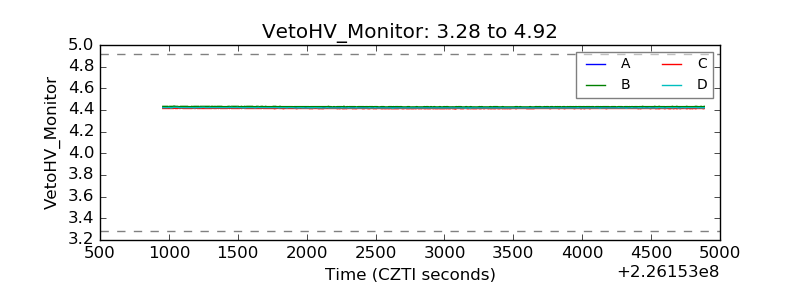 |
| Veto LLD | 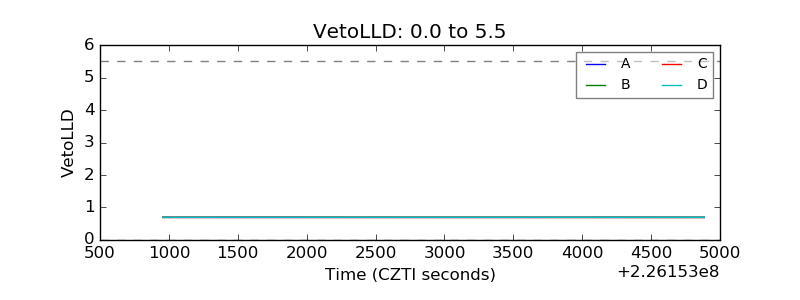 |
| Alpha Counter | 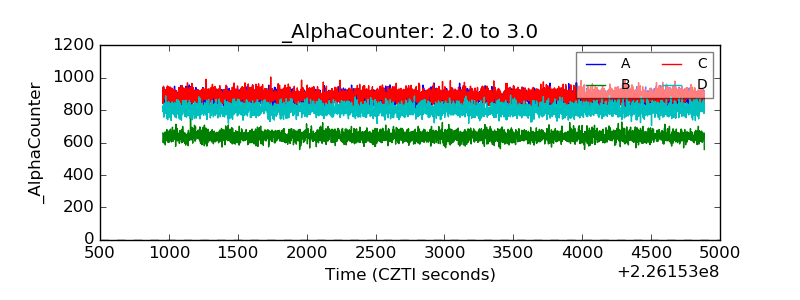 |
| _CPM_Rate | 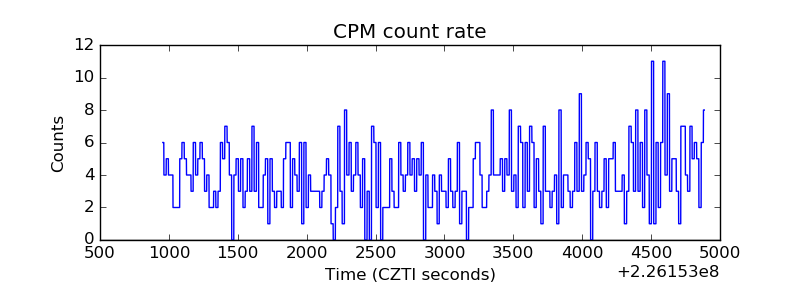 |
| CZT Counter |  |
| +2.5 Volts monitor | 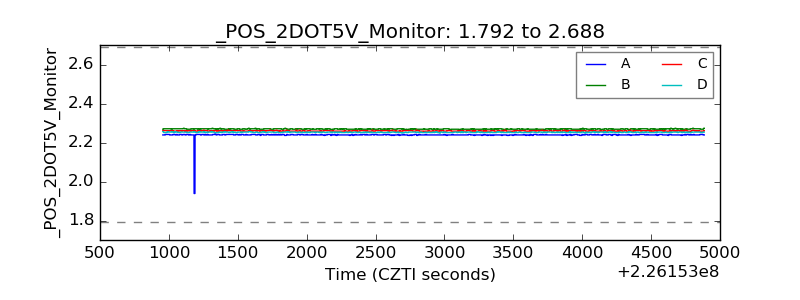 |
| +5 Volts monitor |  |
| _ROLL_ROT | 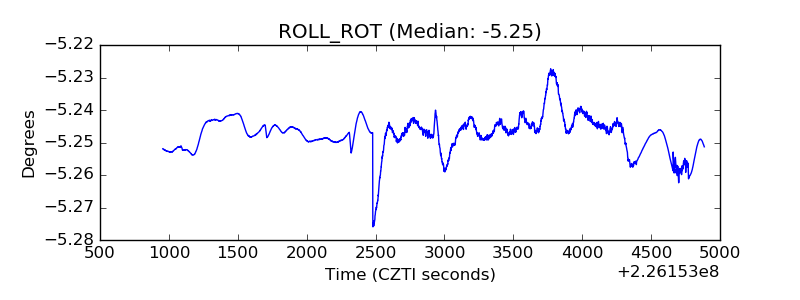 |
| _Roll_DEC | 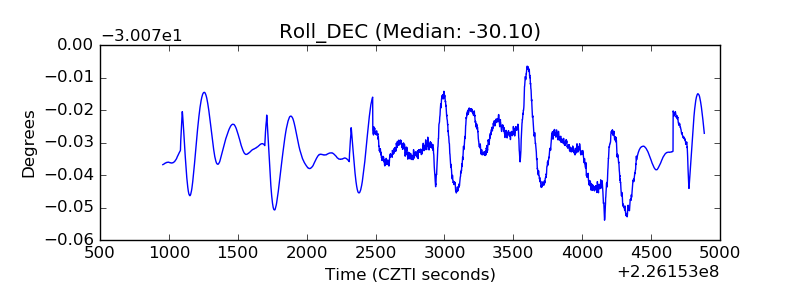 |
| _Roll_RA | 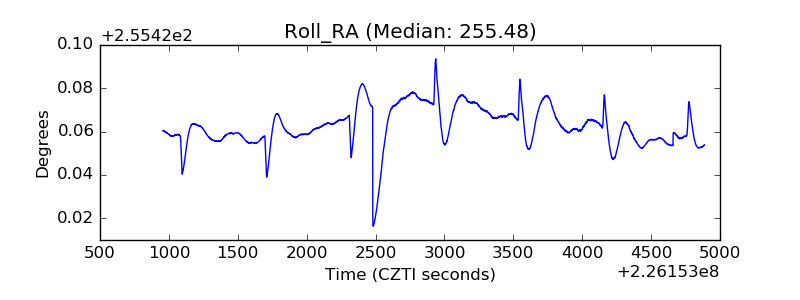 |
| Veto Counter | 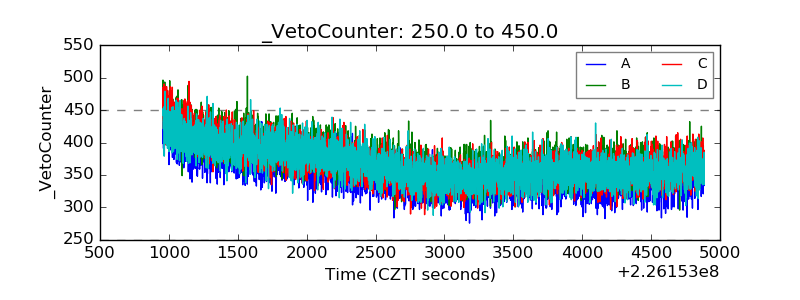 |