| Param | Original file | Final file |
|---|---|---|
| Filename | modeM0/AS1G06_064T01_9000001066_07718cztM0_level2.evt | modeM0/AS1G06_064T01_9000001066_07718cztM0_level2_quad_clean.evt |
| Size (bytes) | 230,322,240 | 36,650,880 |
| Size | 219.7 MB | 35.0 MB |
| Events in quadrant A | 1,653,409 | 223,730 |
| Events in quadrant B | 1,959,301 | 226,167 |
| Events in quadrant C | 1,565,726 | 224,138 |
| Events in quadrant D | 1,585,855 | 216,410 |
| Mode SS | |||
|---|---|---|---|
| Quadrant | BADHDUFLAG | Total packets | Discarded packets |
| A | 0 | 64 | 0 |
| B | 0 | 64 | 0 |
| C | 0 | 64 | 0 |
| D | 0 | 64 | 0 |
| Mode M0 | |||
|---|---|---|---|
| Quadrant | BADHDUFLAG | Total packets | Discarded packets |
| A | 0 | 6904 | 2 |
| B | 0 | 7745 | 1 |
| C | 0 | 6711 | 1 |
| D | 0 | 6796 | 1 |
| Mode M9 | |||
|---|---|---|---|
| Quadrant | BADHDUFLAG | Total packets | Discarded packets |
| A | 0 | 3 | 0 |
| B | 0 | 3 | 0 |
| C | 0 | 3 | 0 |
| D | 0 | 3 | 0 |
| Quadrant | Total seconds | Saturated seconds | Saturation percentage |
|---|---|---|---|
| A | 3068 | 241 | 7.855280% |
| B | 3068 | 361 | 11.766623% |
| C | 3068 | 153 | 4.986962% |
| D | 3068 | 165 | 5.378096% |
Noise dominated data is calculated using 1-second bins in cleaned event files. If a bin has >2000 counts, and if more than 50% of those come from <1% of pixels, then it is considered to be noise-dominated and hence unusable.
| Quadrant | # 1 sec bins | Bins with >0 counts | Bins with >2000 counts | High rate bins dominated by noise | Noise dominated (total time) | Noise dominated (detector-on time) | Marked lightcurve |
|---|---|---|---|---|---|---|---|
| A | 3373 | 3068 | 9 | 9 | 0.27% | 0.29% | 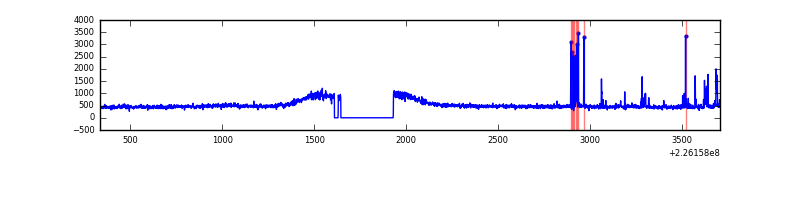 |
| B | 3373 | 3068 | 96 | 96 | 2.85% | 3.13% | 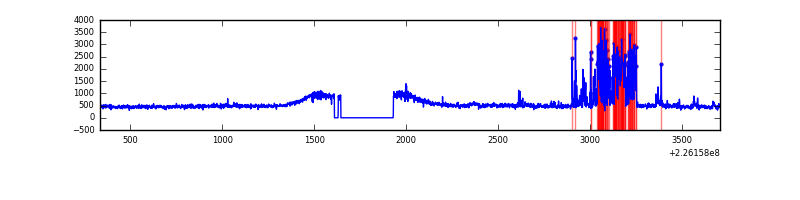 |
| C | 3373 | 3068 | 0 | 0 | 0.00% | 0.00% | 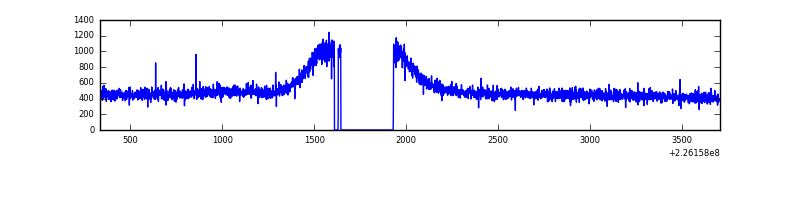 |
| D | 3373 | 3068 | 1 | 1 | 0.03% | 0.03% | 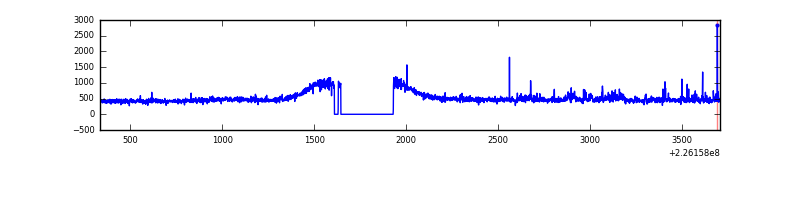 |
Top three noisy pixels from each quadrant. If the there are fewer than three noisy pixels in the level2.evt file, extra rows are filled as -1
| Pixel properties | Quadrant properties | ||||||
|---|---|---|---|---|---|---|---|
| Quadrant | DetID | PixID | Counts | Sigma | Mean | Median | Sigma |
| A | 15 | 234 | 87039 | 1010.59 | 406 | 396 | 85.7 |
| A | 0 | 23 | 4699 | 50.19 | 406 | 396 | 85.7 |
| A | 0 | 226 | 4132 | 43.58 | 406 | 396 | 85.7 |
| B | 4 | 239 | 350608 | 4339.01 | 399 | 388 | 80.7 |
| B | 0 | 219 | 16964 | 205.37 | 399 | 388 | 80.7 |
| B | 4 | 173 | 13631 | 164.07 | 399 | 388 | 80.7 |
| C | 8 | 222 | 3889 | 36.49 | 399 | 400 | 95.6 |
| C | 12 | 4 | 3556 | 33.01 | 399 | 400 | 95.6 |
| C | 13 | 61 | 3176 | 29.04 | 399 | 400 | 95.6 |
| D | 2 | 152 | 39949 | 389.44 | 403 | 389 | 101.6 |
| D | 13 | 104 | 14317 | 137.11 | 403 | 389 | 101.6 |
| D | 2 | 234 | 5166 | 47.03 | 403 | 389 | 101.6 |
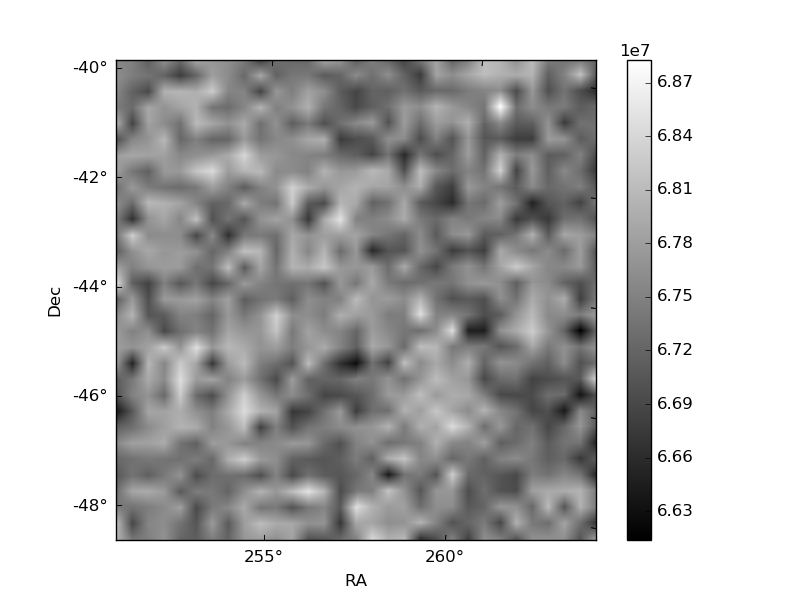
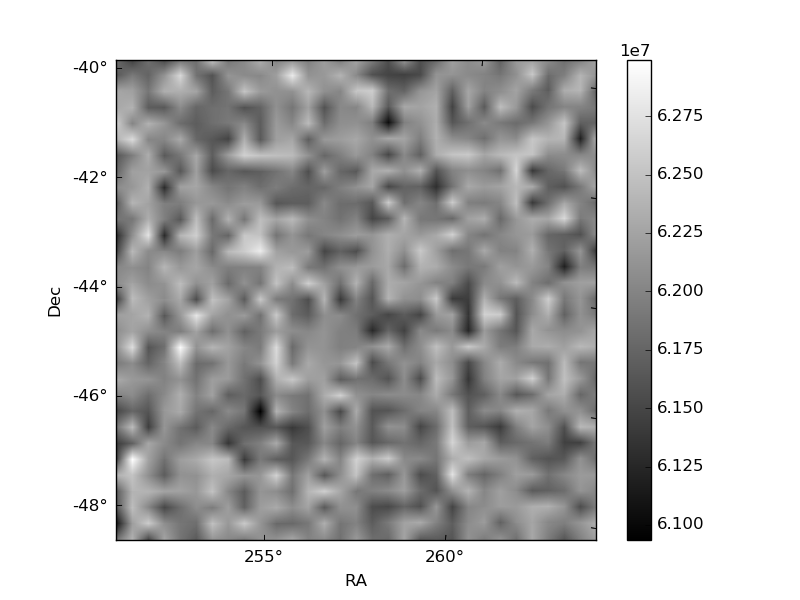
Histogram calculated using DETX and DETY for each event in the final _common_clean file
| Quadrant A |  |
 |
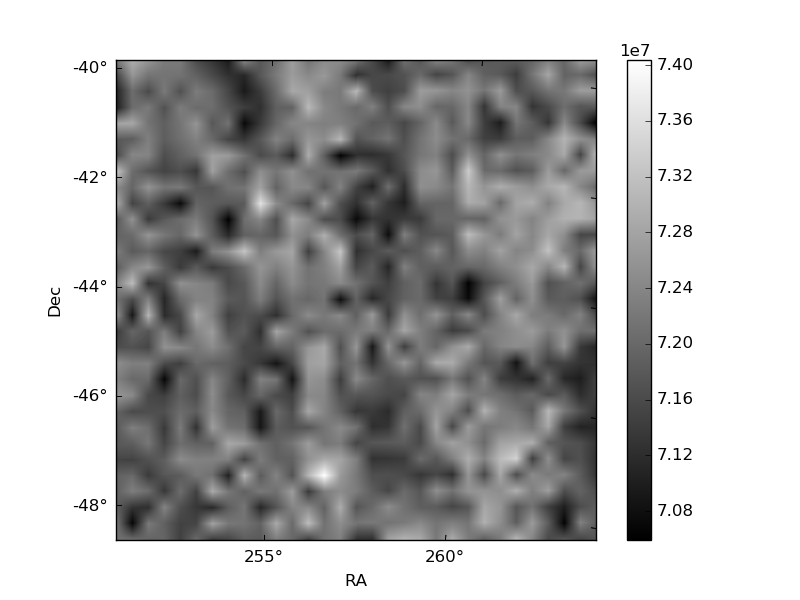
Quadrant B |
|---|---|---|---|
| Quadrant D | 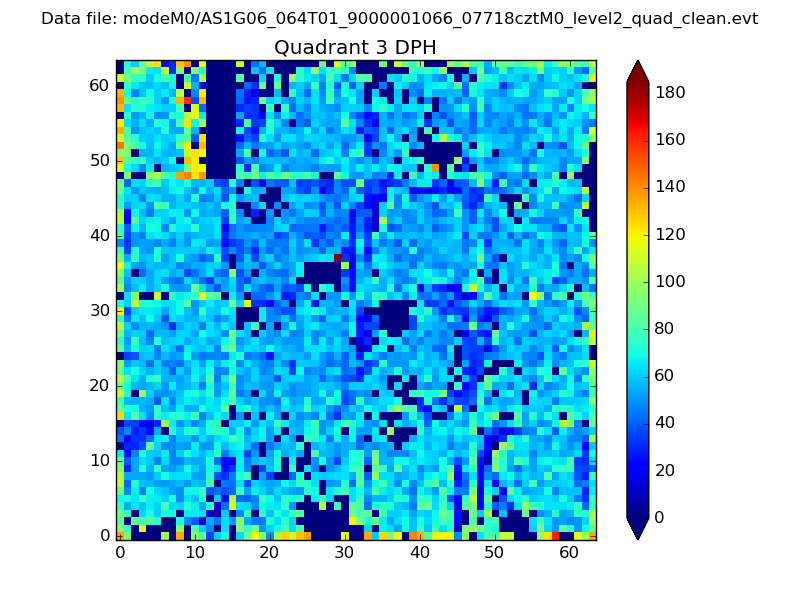 |
 |
Quadrant C |
| Plot type | Count rate plots | Images |
|---|---|---|
| Comparison with Poisson distribution Blue bars denote a histogram of data divided into 1 sec bins. Red curve is a Poisson curve with rate = median count rate of data. |
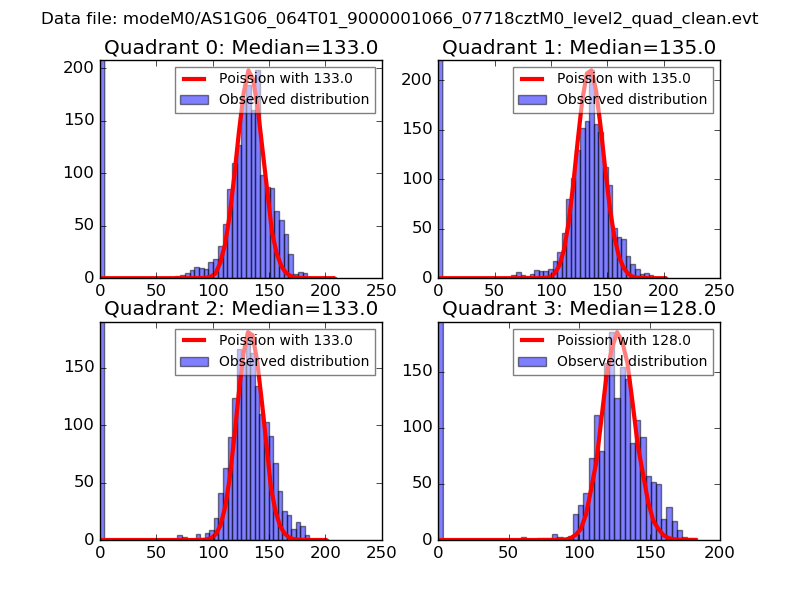 |
 |
| Quadrant-wise count rates Data is divided into 100 sec bins |
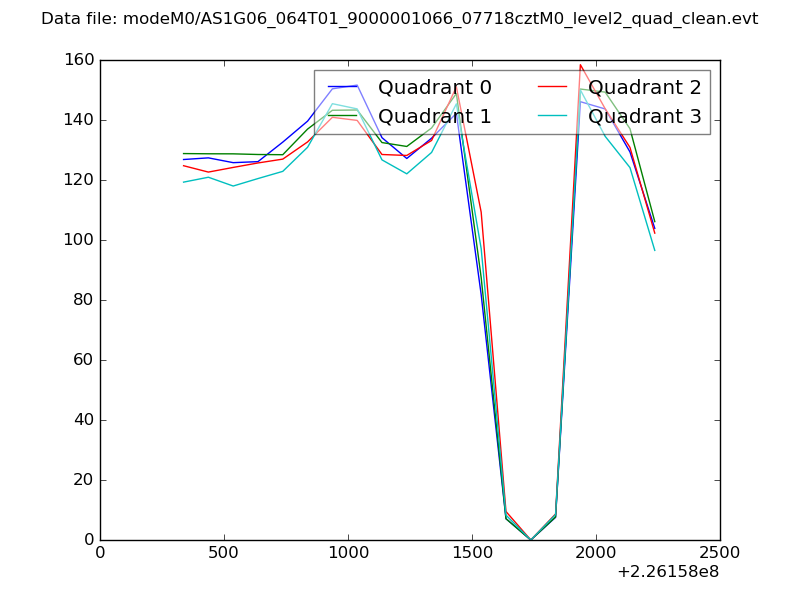 |
|
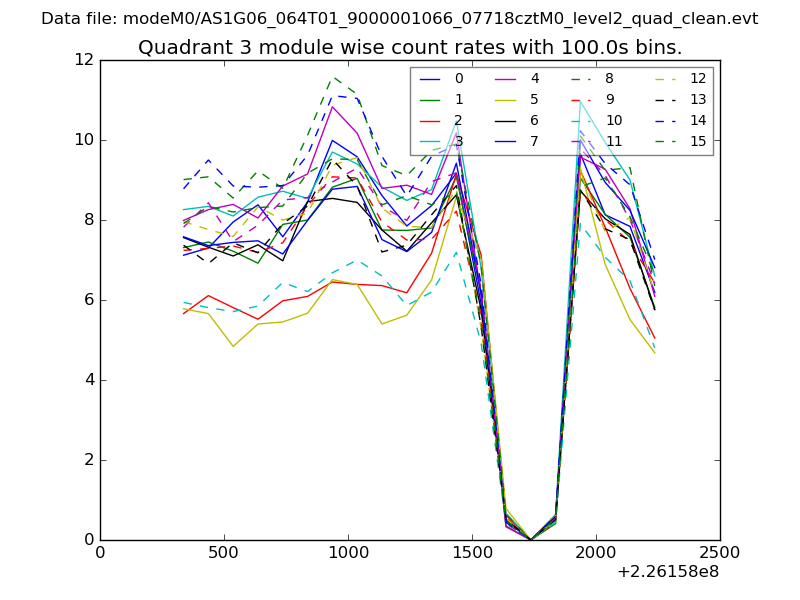
| Module-wise count rates for Quadrant A Data is divided into 100 sec bins |
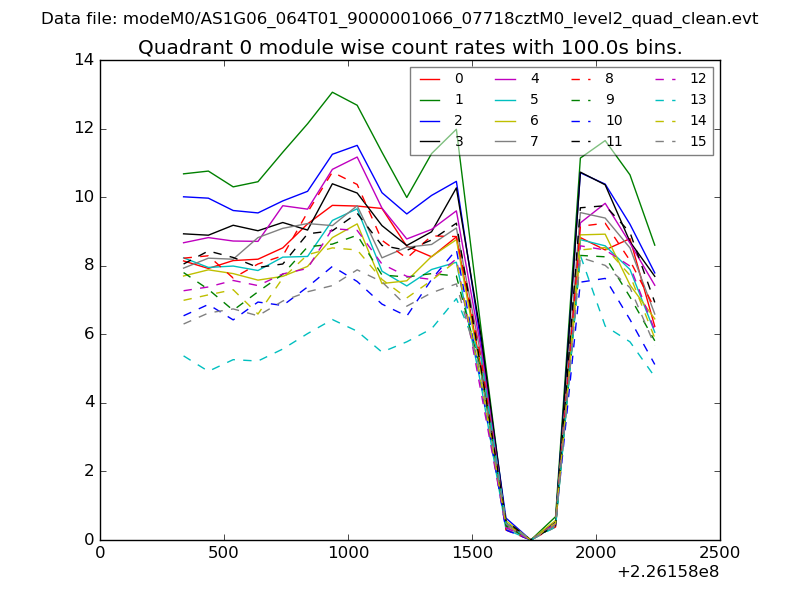 |
 |
| Module-wise count rates for Quadrant B Data is divided into 100 sec bins |
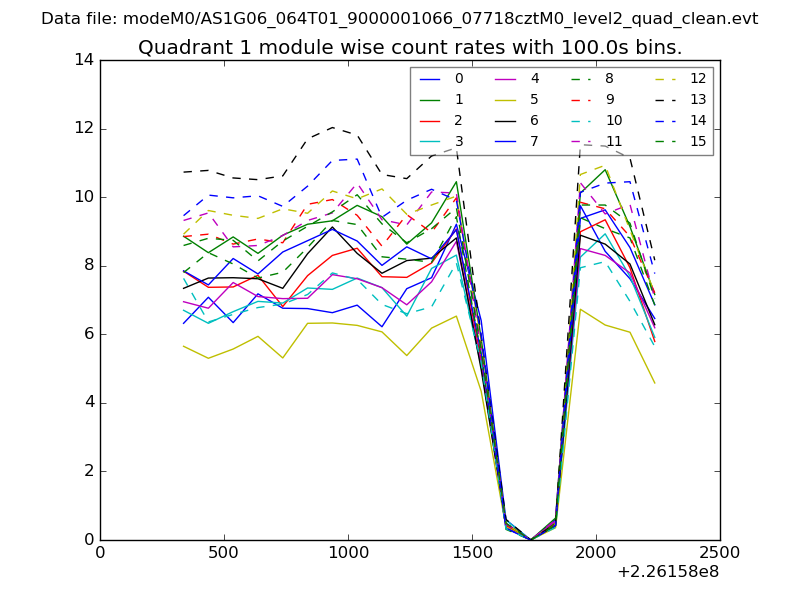 |
 |
| Module-wise count rates for Quadrant C Data is divided into 100 sec bins |
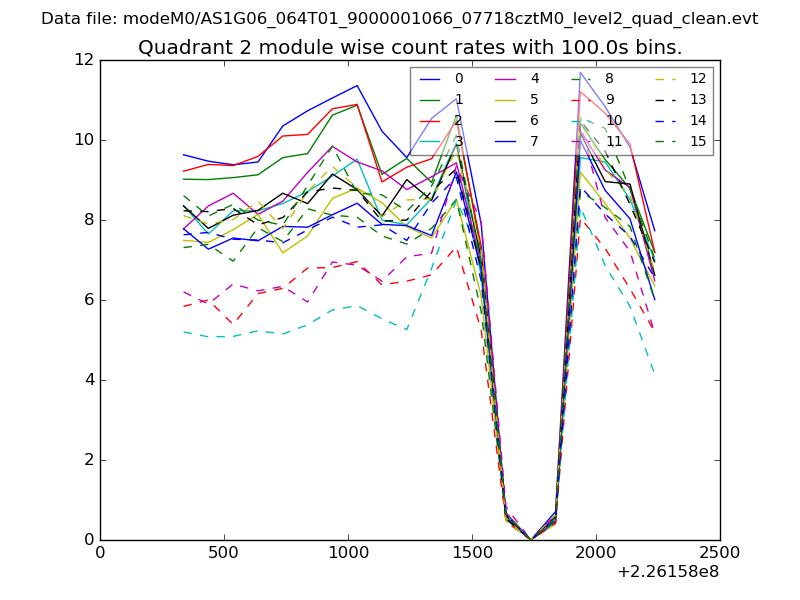 |
 |
| Module-wise count rates for Quadrant D Data is divided into 100 sec bins |
 |
 |
| Parameter | Plot |
|---|---|
| CZT HV Monitor |  |
| D_VDD | 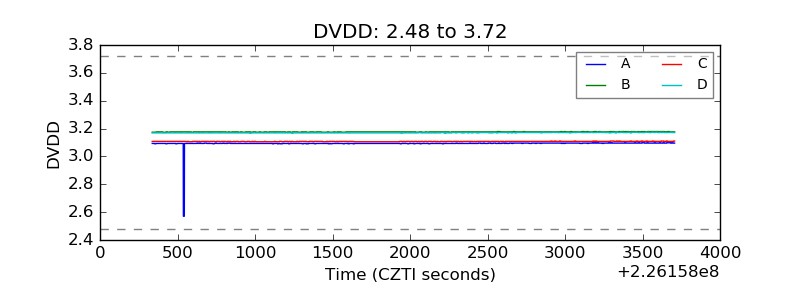 |
| Temperature 1 | 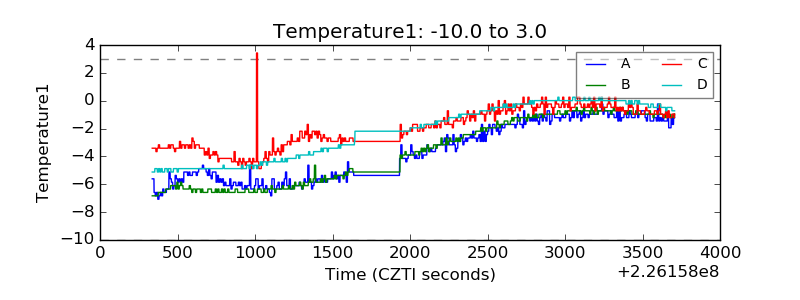 |
| Veto HV Monitor | 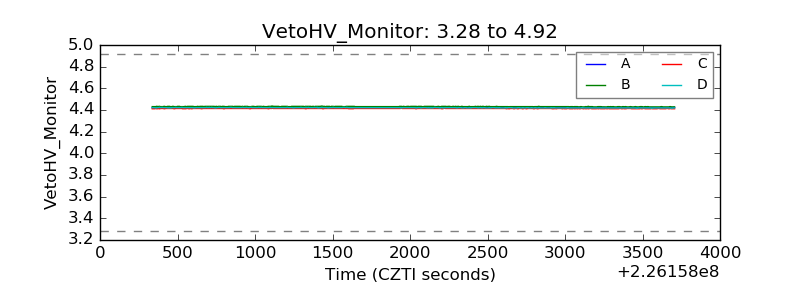 |
| Veto LLD | 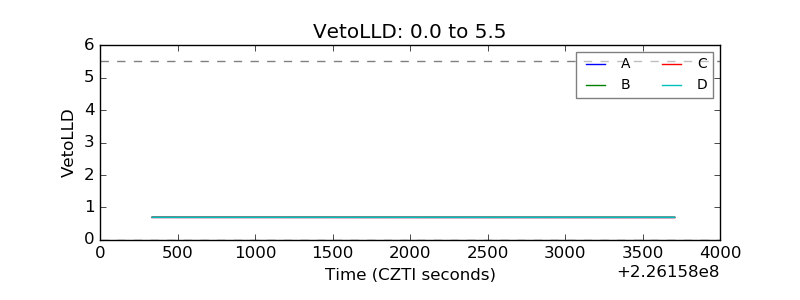 |
| Alpha Counter | 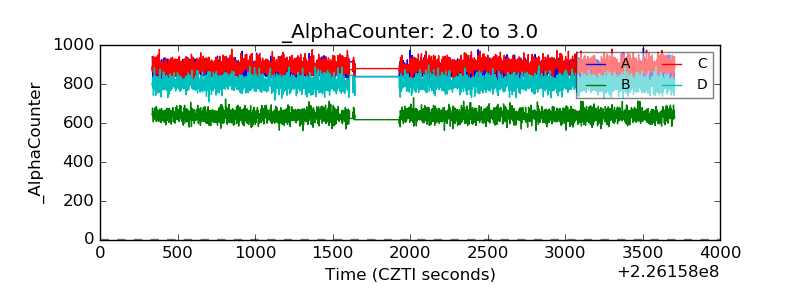 |
| _CPM_Rate | 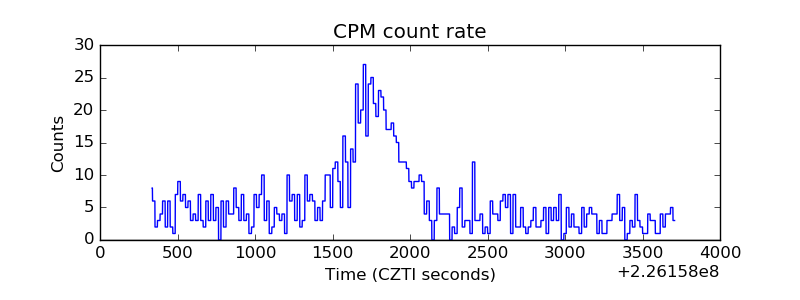 |
| CZT Counter | 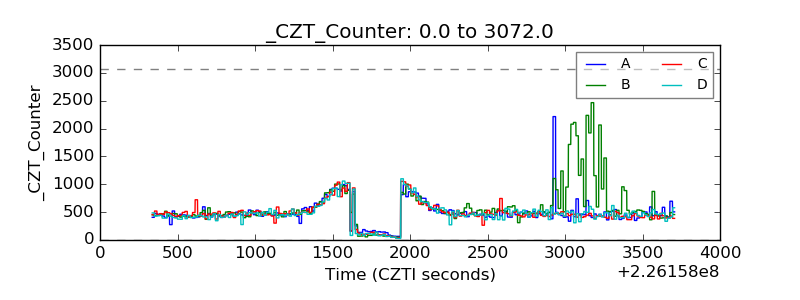 |
| +2.5 Volts monitor |  |
| +5 Volts monitor | 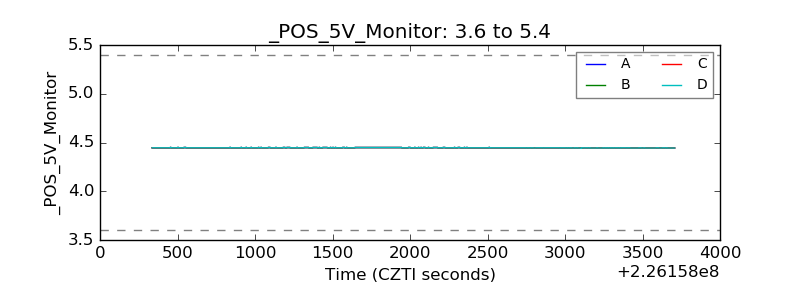 |
| _ROLL_ROT | 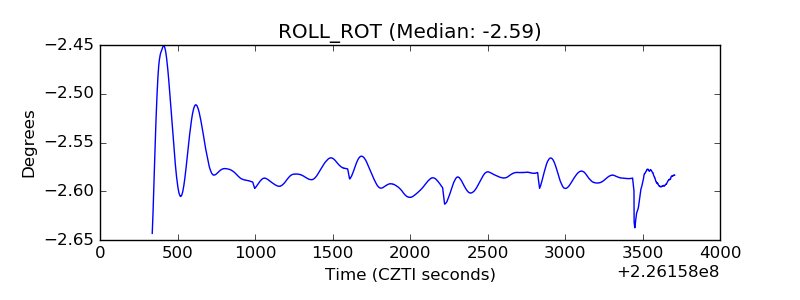 |
| _Roll_DEC | 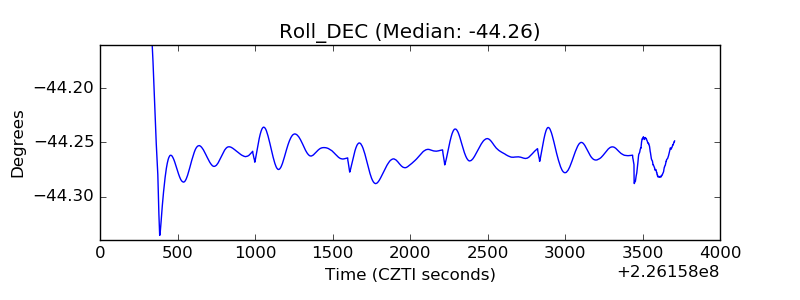 |
| _Roll_RA | 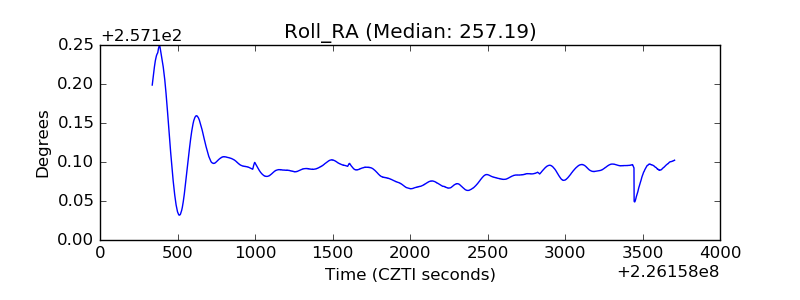 |
| Veto Counter | 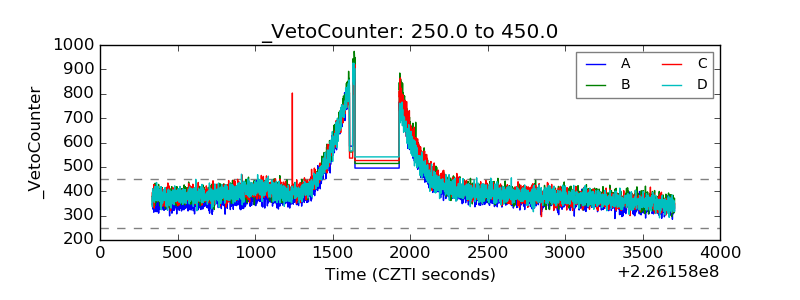 |