| Param | Original file | Final file |
|---|---|---|
| Filename | modeM0/AS1G06_064T01_9000001066_07719cztM0_level2.evt | modeM0/AS1G06_064T01_9000001066_07719cztM0_level2_quad_clean.evt |
| Size (bytes) | 525,378,240 | 78,744,960 |
| Size | 501.0 MB | 75.1 MB |
| Events in quadrant A | 3,739,316 | 469,632 |
| Events in quadrant B | 4,372,042 | 473,373 |
| Events in quadrant C | 3,520,319 | 464,113 |
| Events in quadrant D | 3,759,689 | 445,132 |
| Mode SS | |||
|---|---|---|---|
| Quadrant | BADHDUFLAG | Total packets | Discarded packets |
| A | 0 | 152 | 0 |
| B | 0 | 152 | 0 |
| C | 0 | 152 | 0 |
| D | 0 | 152 | 0 |
| Mode M0 | |||
|---|---|---|---|
| Quadrant | BADHDUFLAG | Total packets | Discarded packets |
| A | 0 | 16378 | 2 |
| B | 0 | 18040 | 1 |
| C | 0 | 15971 | 1 |
| D | 0 | 16612 | 1 |
| Quadrant | Total seconds | Saturated seconds | Saturation percentage |
|---|---|---|---|
| A | 7650 | 287 | 3.751634% |
| B | 7650 | 535 | 6.993464% |
| C | 7650 | 135 | 1.764706% |
| D | 7650 | 165 | 2.156863% |
Noise dominated data is calculated using 1-second bins in cleaned event files. If a bin has >2000 counts, and if more than 50% of those come from <1% of pixels, then it is considered to be noise-dominated and hence unusable.
| Quadrant | # 1 sec bins | Bins with >0 counts | Bins with >2000 counts | High rate bins dominated by noise | Noise dominated (total time) | Noise dominated (detector-on time) | Marked lightcurve |
|---|---|---|---|---|---|---|---|
| A | 7670 | 7651 | 15 | 15 | 0.20% | 0.20% | 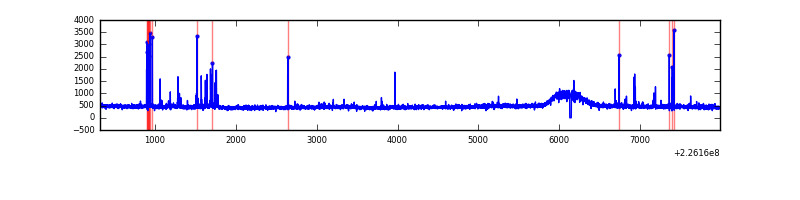 |
| B | 7670 | 7651 | 180 | 180 | 2.35% | 2.35% | 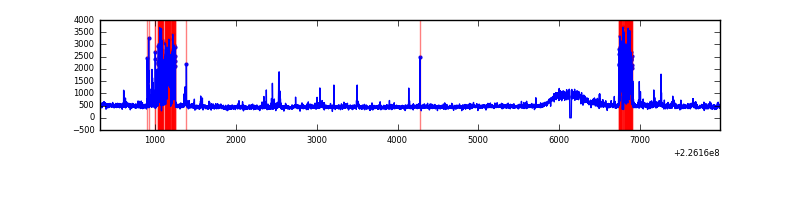 |
| C | 7670 | 7651 | 0 | 0 | 0.00% | 0.00% | 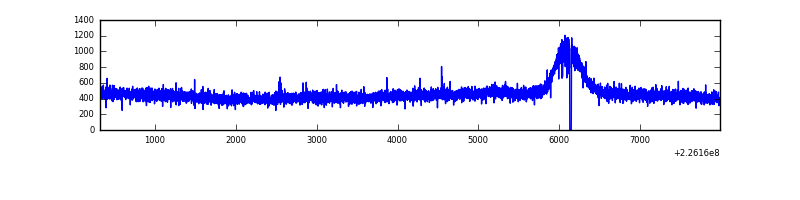 |
| D | 7670 | 7651 | 30 | 30 | 0.39% | 0.39% | 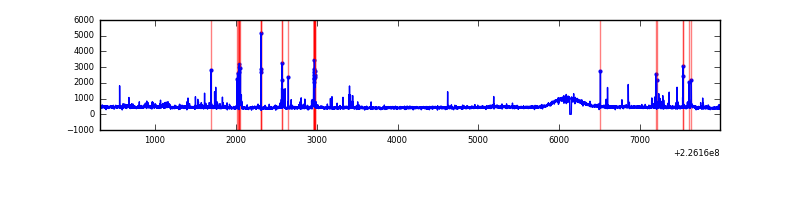 |
Top three noisy pixels from each quadrant. If the there are fewer than three noisy pixels in the level2.evt file, extra rows are filled as -1
| Pixel properties | Quadrant properties | ||||||
|---|---|---|---|---|---|---|---|
| Quadrant | DetID | PixID | Counts | Sigma | Mean | Median | Sigma |
| A | 15 | 234 | 151835 | 787.84 | 926 | 905 | 191.6 |
| A | 3 | 1 | 15876 | 78.15 | 926 | 905 | 191.6 |
| A | 0 | 226 | 8759 | 41.0 | 926 | 905 | 191.6 |
| B | 4 | 239 | 630864 | 3551.75 | 915 | 894 | 177.4 |
| B | 0 | 229 | 55668 | 308.81 | 915 | 894 | 177.4 |
| B | 0 | 219 | 54496 | 302.2 | 915 | 894 | 177.4 |
| C | 13 | 61 | 7061 | 29.22 | 901 | 904 | 210.7 |
| C | 8 | 222 | 4595 | 17.52 | 901 | 904 | 210.7 |
| C | 12 | 4 | 4486 | 17.0 | 901 | 904 | 210.7 |
| D | 13 | 104 | 169654 | 747.35 | 906 | 877 | 225.8 |
| D | 2 | 152 | 73589 | 321.97 | 906 | 877 | 225.8 |
| D | 7 | 55 | 32716 | 140.98 | 906 | 877 | 225.8 |
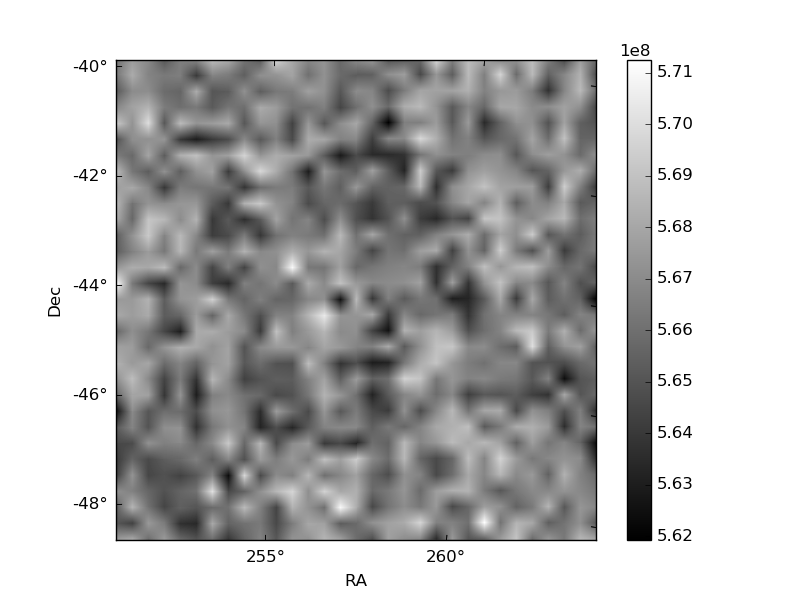
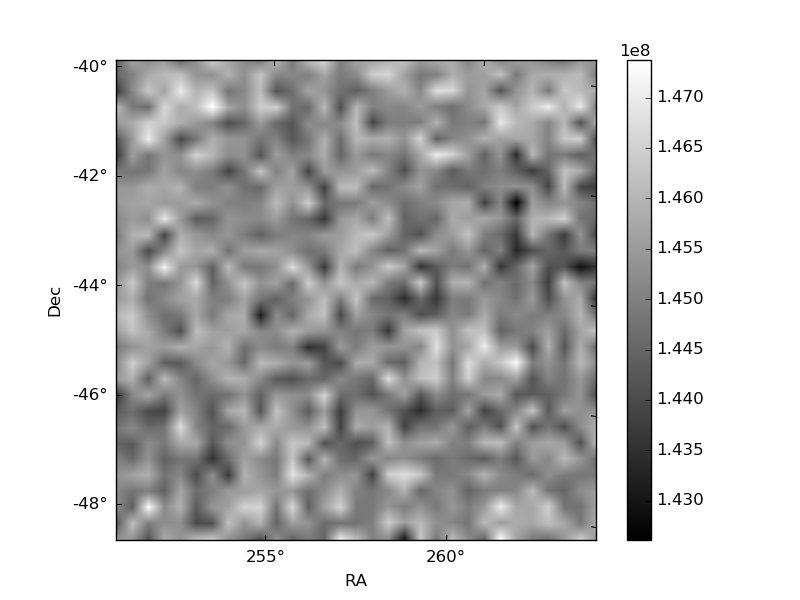
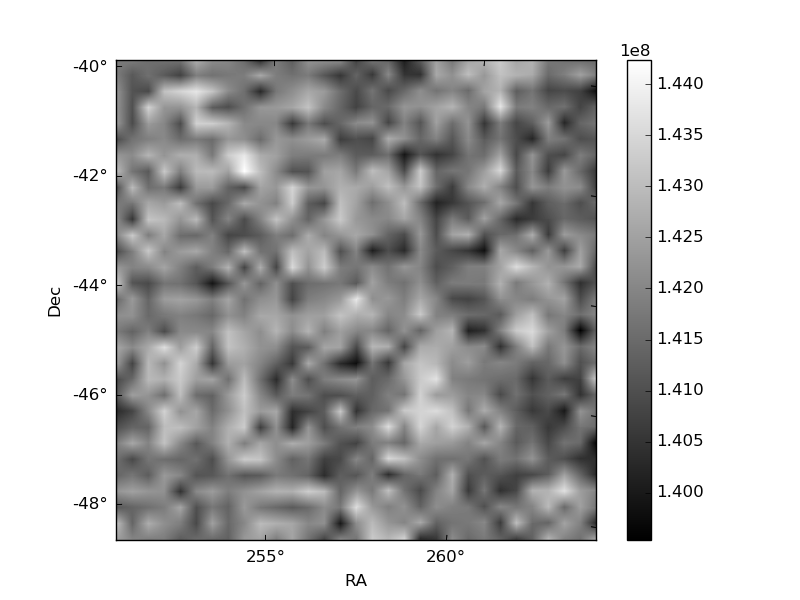
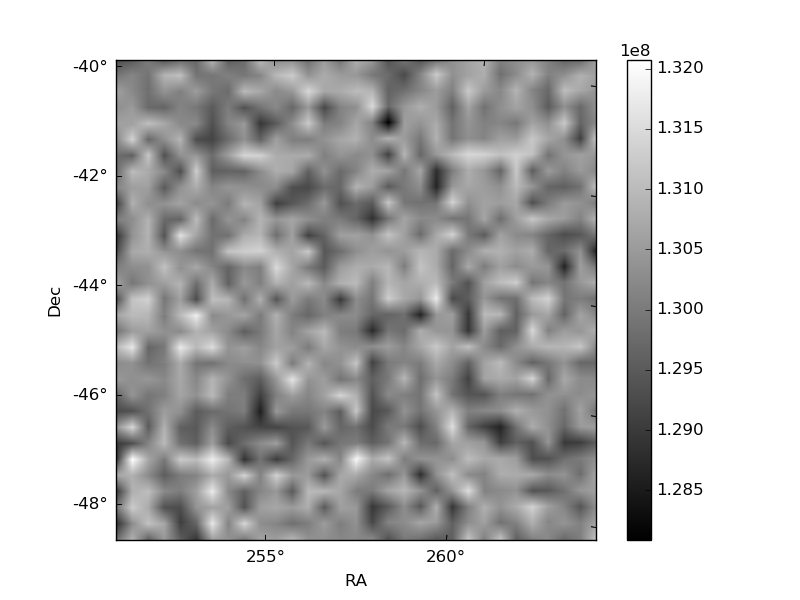
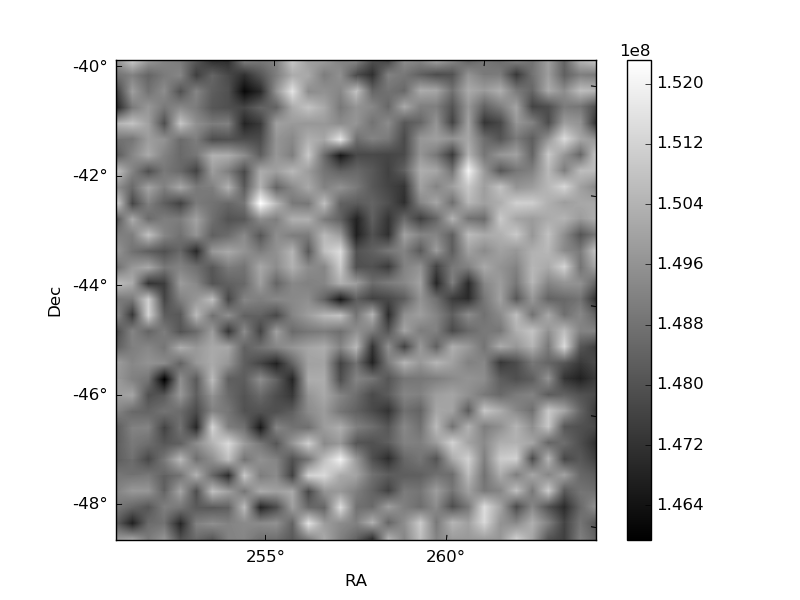
Histogram calculated using DETX and DETY for each event in the final _common_clean file
| Quadrant A | 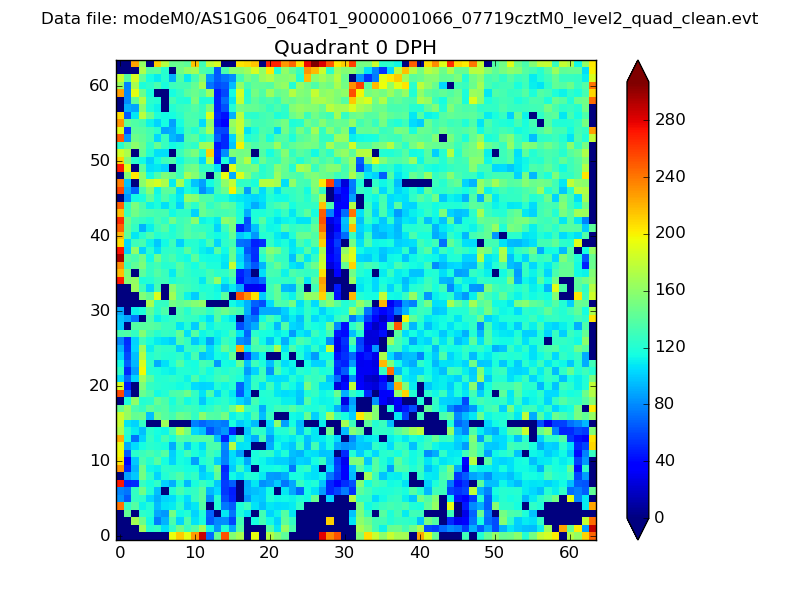 |
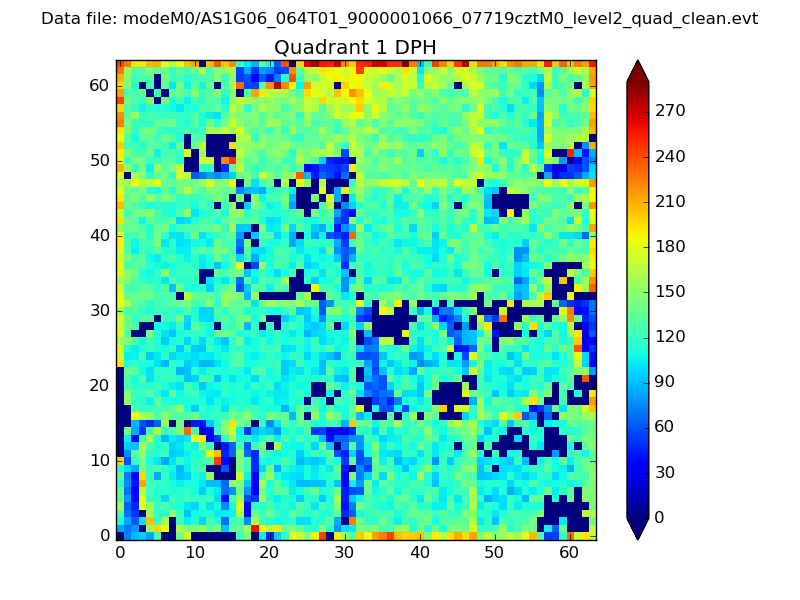 |
Quadrant B |
|---|---|---|---|
| Quadrant D | 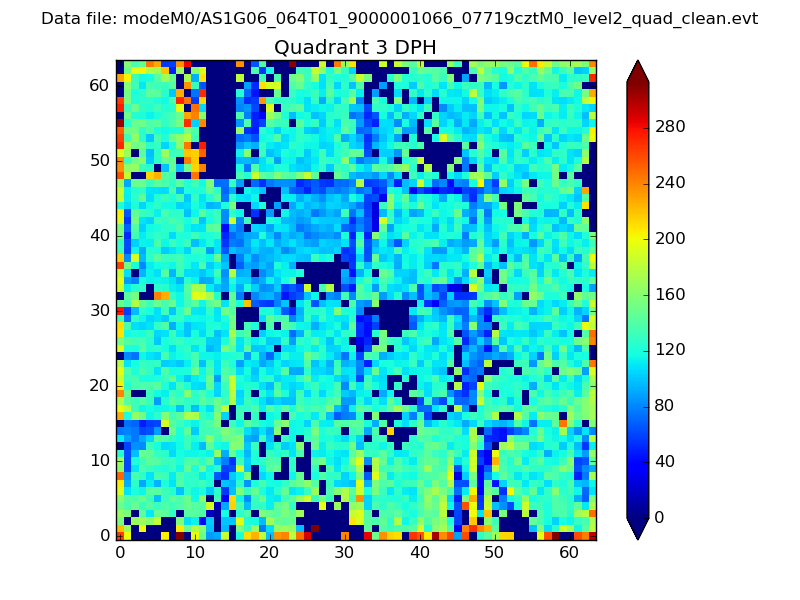 |
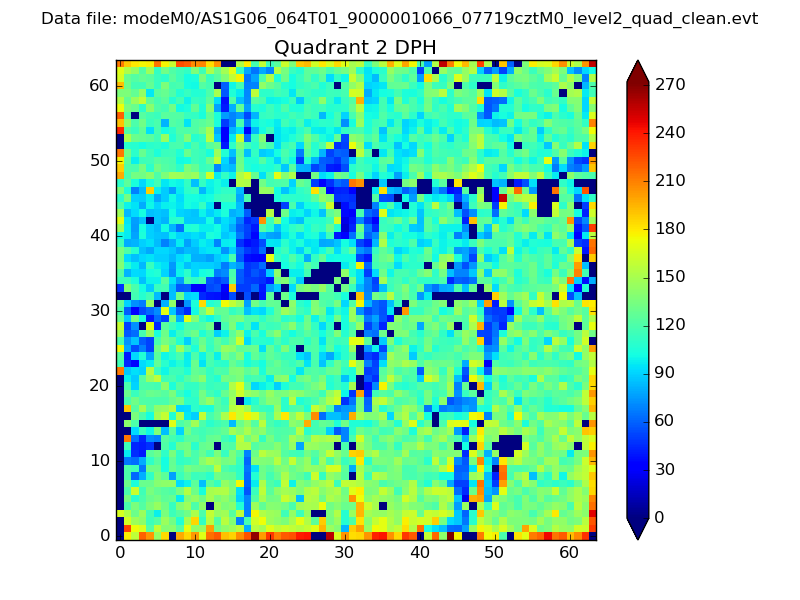 |
Quadrant C |
| Plot type | Count rate plots | Images |
|---|---|---|
| Comparison with Poisson distribution Blue bars denote a histogram of data divided into 1 sec bins. Red curve is a Poisson curve with rate = median count rate of data. |
 |
 |
| Quadrant-wise count rates Data is divided into 100 sec bins |
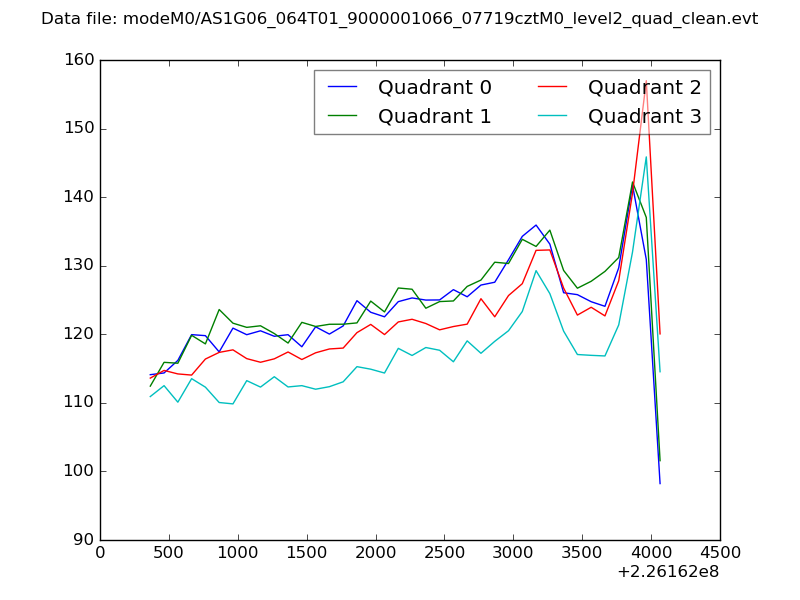 |
|
| Module-wise count rates for Quadrant A Data is divided into 100 sec bins |
 |
 |
| Module-wise count rates for Quadrant B Data is divided into 100 sec bins |
 |
 |
| Module-wise count rates for Quadrant C Data is divided into 100 sec bins |
 |
 |
| Module-wise count rates for Quadrant D Data is divided into 100 sec bins |
 |
 |
| Parameter | Plot |
|---|---|
| CZT HV Monitor |  |
| D_VDD | 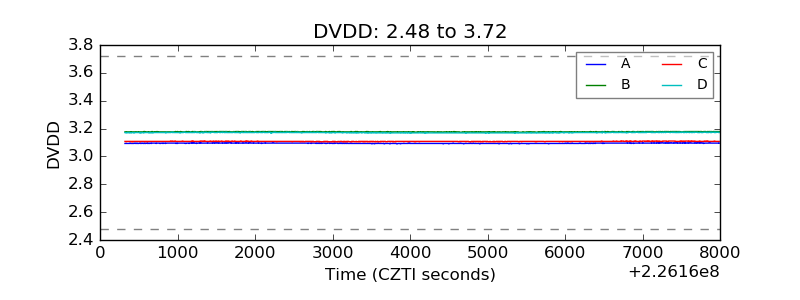 |
| Temperature 1 | 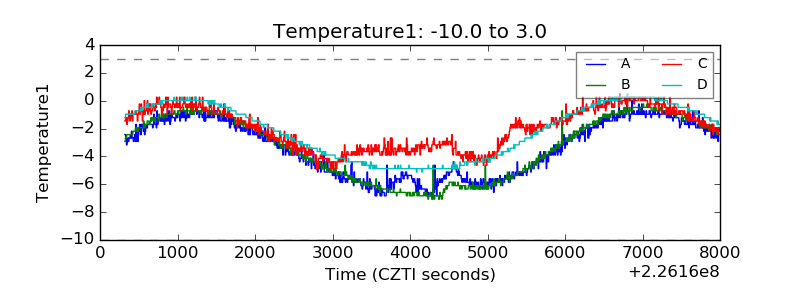 |
| Veto HV Monitor | 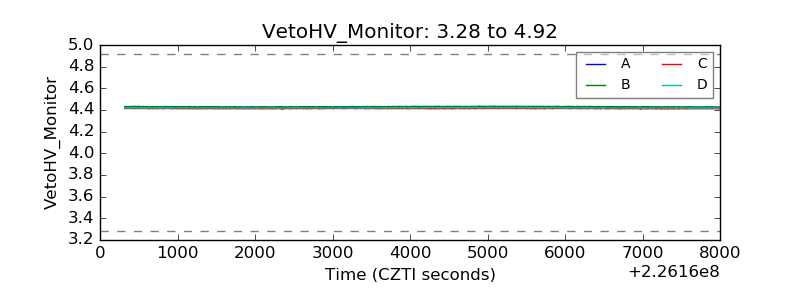 |
| Veto LLD | 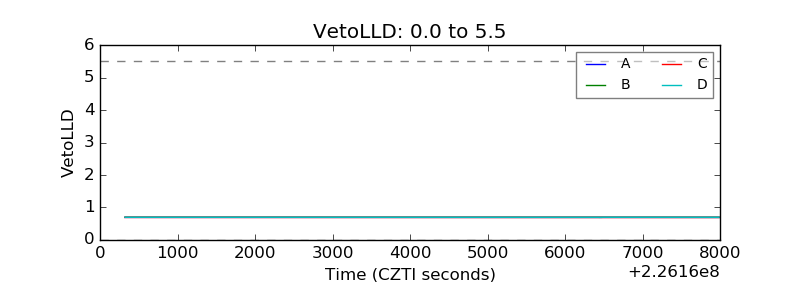 |
| Alpha Counter | 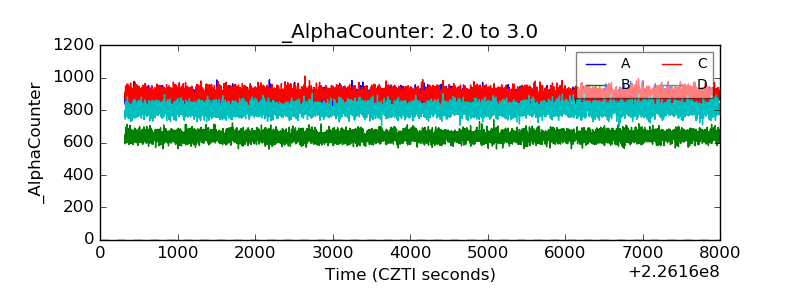 |
| _CPM_Rate | 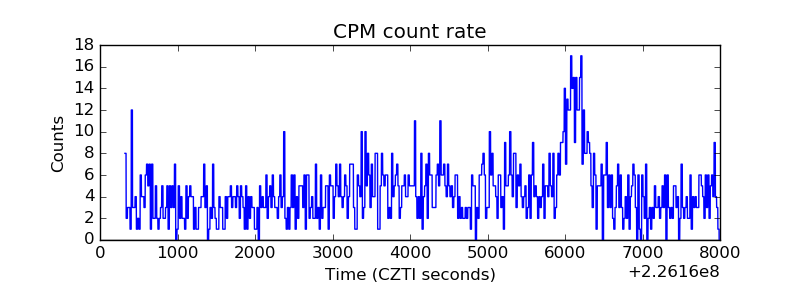 |
| CZT Counter | 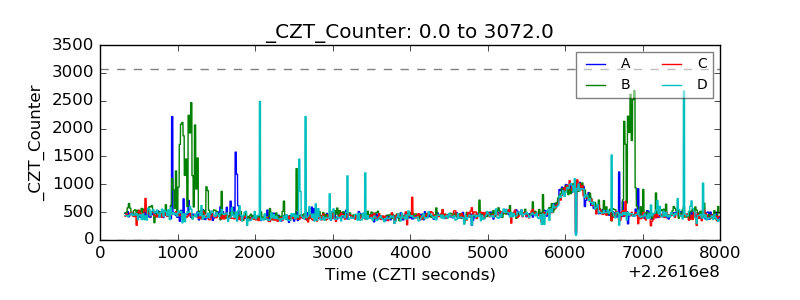 |
| +2.5 Volts monitor |  |
| +5 Volts monitor |  |
| _ROLL_ROT |  |
| _Roll_DEC |  |
| _Roll_RA | 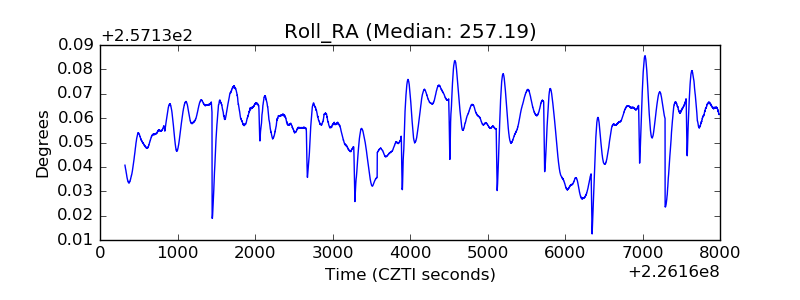 |
| Veto Counter |  |