| Param | Original file | Final file |
|---|---|---|
| Filename | modeM0/AS1G06_064T01_9000001066_07720cztM0_level2.evt | modeM0/AS1G06_064T01_9000001066_07720cztM0_level2_quad_clean.evt |
| Size (bytes) | 519,779,520 | 79,557,120 |
| Size | 495.7 MB | 75.9 MB |
| Events in quadrant A | 3,768,030 | 478,616 |
| Events in quadrant B | 4,101,420 | 479,799 |
| Events in quadrant C | 3,542,828 | 465,760 |
| Events in quadrant D | 3,803,831 | 447,062 |
| Mode SS | |||
|---|---|---|---|
| Quadrant | BADHDUFLAG | Total packets | Discarded packets |
| A | 0 | 158 | 0 |
| B | 0 | 158 | 0 |
| C | 0 | 158 | 0 |
| D | 0 | 158 | 0 |
| Mode M0 | |||
|---|---|---|---|
| Quadrant | BADHDUFLAG | Total packets | Discarded packets |
| A | 0 | 16387 | 3 |
| B | 0 | 17279 | 2 |
| C | 0 | 16033 | 2 |
| D | 0 | 16752 | 2 |
| Mode M9 | |||
|---|---|---|---|
| Quadrant | BADHDUFLAG | Total packets | Discarded packets |
| A | 0 | 2 | 0 |
| B | 0 | 2 | 0 |
| C | 0 | 2 | 0 |
| D | 0 | 2 | 0 |
| Quadrant | Total seconds | Saturated seconds | Saturation percentage |
|---|---|---|---|
| A | 7727 | 206 | 2.665976% |
| B | 7727 | 340 | 4.400155% |
| C | 7727 | 116 | 1.501229% |
| D | 7727 | 136 | 1.760062% |
Noise dominated data is calculated using 1-second bins in cleaned event files. If a bin has >2000 counts, and if more than 50% of those come from <1% of pixels, then it is considered to be noise-dominated and hence unusable.
| Quadrant | # 1 sec bins | Bins with >0 counts | Bins with >2000 counts | High rate bins dominated by noise | Noise dominated (total time) | Noise dominated (detector-on time) | Marked lightcurve |
|---|---|---|---|---|---|---|---|
| A | 7992 | 7727 | 6 | 6 | 0.08% | 0.08% | 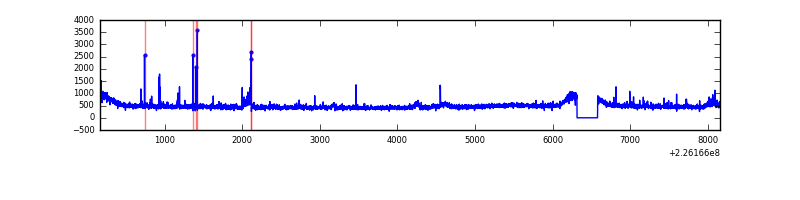 |
| B | 7992 | 7727 | 87 | 87 | 1.09% | 1.13% | 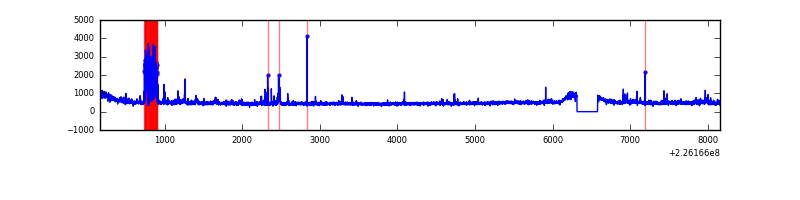 |
| C | 7992 | 7728 | 0 | 0 | 0.00% | 0.00% | 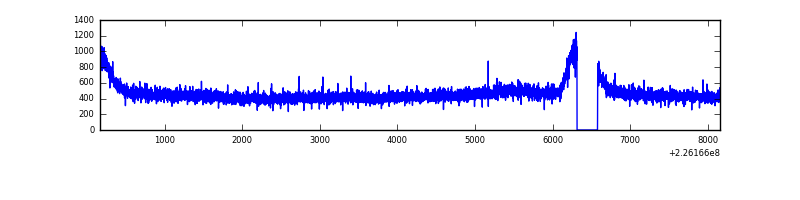 |
| D | 7992 | 7727 | 27 | 27 | 0.34% | 0.35% | 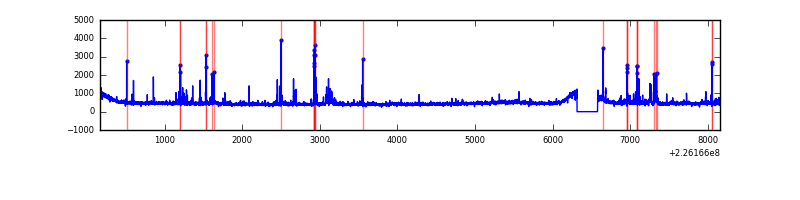 |
Top three noisy pixels from each quadrant. If the there are fewer than three noisy pixels in the level2.evt file, extra rows are filled as -1
| Pixel properties | Quadrant properties | ||||||
|---|---|---|---|---|---|---|---|
| Quadrant | DetID | PixID | Counts | Sigma | Mean | Median | Sigma |
| A | 15 | 234 | 153690 | 788.96 | 933 | 911 | 193.6 |
| A | 0 | 226 | 9010 | 41.82 | 933 | 911 | 193.6 |
| A | 3 | 1 | 8351 | 38.42 | 933 | 911 | 193.6 |
| B | 4 | 239 | 294712 | 1625.05 | 929 | 904 | 180.8 |
| B | 0 | 229 | 83792 | 458.45 | 929 | 904 | 180.8 |
| B | 0 | 219 | 45458 | 246.43 | 929 | 904 | 180.8 |
| C | 13 | 61 | 7187 | 29.54 | 905 | 907 | 212.6 |
| C | 8 | 128 | 3681 | 13.04 | 905 | 907 | 212.6 |
| C | 8 | 222 | 3585 | 12.59 | 905 | 907 | 212.6 |
| D | 13 | 104 | 147657 | 655.16 | 908 | 877 | 224.0 |
| D | 2 | 136 | 94682 | 418.71 | 908 | 877 | 224.0 |
| D | 2 | 152 | 45819 | 200.6 | 908 | 877 | 224.0 |
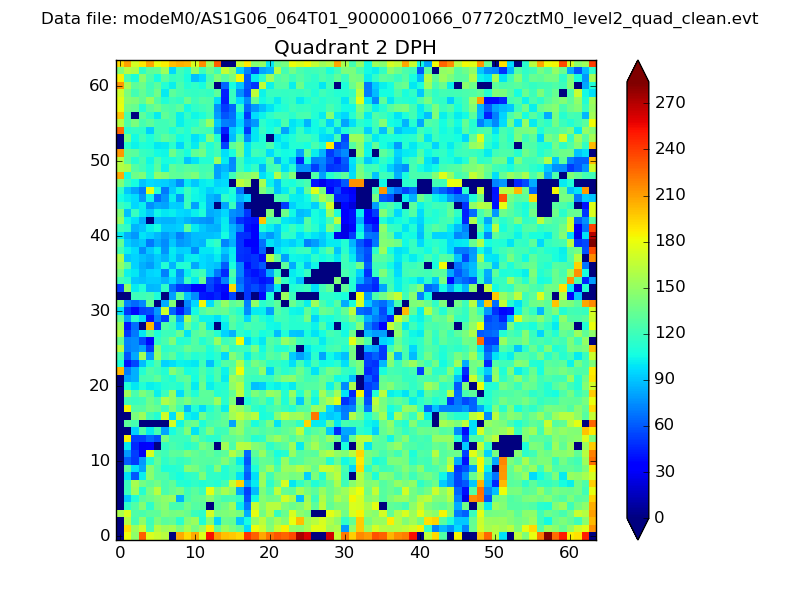
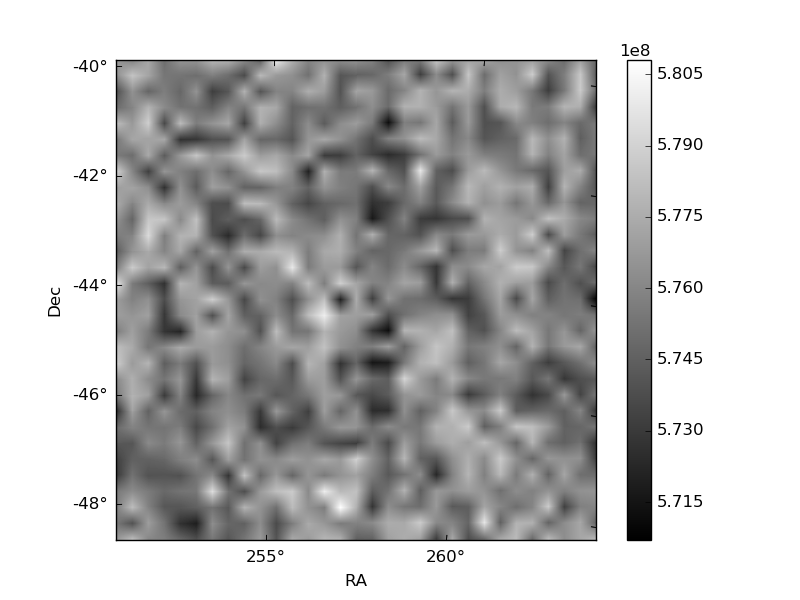
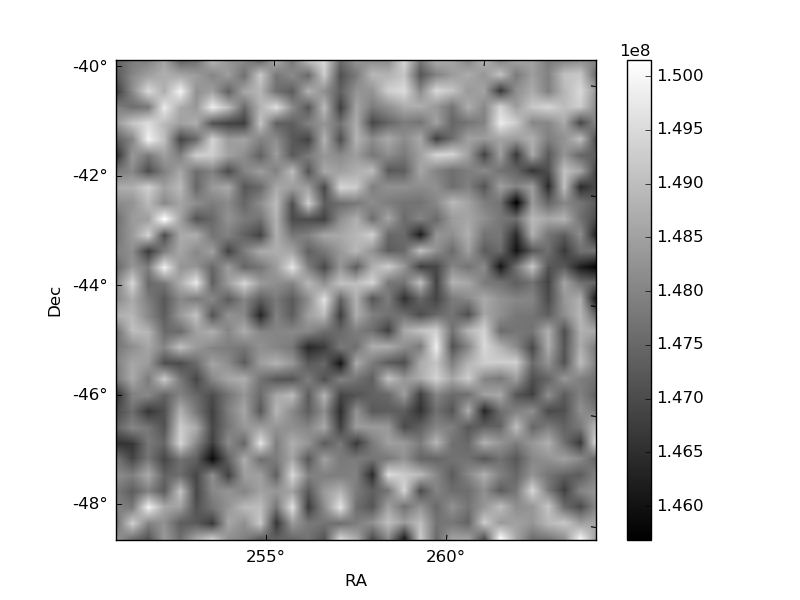
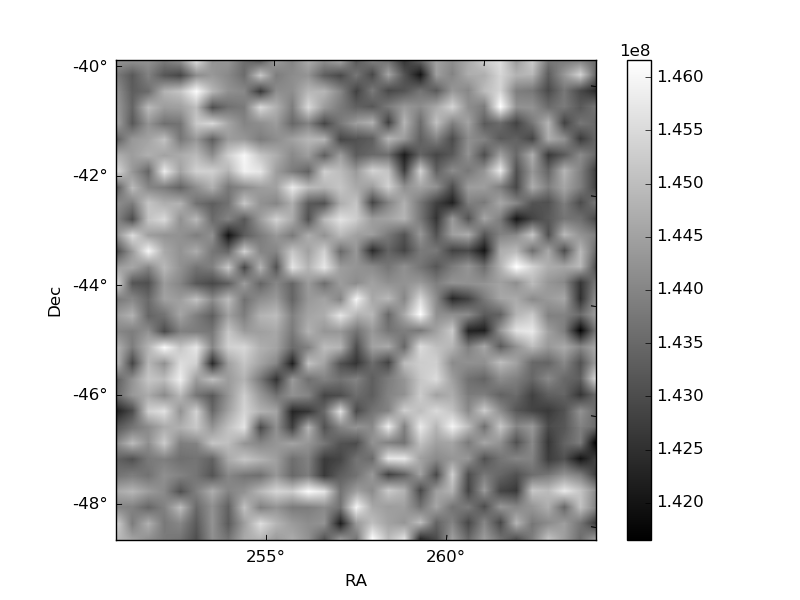
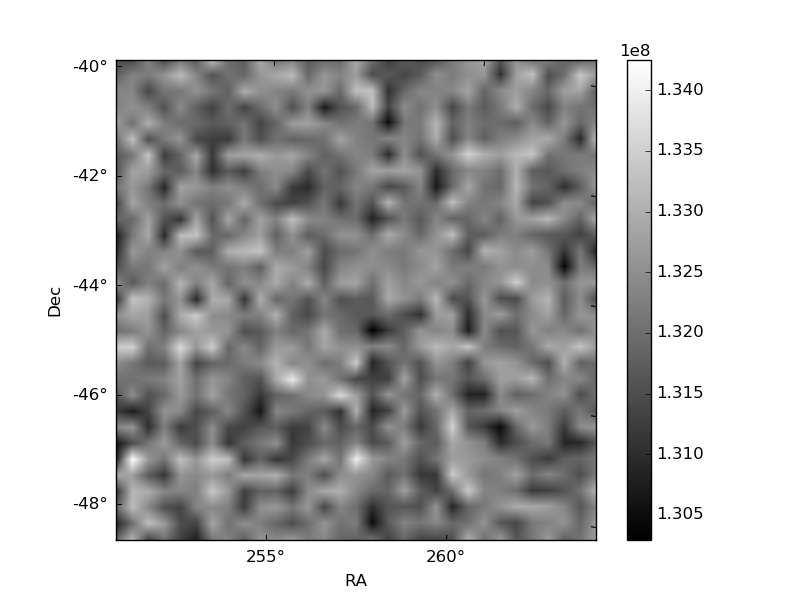
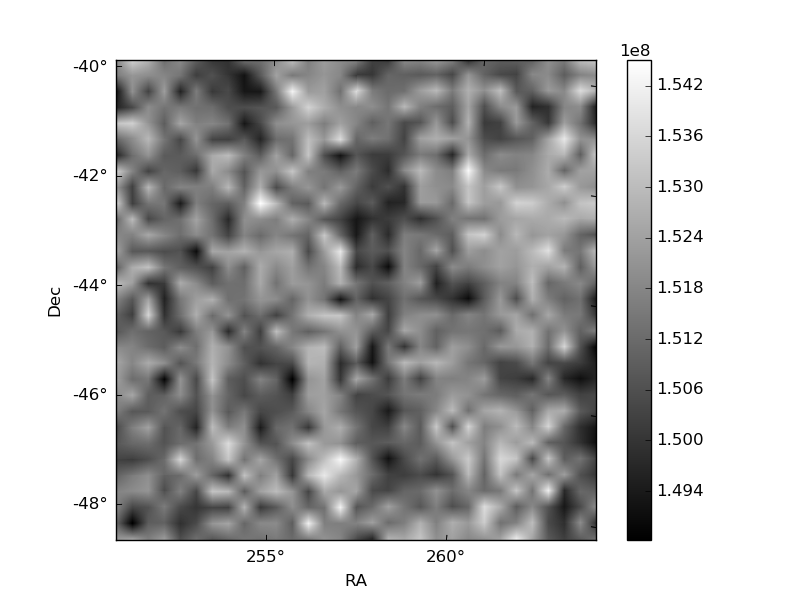
Histogram calculated using DETX and DETY for each event in the final _common_clean file
| Quadrant A | 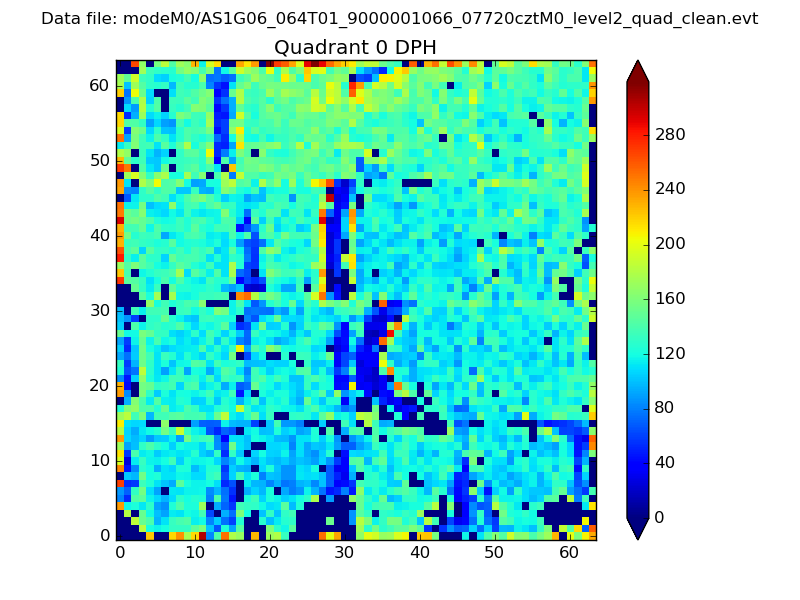 |
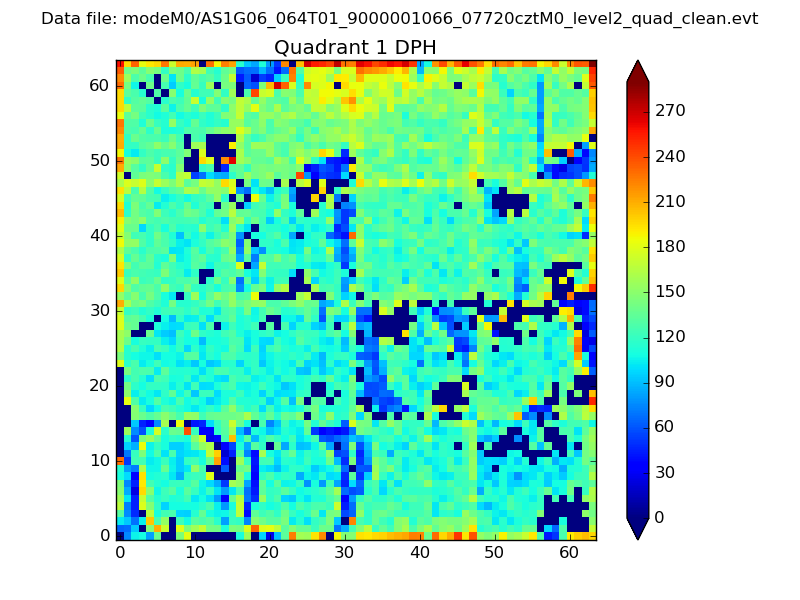 |
Quadrant B |
|---|---|---|---|
| Quadrant D | 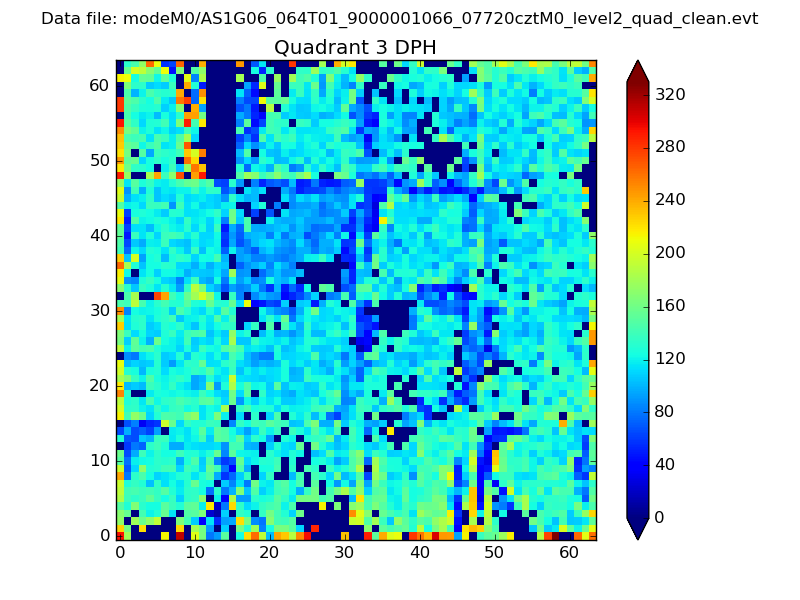 |
 |
Quadrant C |
| Plot type | Count rate plots | Images |
|---|---|---|
| Comparison with Poisson distribution Blue bars denote a histogram of data divided into 1 sec bins. Red curve is a Poisson curve with rate = median count rate of data. |
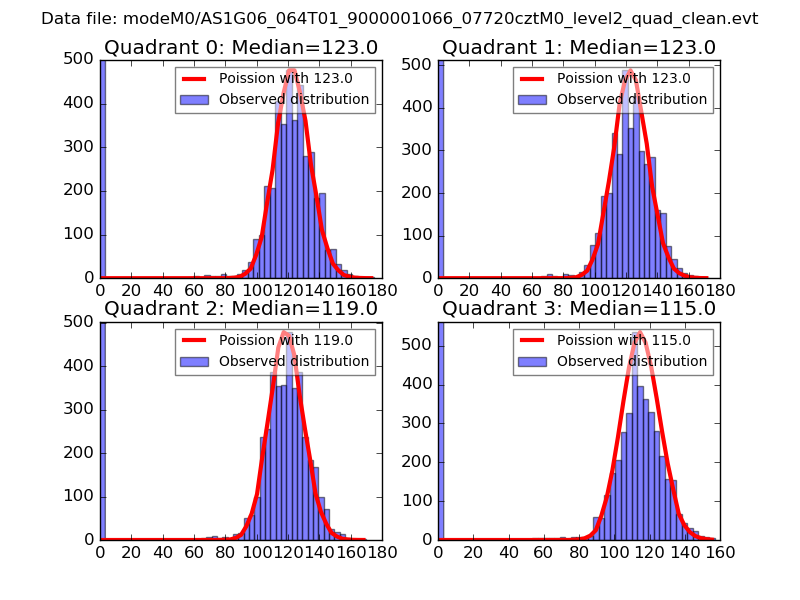 |
 |
| Quadrant-wise count rates Data is divided into 100 sec bins |
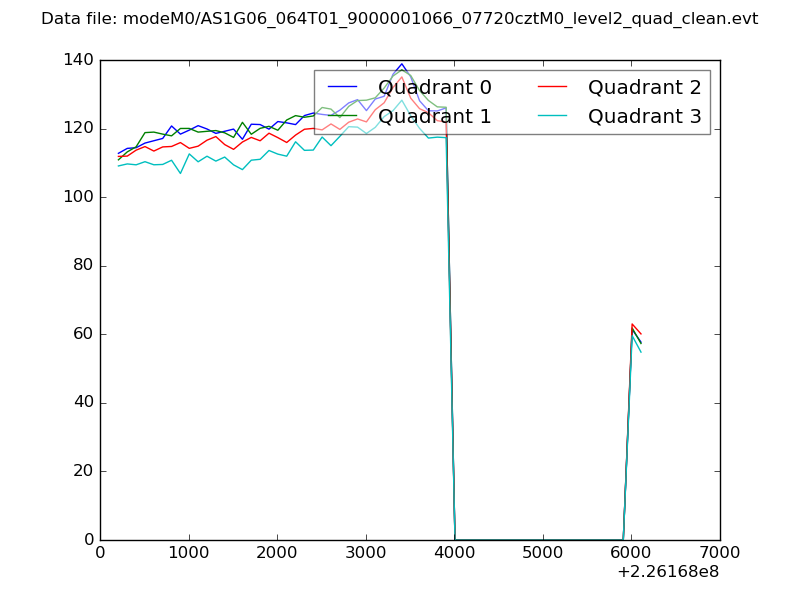 |
|
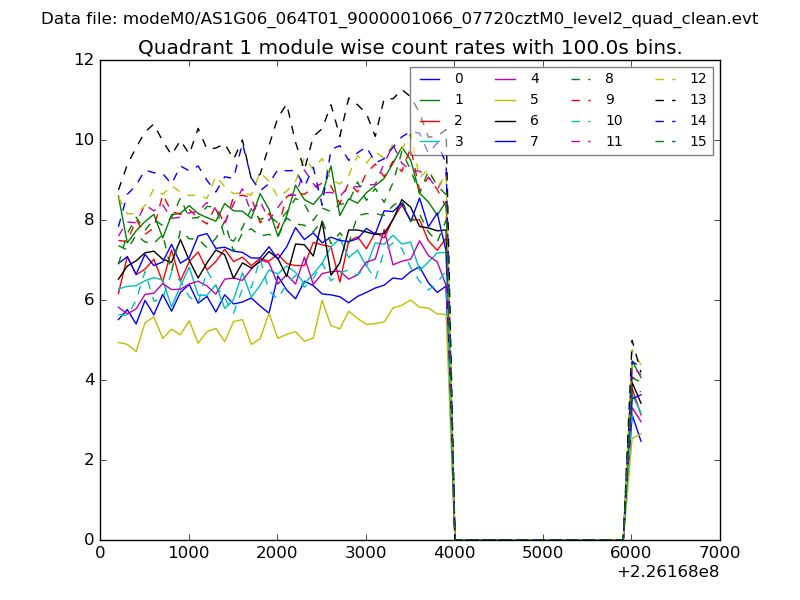
| Module-wise count rates for Quadrant A Data is divided into 100 sec bins |
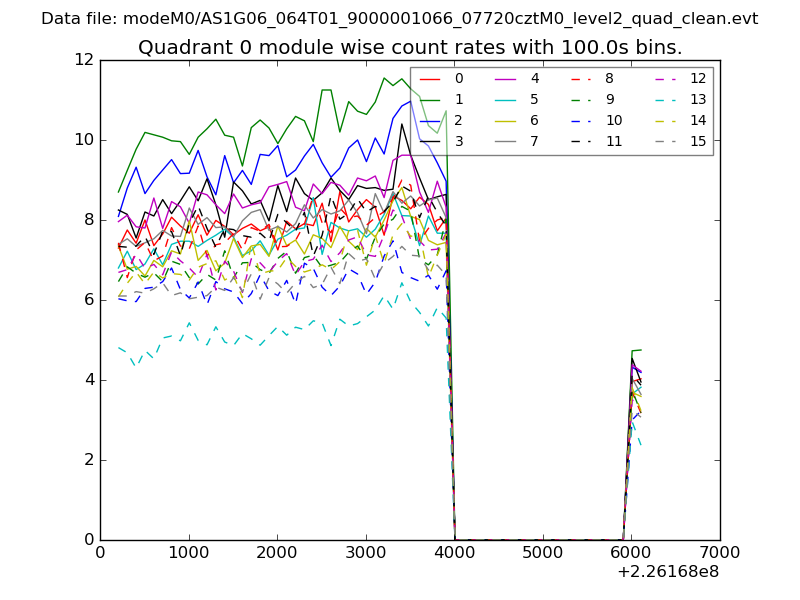 |
 |
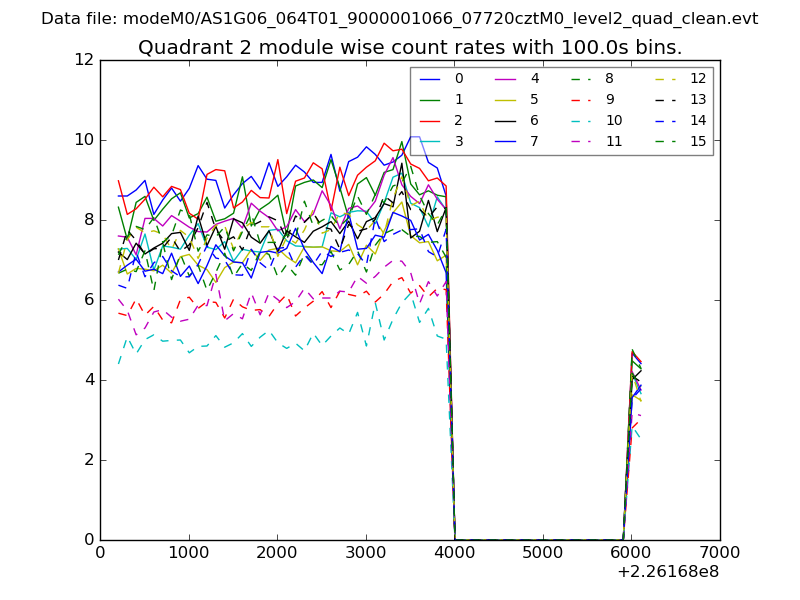
| Module-wise count rates for Quadrant B Data is divided into 100 sec bins |
 |
 |
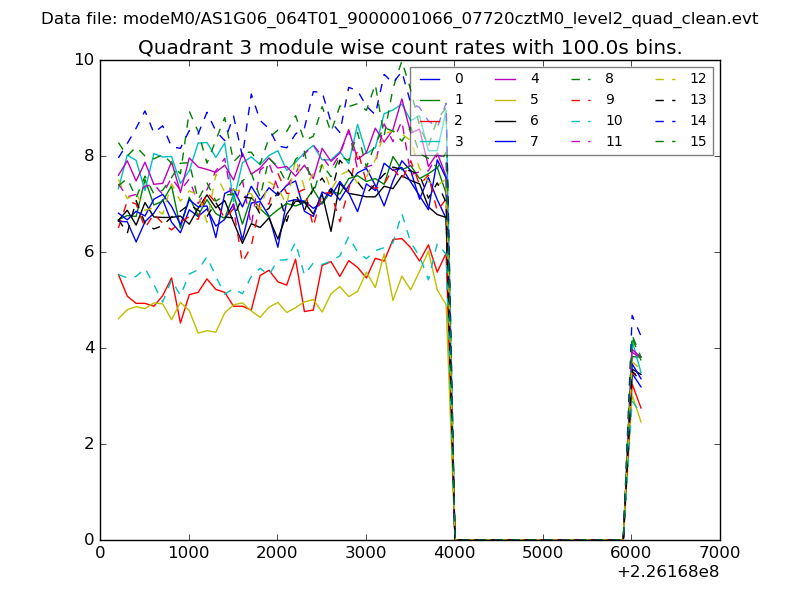
| Module-wise count rates for Quadrant C Data is divided into 100 sec bins |
 |
 |
| Module-wise count rates for Quadrant D Data is divided into 100 sec bins |
 |
 |
| Parameter | Plot |
|---|---|
| CZT HV Monitor | 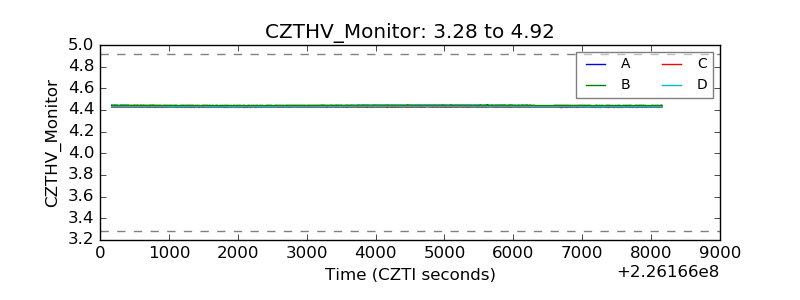 |
| D_VDD | 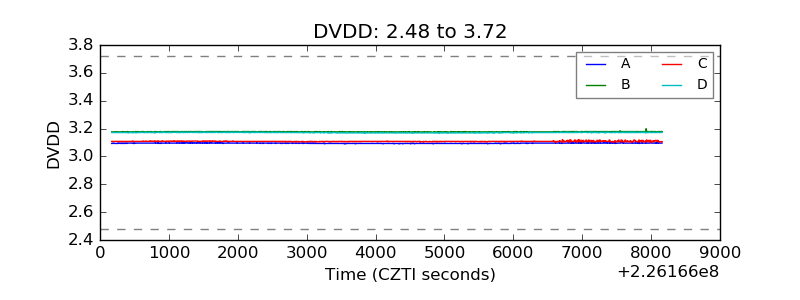 |
| Temperature 1 |  |
| Veto HV Monitor | 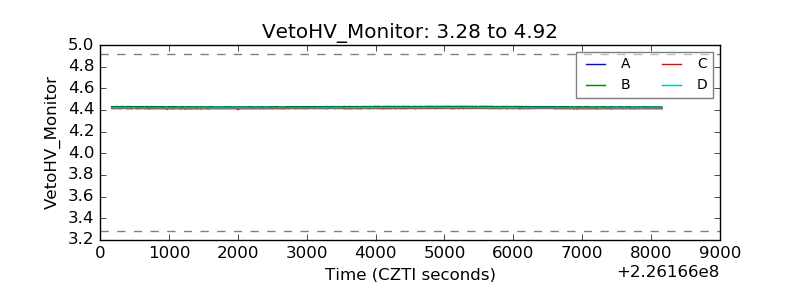 |
| Veto LLD | 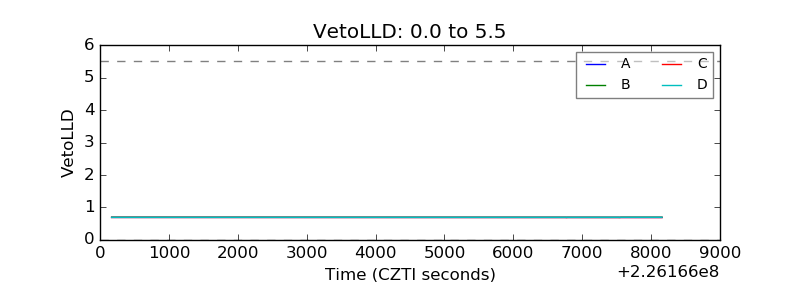 |
| Alpha Counter | 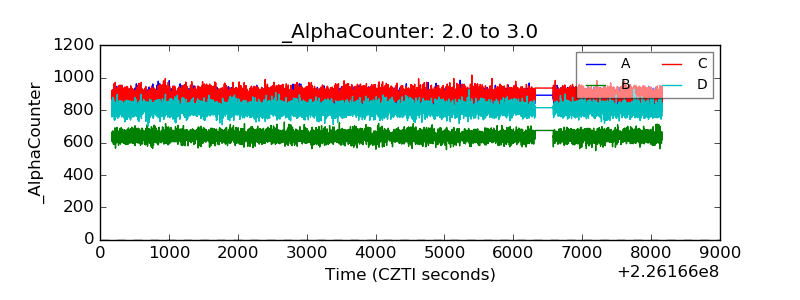 |
| _CPM_Rate | 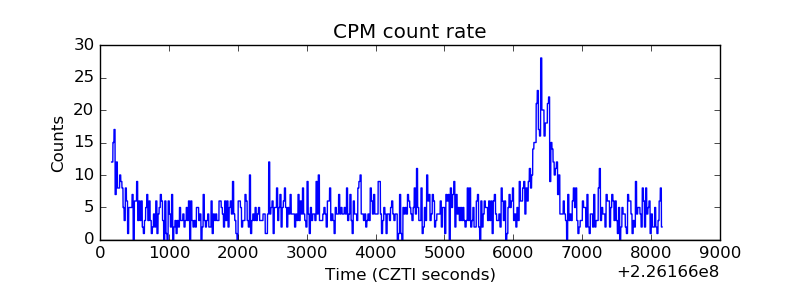 |
| CZT Counter | 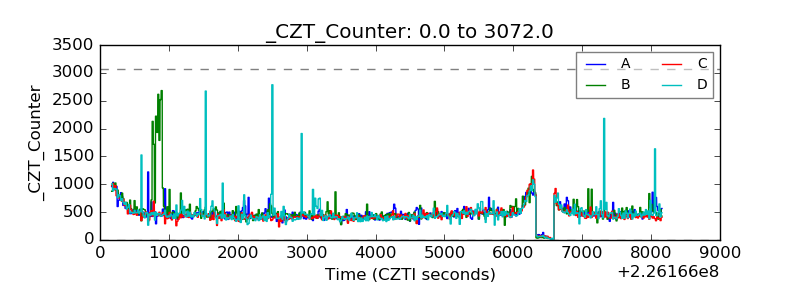 |
| +2.5 Volts monitor | 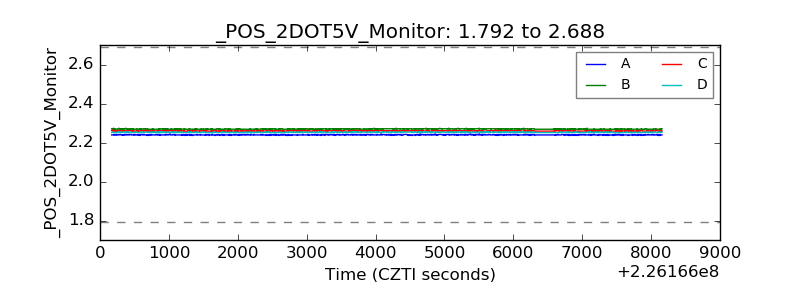 |
| +5 Volts monitor | 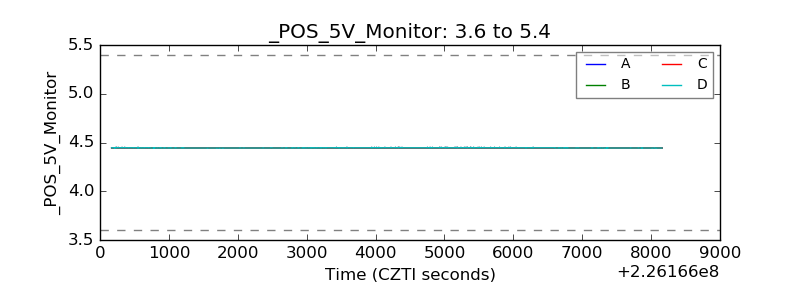 |
| _ROLL_ROT | 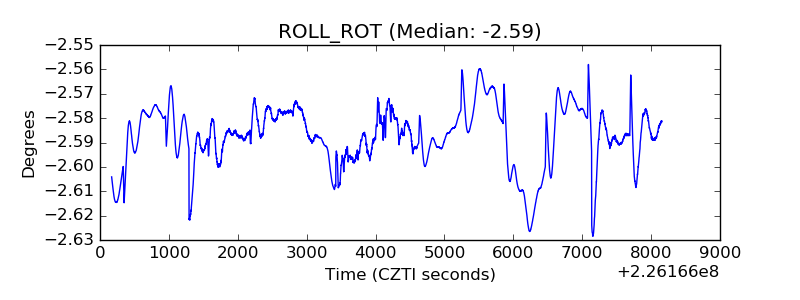 |
| _Roll_DEC | 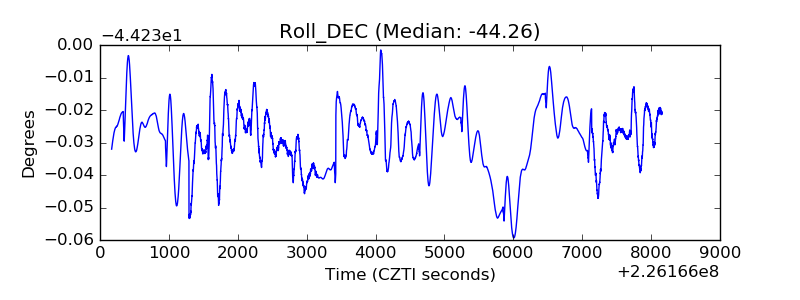 |
| _Roll_RA | 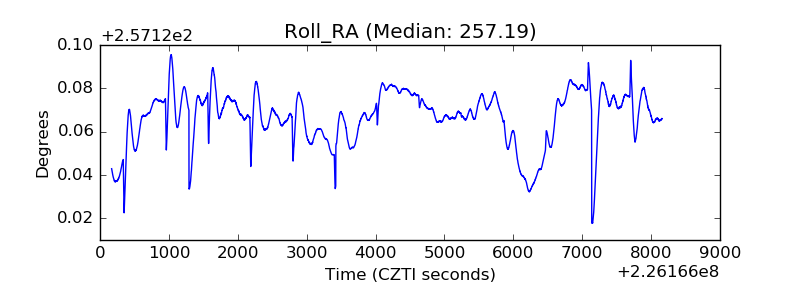 |
| Veto Counter | 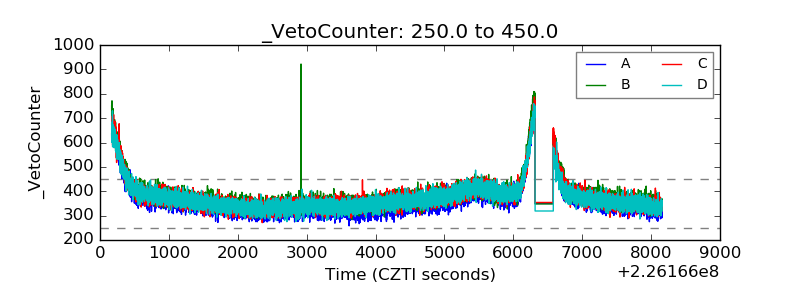 |