| Param | Original file | Final file |
|---|---|---|
| Filename | modeM0/AS1G06_064T01_9000001066_07722cztM0_level2.evt | modeM0/AS1G06_064T01_9000001066_07722cztM0_level2_quad_clean.evt |
| Size (bytes) | 567,017,280 | 68,976,000 |
| Size | 540.7 MB | 65.8 MB |
| Events in quadrant A | 3,174,321 | 452,350 |
| Events in quadrant B | 2,991,253 | 462,534 |
| Events in quadrant C | 2,801,200 | 448,273 |
| Events in quadrant D | 7,790,138 | 297,567 |
| Mode SS | |||
|---|---|---|---|
| Quadrant | BADHDUFLAG | Total packets | Discarded packets |
| A | 0 | 128 | 0 |
| B | 0 | 128 | 0 |
| C | 0 | 128 | 0 |
| D | 0 | 128 | 0 |
| Mode M0 | |||
|---|---|---|---|
| Quadrant | BADHDUFLAG | Total packets | Discarded packets |
| A | 0 | 13572 | 1 |
| B | 0 | 12947 | 1 |
| C | 0 | 12624 | 1 |
| D | 0 | 27221 | 1 |
| Mode M9 | |||
|---|---|---|---|
| Quadrant | BADHDUFLAG | Total packets | Discarded packets |
| A | 0 | 6 | 0 |
| B | 0 | 5 | 0 |
| C | 0 | 5 | 0 |
| D | 0 | 5 | 0 |
| Quadrant | Total seconds | Saturated seconds | Saturation percentage |
|---|---|---|---|
| A | 6109 | 218 | 3.568505% |
| B | 6109 | 142 | 2.324439% |
| C | 6109 | 84 | 1.375020% |
| D | 6109 | 2069 | 33.868064% |
Noise dominated data is calculated using 1-second bins in cleaned event files. If a bin has >2000 counts, and if more than 50% of those come from <1% of pixels, then it is considered to be noise-dominated and hence unusable.
| Quadrant | # 1 sec bins | Bins with >0 counts | Bins with >2000 counts | High rate bins dominated by noise | Noise dominated (total time) | Noise dominated (detector-on time) | Marked lightcurve |
|---|---|---|---|---|---|---|---|
| A | 6374 | 6109 | 72 | 72 | 1.13% | 1.18% | 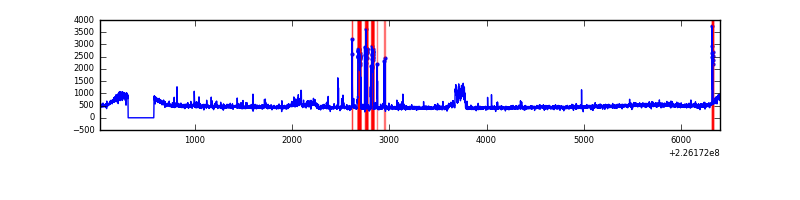 |
| B | 6374 | 6109 | 1 | 1 | 0.02% | 0.02% | 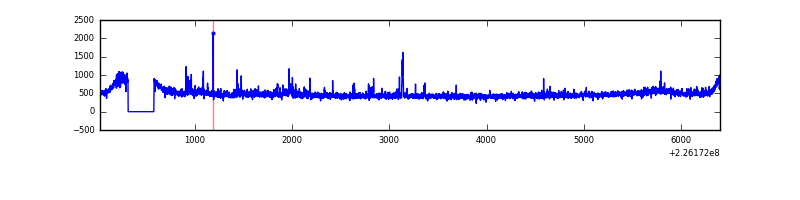 |
| C | 6374 | 6110 | 0 | 0 | 0.00% | 0.00% | 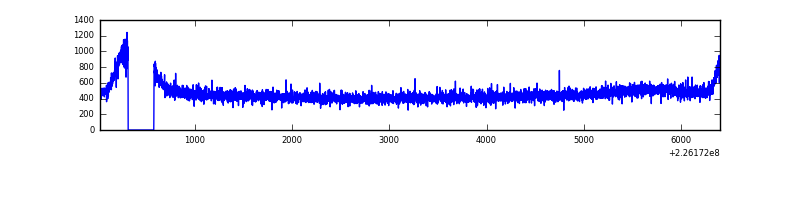 |
| D | 6373 | 6108 | 1937 | 1937 | 30.39% | 31.71% | 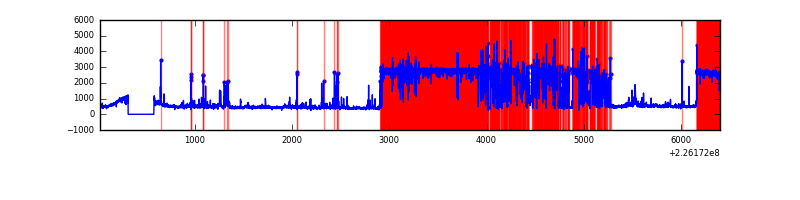 |
Top three noisy pixels from each quadrant. If the there are fewer than three noisy pixels in the level2.evt file, extra rows are filled as -1
| Pixel properties | Quadrant properties | ||||||
|---|---|---|---|---|---|---|---|
| Quadrant | DetID | PixID | Counts | Sigma | Mean | Median | Sigma |
| A | 15 | 234 | 362404 | 2391.87 | 728 | 711 | 151.2 |
| A | 0 | 226 | 6904 | 40.95 | 728 | 711 | 151.2 |
| A | 12 | 194 | 6460 | 38.01 | 728 | 711 | 151.2 |
| B | 0 | 229 | 42698 | 293.14 | 736 | 717 | 143.2 |
| B | 0 | 219 | 15843 | 105.62 | 736 | 717 | 143.2 |
| B | 4 | 173 | 15629 | 104.13 | 736 | 717 | 143.2 |
| C | 8 | 128 | 10885 | 60.62 | 712 | 715 | 167.8 |
| C | 8 | 112 | 6482 | 34.38 | 712 | 715 | 167.8 |
| C | 13 | 61 | 5653 | 29.43 | 712 | 715 | 167.8 |
| D | 12 | 221 | 5316648 | 37310.67 | 575 | 557 | 142.5 |
| D | 13 | 104 | 95439 | 665.92 | 575 | 557 | 142.5 |
| D | 2 | 136 | 52526 | 364.74 | 575 | 557 | 142.5 |
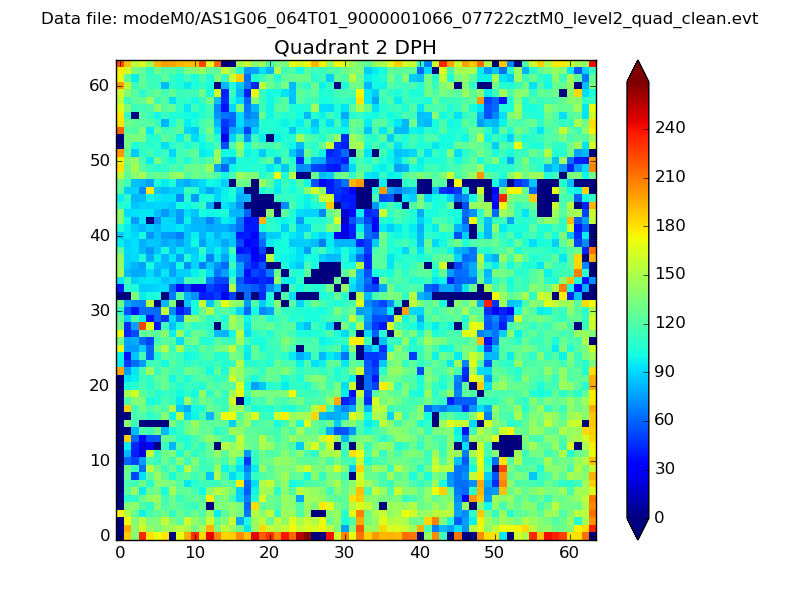
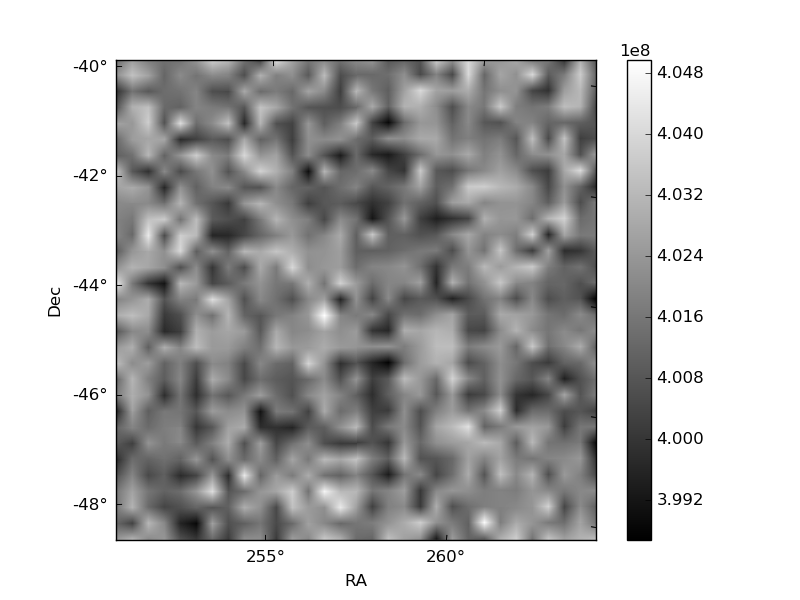
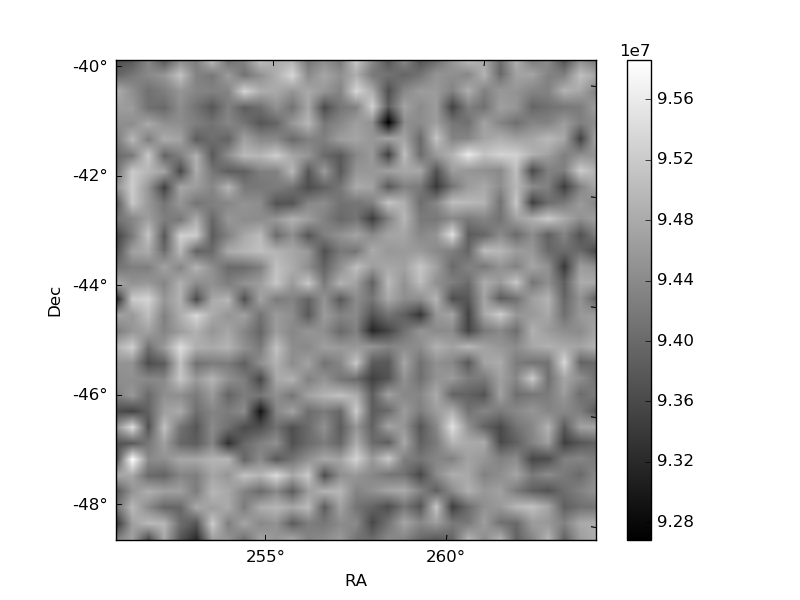
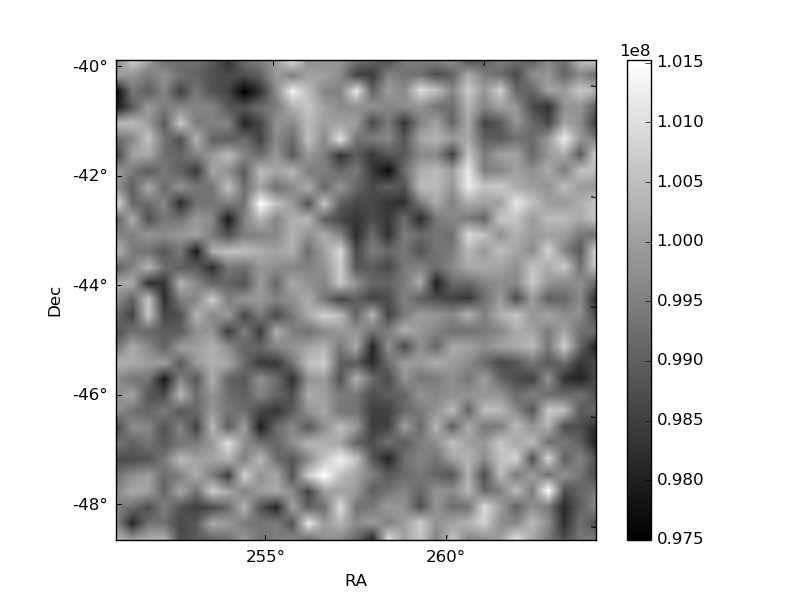
Histogram calculated using DETX and DETY for each event in the final _common_clean file
| Quadrant A | 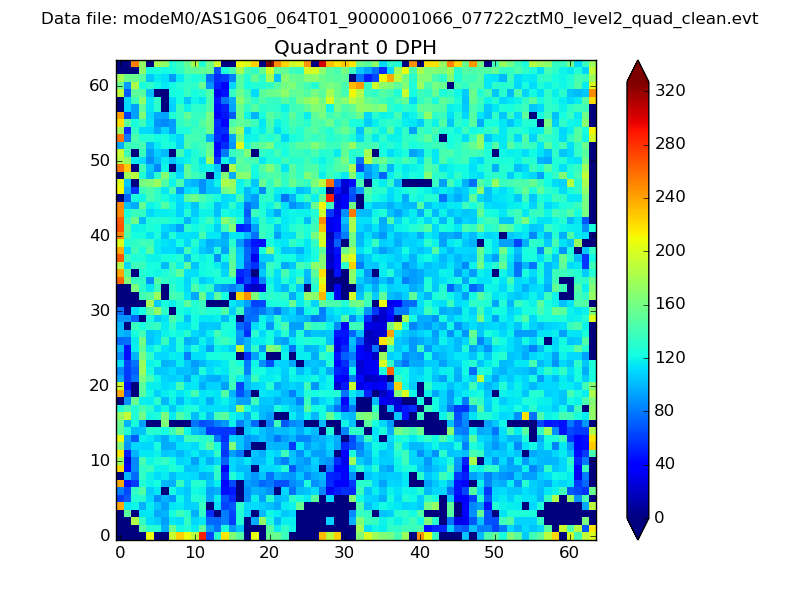 |
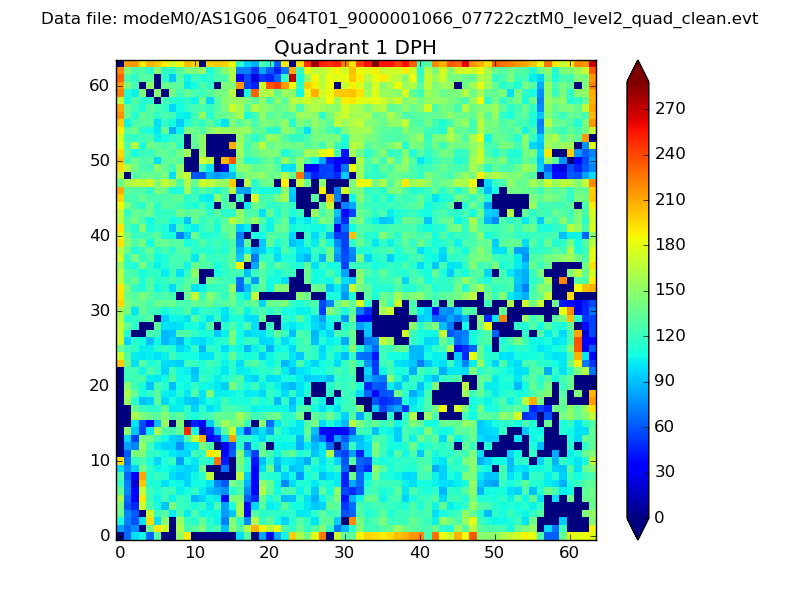 |
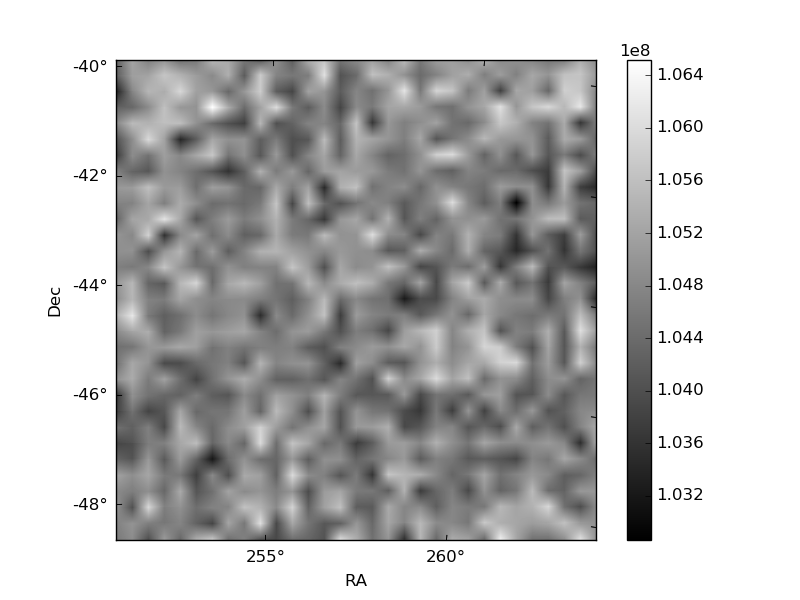
Quadrant B |
|---|---|---|---|
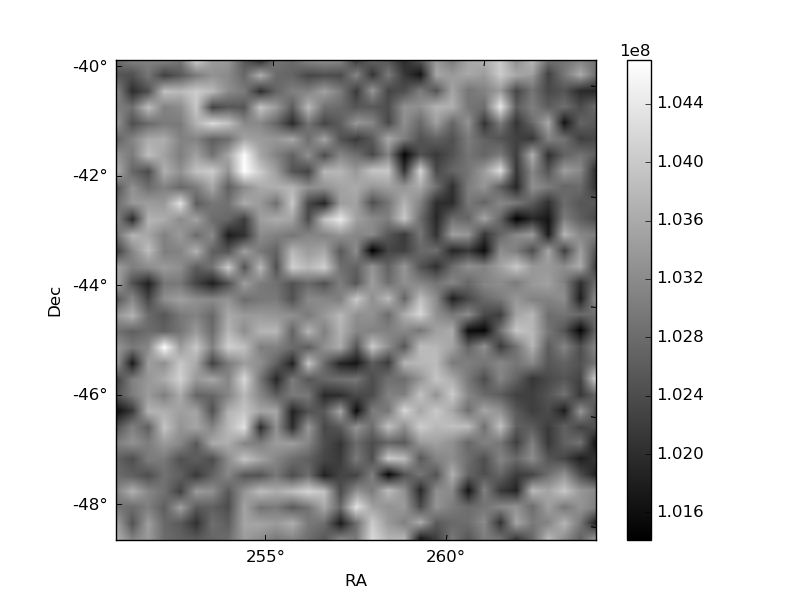
| Quadrant D | 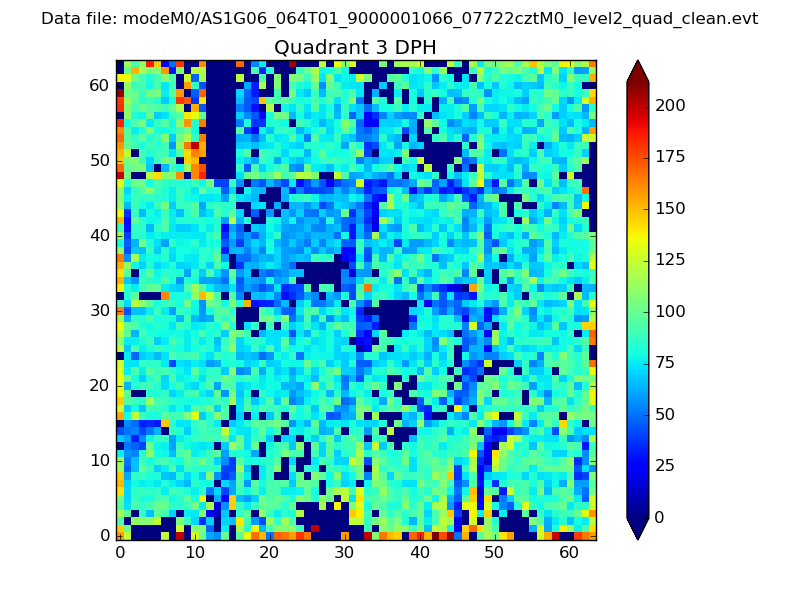 |
 |
Quadrant C |
| Plot type | Count rate plots | Images |
|---|---|---|
| Comparison with Poisson distribution Blue bars denote a histogram of data divided into 1 sec bins. Red curve is a Poisson curve with rate = median count rate of data. |
 |
 |
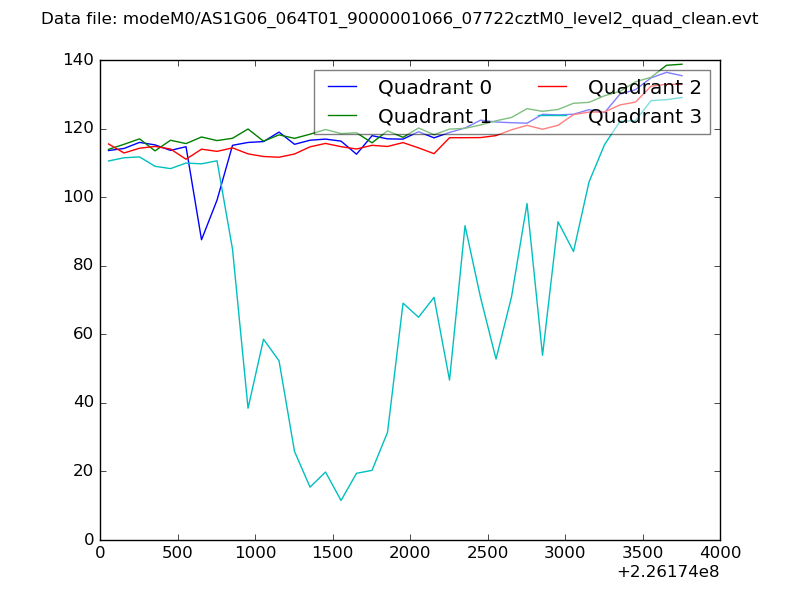
| Quadrant-wise count rates Data is divided into 100 sec bins |
 |
|
| Module-wise count rates for Quadrant A Data is divided into 100 sec bins |
 |
 |
| Module-wise count rates for Quadrant B Data is divided into 100 sec bins |
 |
 |
| Module-wise count rates for Quadrant C Data is divided into 100 sec bins |
 |
 |
| Module-wise count rates for Quadrant D Data is divided into 100 sec bins |
 |
 |
| Parameter | Plot |
|---|---|
| CZT HV Monitor |  |
| D_VDD | 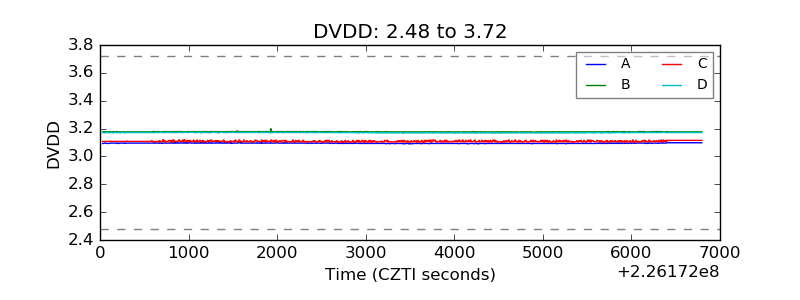 |
| Temperature 1 | 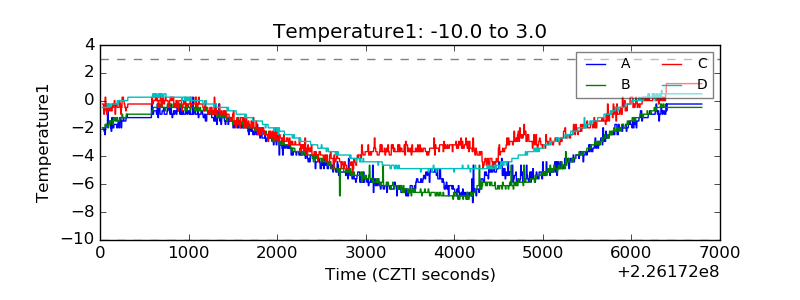 |
| Veto HV Monitor | 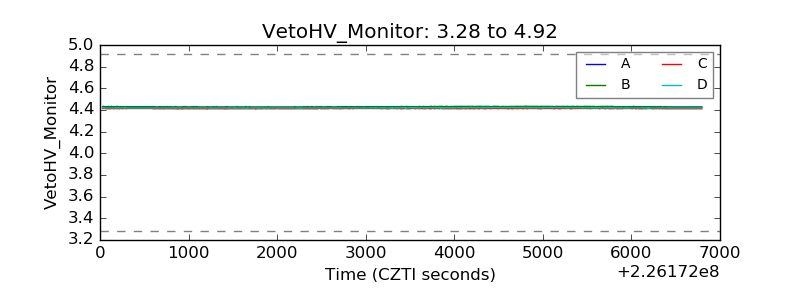 |
| Veto LLD | 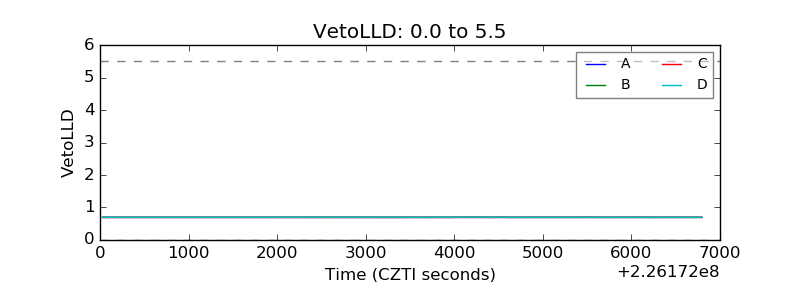 |
| Alpha Counter | 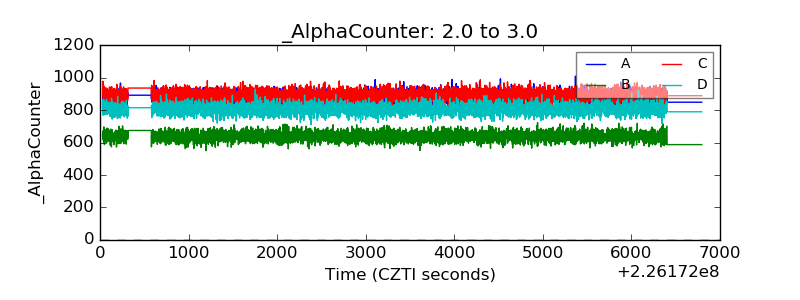 |
| _CPM_Rate | 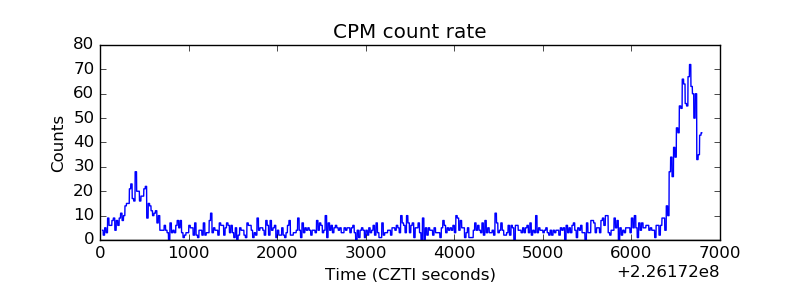 |
| CZT Counter | 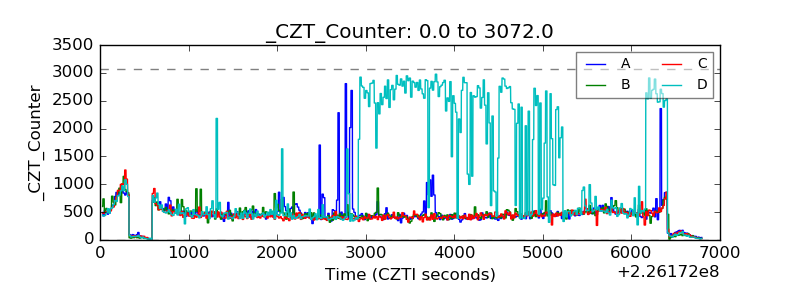 |
| +2.5 Volts monitor | 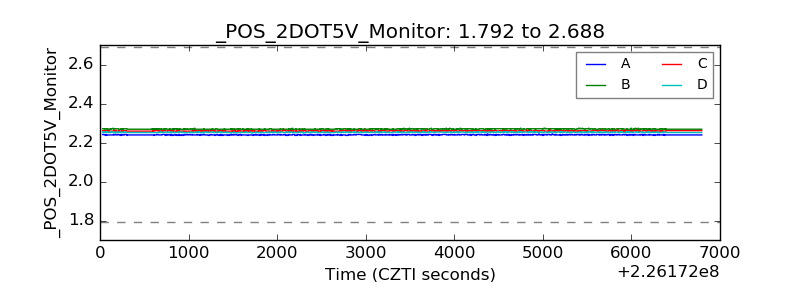 |
| +5 Volts monitor |  |
| _ROLL_ROT |  |
| _Roll_DEC | 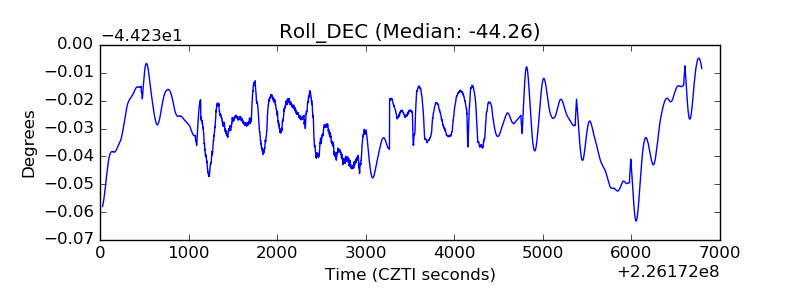 |
| _Roll_RA | 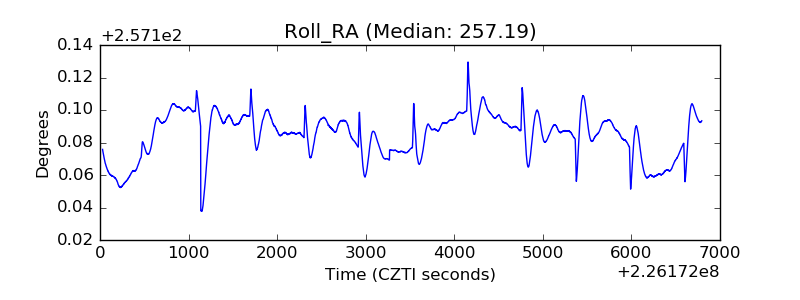 |
| Veto Counter |  |