| Param | Original file | Final file |
|---|---|---|
| Filename | modeM0/AS1G06_064T01_9000001066_07723cztM0_level2.evt | modeM0/AS1G06_064T01_9000001066_07723cztM0_level2_quad_clean.evt |
| Size (bytes) | 894,182,400 | 174,159,360 |
| Size | 852.8 MB | 166.1 MB |
| Events in quadrant A | 6,156,953 | 1,106,172 |
| Events in quadrant B | 6,376,851 | 1,118,272 |
| Events in quadrant C | 6,047,687 | 1,086,969 |
| Events in quadrant D | 7,593,443 | 1,040,171 |
| Mode SS | |||
|---|---|---|---|
| Quadrant | BADHDUFLAG | Total packets | Discarded packets |
| A | 0 | 274 | 0 |
| B | 0 | 274 | 0 |
| C | 0 | 274 | 0 |
| D | 0 | 274 | 0 |
| Mode M0 | |||
|---|---|---|---|
| Quadrant | BADHDUFLAG | Total packets | Discarded packets |
| A | 0 | 27378 | 4 |
| B | 0 | 27838 | 3 |
| C | 0 | 27166 | 3 |
| D | 0 | 31662 | 3 |
| Mode M9 | |||
|---|---|---|---|
| Quadrant | BADHDUFLAG | Total packets | Discarded packets |
| A | 0 | 20 | 0 |
| B | 0 | 20 | 0 |
| C | 0 | 20 | 0 |
| D | 0 | 20 | 0 |
| Quadrant | Total seconds | Saturated seconds | Saturation percentage |
|---|---|---|---|
| A | 13364 | 73 | 0.546244% |
| B | 13364 | 80 | 0.598623% |
| C | 13364 | 23 | 0.172104% |
| D | 13364 | 568 | 4.250224% |
Noise dominated data is calculated using 1-second bins in cleaned event files. If a bin has >2000 counts, and if more than 50% of those come from <1% of pixels, then it is considered to be noise-dominated and hence unusable.
| Quadrant | # 1 sec bins | Bins with >0 counts | Bins with >2000 counts | High rate bins dominated by noise | Noise dominated (total time) | Noise dominated (detector-on time) | Marked lightcurve |
|---|---|---|---|---|---|---|---|
| A | 15354 | 13367 | 10 | 10 | 0.07% | 0.07% |  |
| B | 15354 | 13367 | 3 | 3 | 0.02% | 0.02% |  |
| C | 15354 | 13367 | 0 | 0 | 0.00% | 0.00% | 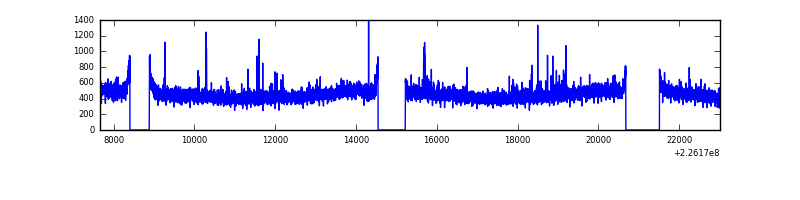 |
| D | 15354 | 13366 | 487 | 487 | 3.17% | 3.64% | 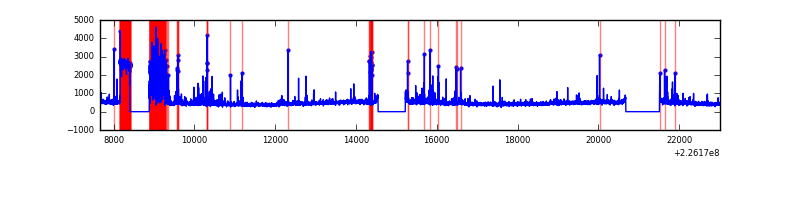 |
Top three noisy pixels from each quadrant. If the there are fewer than three noisy pixels in the level2.evt file, extra rows are filled as -1
| Pixel properties | Quadrant properties | ||||||
|---|---|---|---|---|---|---|---|
| Quadrant | DetID | PixID | Counts | Sigma | Mean | Median | Sigma |
| A | 15 | 234 | 63143 | 193.16 | 1569 | 1531 | 319.0 |
| A | 13 | 251 | 25924 | 76.48 | 1569 | 1531 | 319.0 |
| A | 3 | 1 | 17592 | 50.35 | 1569 | 1531 | 319.0 |
| B | 0 | 229 | 64489 | 209.33 | 1584 | 1543 | 300.7 |
| B | 0 | 214 | 42039 | 134.67 | 1584 | 1543 | 300.7 |
| B | 0 | 219 | 29977 | 94.56 | 1584 | 1543 | 300.7 |
| C | 9 | 68 | 75294 | 208.9 | 1522 | 1529 | 353.1 |
| C | 8 | 128 | 14004 | 35.33 | 1522 | 1529 | 353.1 |
| C | 12 | 4 | 11718 | 28.86 | 1522 | 1529 | 353.1 |
| D | 12 | 221 | 1208172 | 3337.26 | 1472 | 1426 | 361.6 |
| D | 13 | 104 | 279233 | 768.28 | 1472 | 1426 | 361.6 |
| D | 8 | 195 | 246108 | 676.67 | 1472 | 1426 | 361.6 |
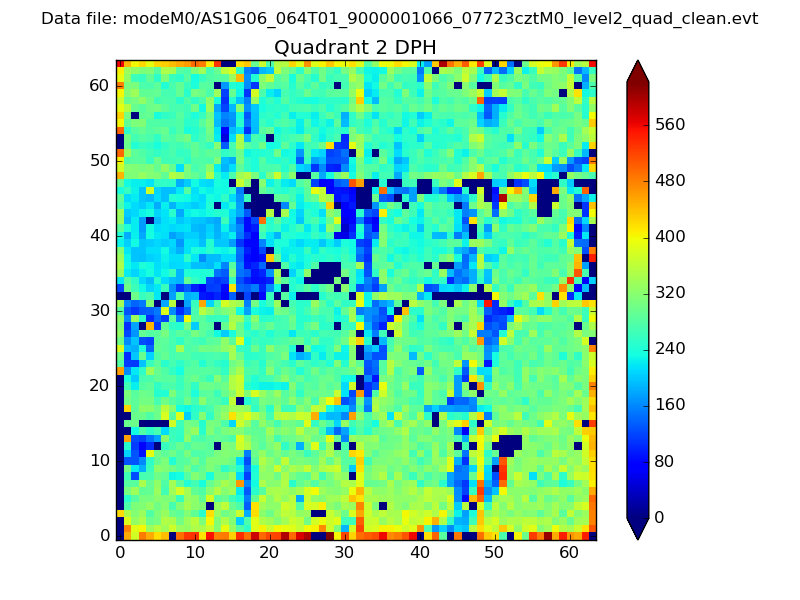
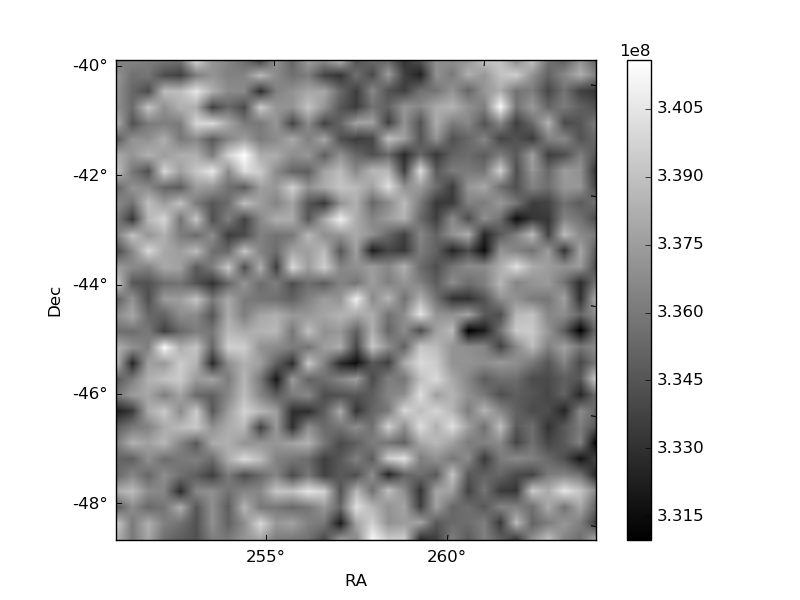
Histogram calculated using DETX and DETY for each event in the final _common_clean file
| Quadrant A | 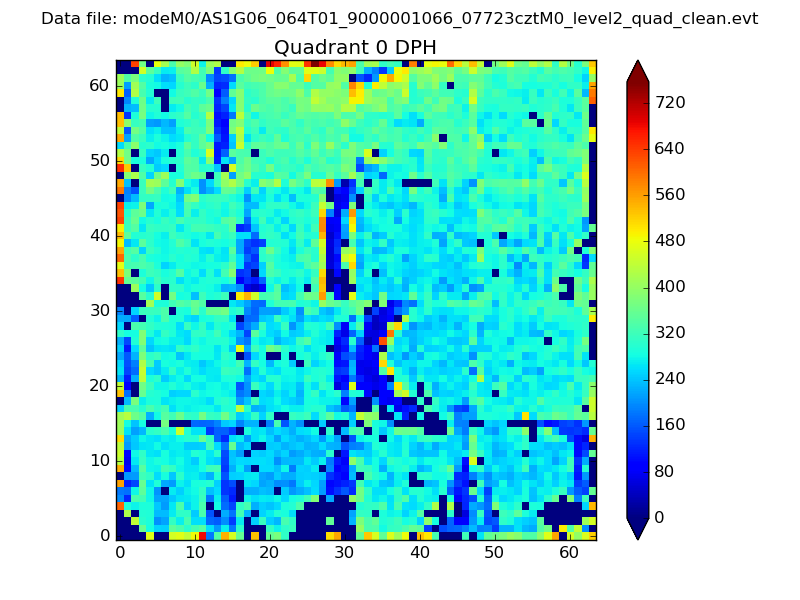 |
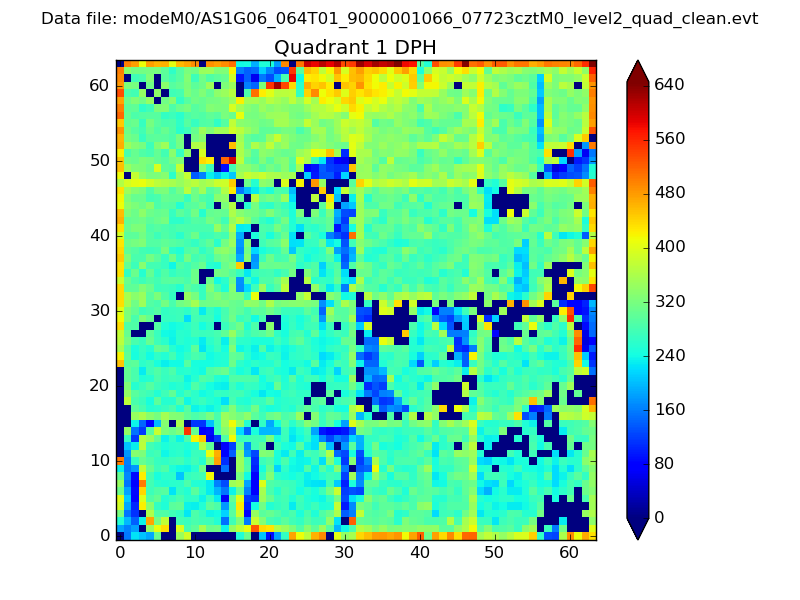 |
Quadrant B |
|---|---|---|---|
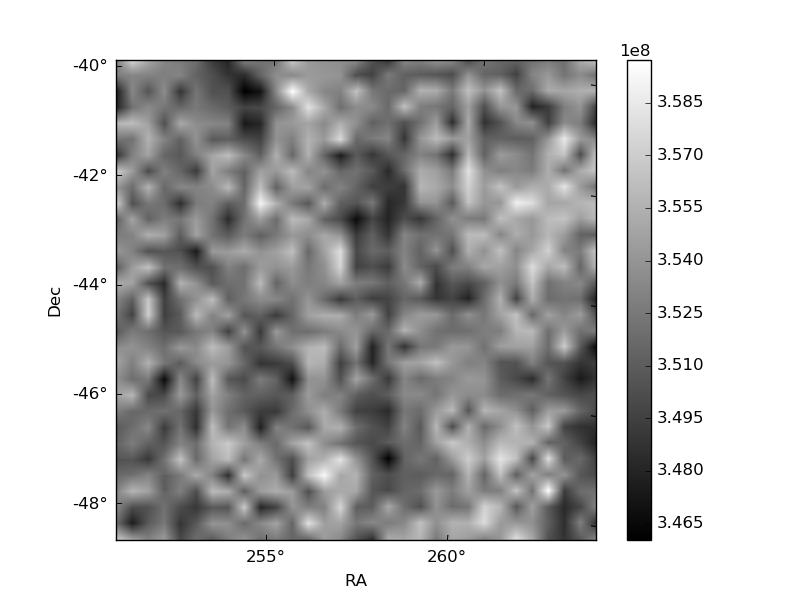
| Quadrant D | 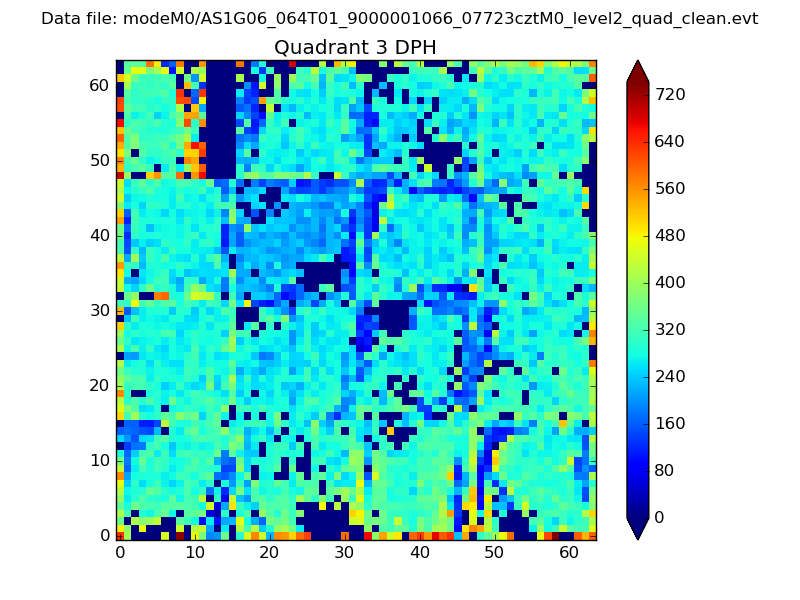 |
 |
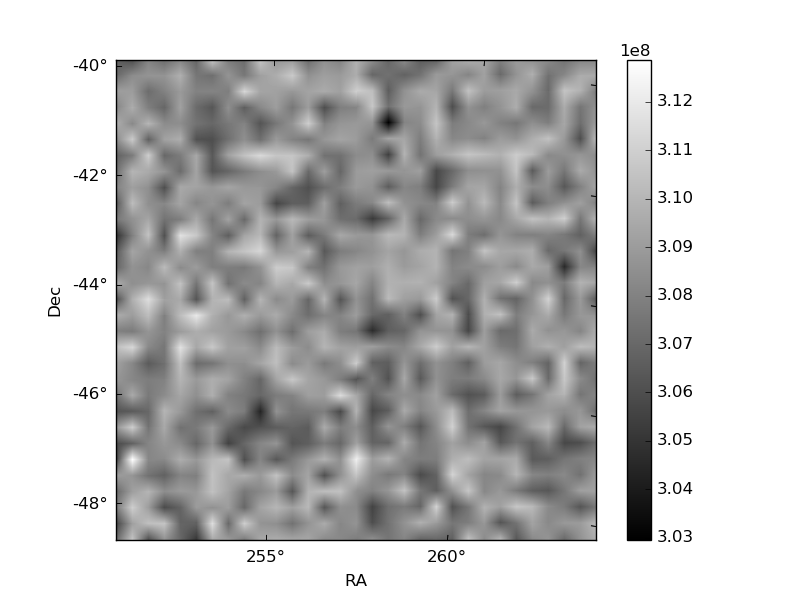
Quadrant C |
| Plot type | Count rate plots | Images |
|---|---|---|
| Comparison with Poisson distribution Blue bars denote a histogram of data divided into 1 sec bins. Red curve is a Poisson curve with rate = median count rate of data. |
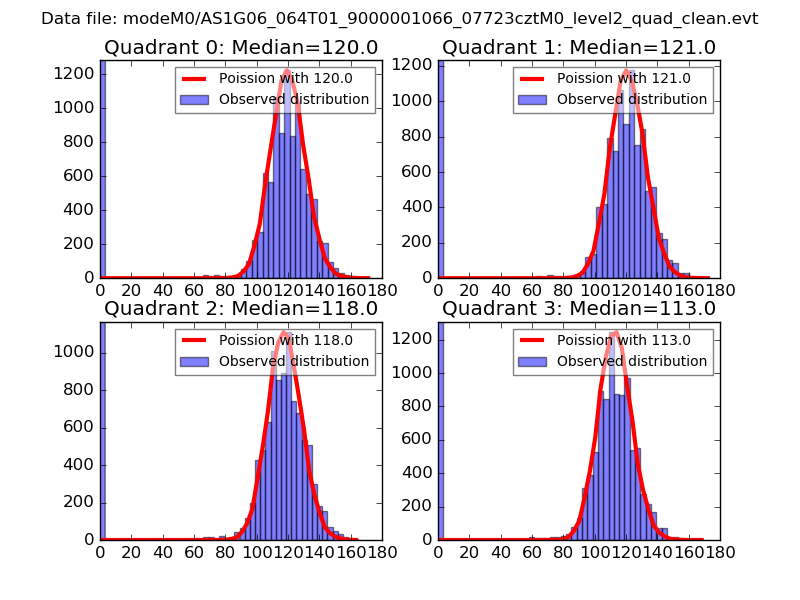 |
 |
| Quadrant-wise count rates Data is divided into 100 sec bins |
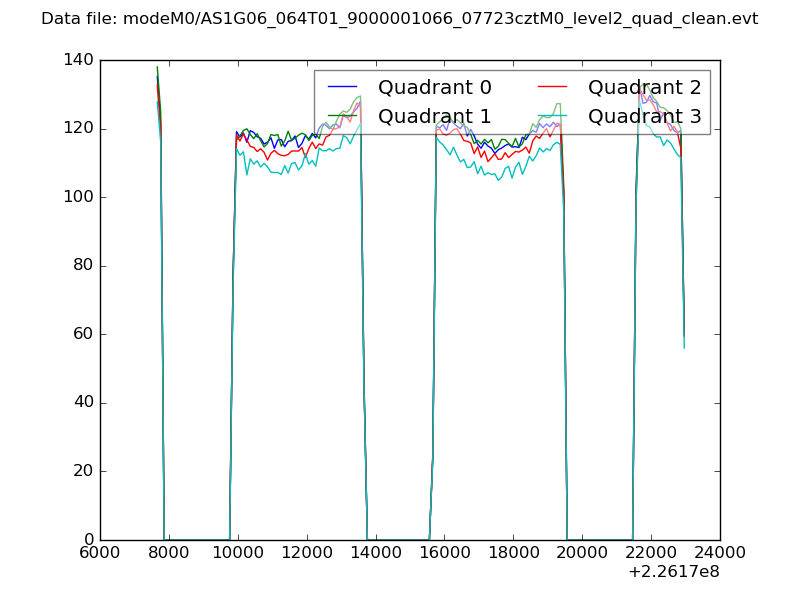 |
|
| Module-wise count rates for Quadrant A Data is divided into 100 sec bins |
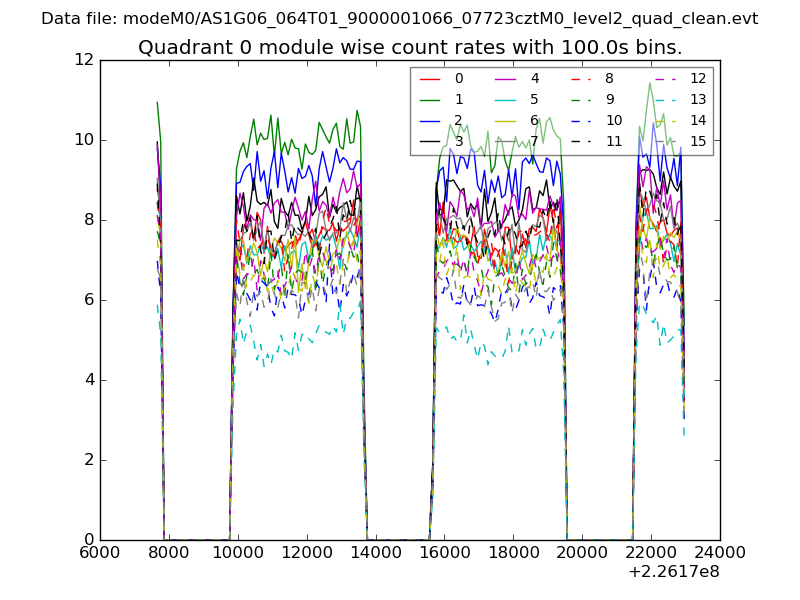 |
 |
| Module-wise count rates for Quadrant B Data is divided into 100 sec bins |
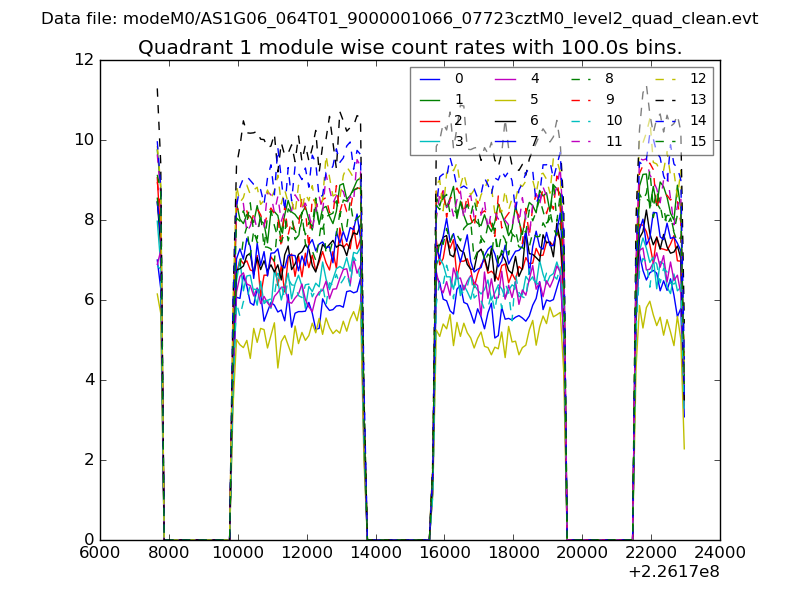 |
 |
| Module-wise count rates for Quadrant C Data is divided into 100 sec bins |
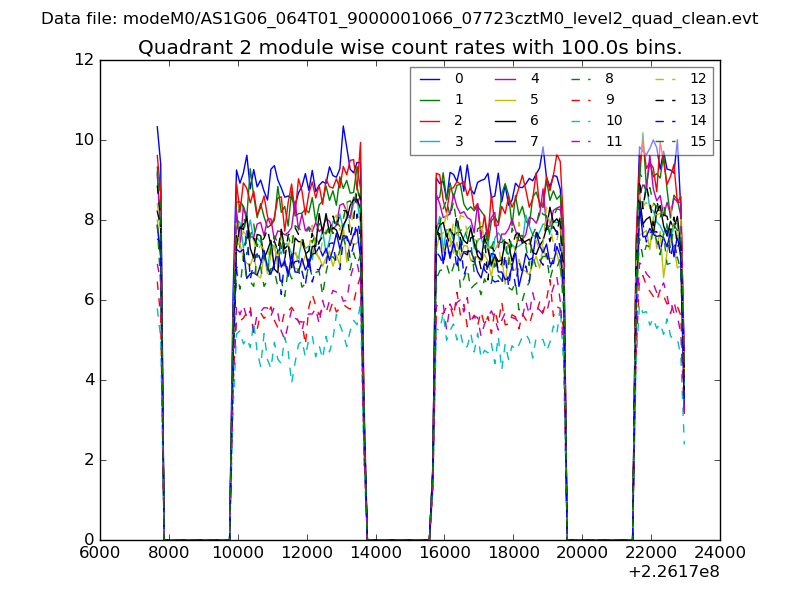 |
 |
| Module-wise count rates for Quadrant D Data is divided into 100 sec bins |
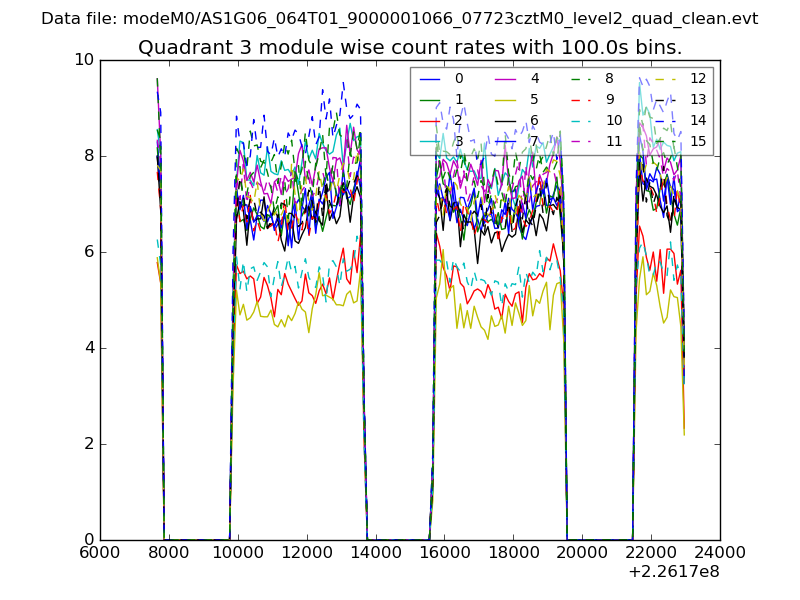 |
 |
| Parameter | Plot |
|---|---|
| CZT HV Monitor | 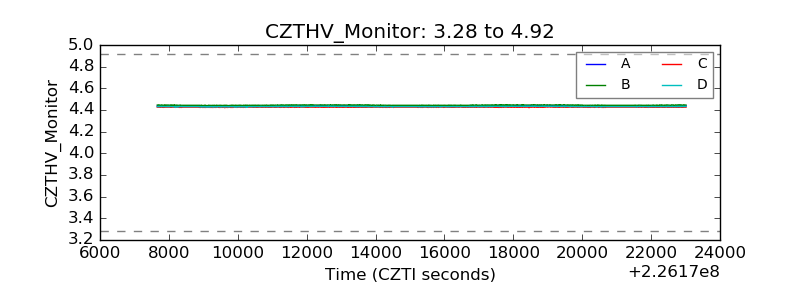 |
| D_VDD |  |
| Temperature 1 | 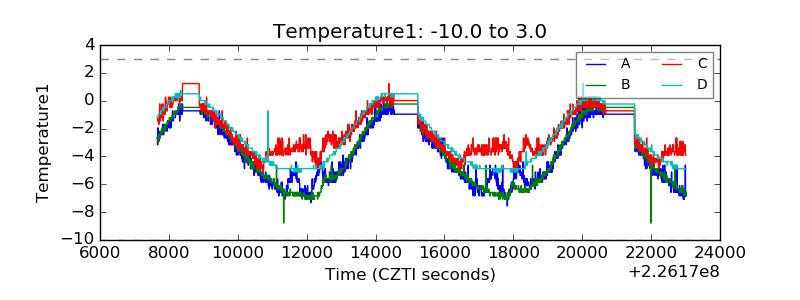 |
| Veto HV Monitor | 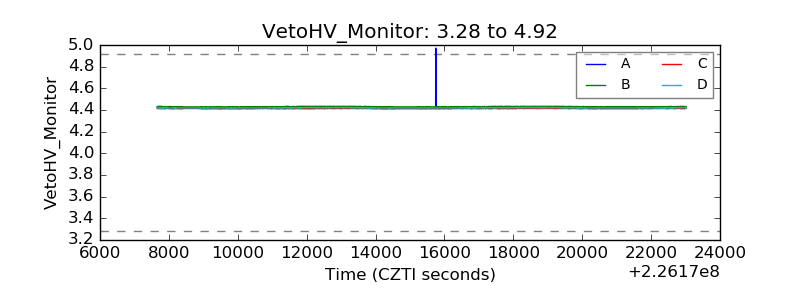 |
| Veto LLD | 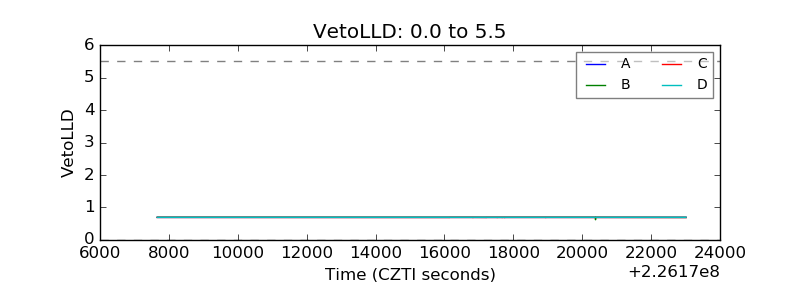 |
| Alpha Counter | 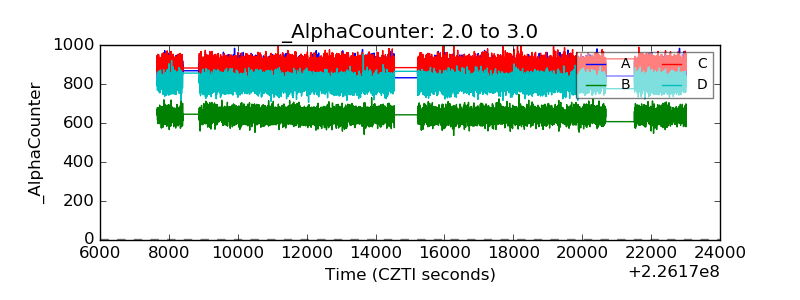 |
| _CPM_Rate | 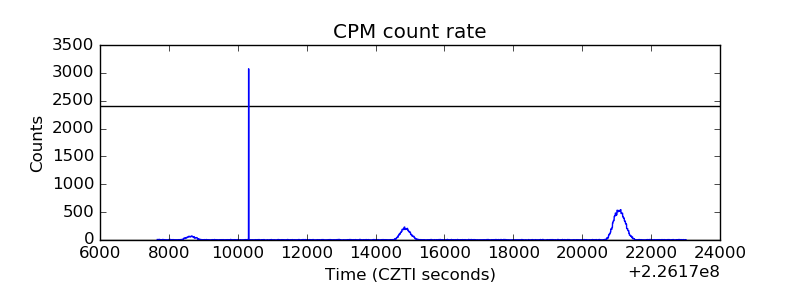 |
| CZT Counter | 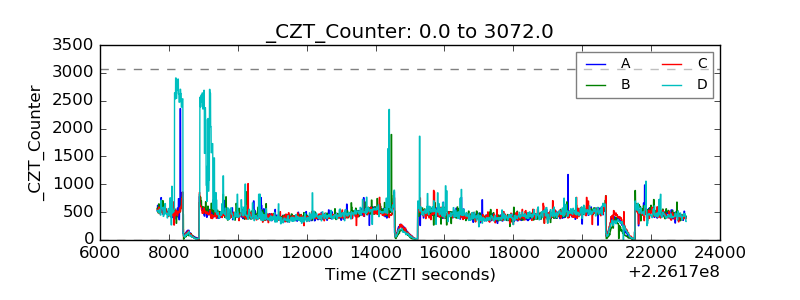 |
| +2.5 Volts monitor |  |
| +5 Volts monitor |  |
| _ROLL_ROT | 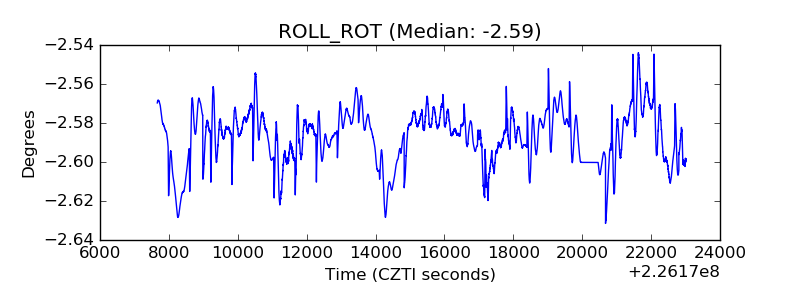 |
| _Roll_DEC | 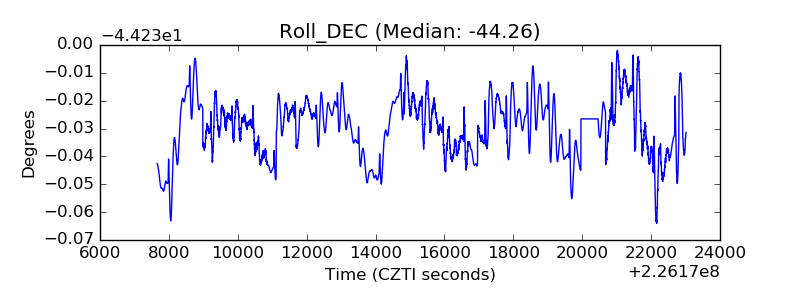 |
| _Roll_RA | 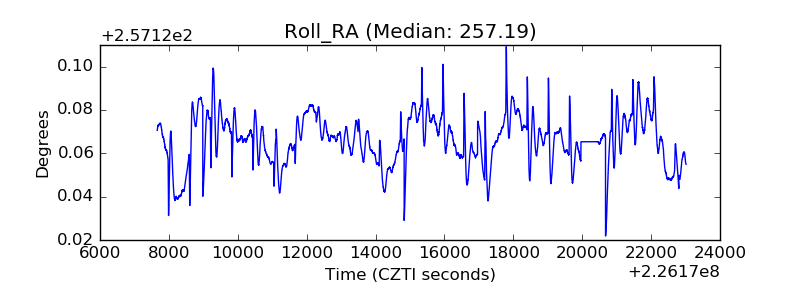 |
| Veto Counter | 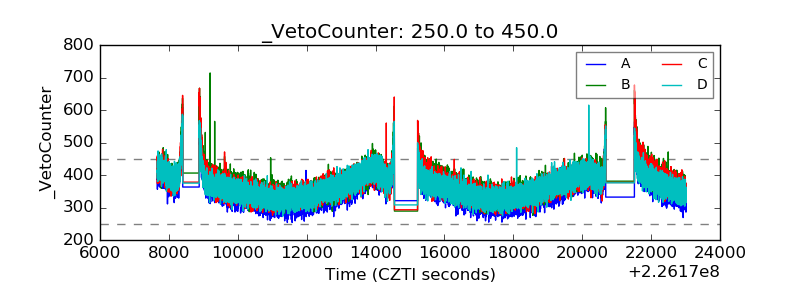 |