| Param | Original file | Final file |
|---|---|---|
| Filename | modeM0/AS1G06_064T01_9000001066_07724cztM0_level2.evt | modeM0/AS1G06_064T01_9000001066_07724cztM0_level2_quad_clean.evt |
| Size (bytes) | 431,835,840 | 98,962,560 |
| Size | 411.8 MB | 94.4 MB |
| Events in quadrant A | 3,093,733 | 638,910 |
| Events in quadrant B | 3,216,457 | 653,134 |
| Events in quadrant C | 3,052,238 | 633,414 |
| Events in quadrant D | 3,255,977 | 600,637 |
| Mode SS | |||
|---|---|---|---|
| Quadrant | BADHDUFLAG | Total packets | Discarded packets |
| A | 0 | 138 | 0 |
| B | 0 | 138 | 0 |
| C | 0 | 138 | 0 |
| D | 0 | 138 | 0 |
| Mode M0 | |||
|---|---|---|---|
| Quadrant | BADHDUFLAG | Total packets | Discarded packets |
| A | 0 | 13841 | 3 |
| B | 0 | 14091 | 2 |
| C | 0 | 13704 | 2 |
| D | 0 | 14342 | 2 |
| Mode M9 | |||
|---|---|---|---|
| Quadrant | BADHDUFLAG | Total packets | Discarded packets |
| A | 0 | 19 | 0 |
| B | 0 | 19 | 0 |
| C | 0 | 19 | 0 |
| D | 0 | 19 | 0 |
| Quadrant | Total seconds | Saturated seconds | Saturation percentage |
|---|---|---|---|
| A | 6762 | 20 | 0.295770% |
| B | 6762 | 40 | 0.591541% |
| C | 6762 | 10 | 0.147885% |
| D | 6762 | 26 | 0.384502% |
Noise dominated data is calculated using 1-second bins in cleaned event files. If a bin has >2000 counts, and if more than 50% of those come from <1% of pixels, then it is considered to be noise-dominated and hence unusable.
| Quadrant | # 1 sec bins | Bins with >0 counts | Bins with >2000 counts | High rate bins dominated by noise | Noise dominated (total time) | Noise dominated (detector-on time) | Marked lightcurve |
|---|---|---|---|---|---|---|---|
| A | 8592 | 6764 | 1 | 1 | 0.01% | 0.01% | 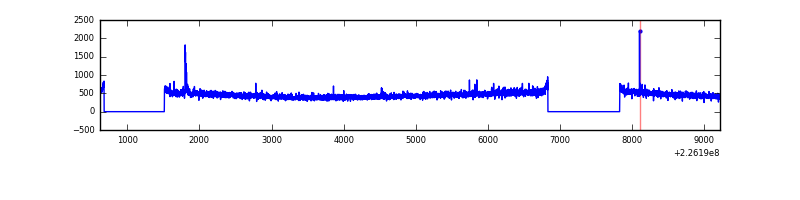 |
| B | 8592 | 6764 | 2 | 2 | 0.02% | 0.03% |  |
| C | 8592 | 6764 | 0 | 0 | 0.00% | 0.00% |  |
| D | 8592 | 6764 | 11 | 11 | 0.13% | 0.16% | 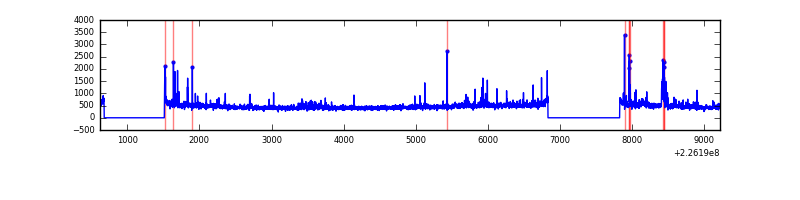 |
Top three noisy pixels from each quadrant. If the there are fewer than three noisy pixels in the level2.evt file, extra rows are filled as -1
| Pixel properties | Quadrant properties | ||||||
|---|---|---|---|---|---|---|---|
| Quadrant | DetID | PixID | Counts | Sigma | Mean | Median | Sigma |
| A | 15 | 234 | 25144 | 148.38 | 794 | 776 | 164.2 |
| A | 3 | 1 | 8389 | 46.36 | 794 | 776 | 164.2 |
| A | 0 | 226 | 7623 | 41.69 | 794 | 776 | 164.2 |
| B | 0 | 229 | 27469 | 174.61 | 805 | 788 | 152.8 |
| B | 0 | 214 | 17433 | 108.93 | 805 | 788 | 152.8 |
| B | 12 | 111 | 14801 | 91.71 | 805 | 788 | 152.8 |
| C | 9 | 68 | 9756 | 49.57 | 777 | 781 | 181.0 |
| C | 13 | 61 | 5878 | 28.15 | 777 | 781 | 181.0 |
| C | 8 | 128 | 4792 | 22.15 | 777 | 781 | 181.0 |
| D | 8 | 195 | 104031 | 545.64 | 770 | 746 | 189.3 |
| D | 13 | 105 | 78467 | 410.59 | 770 | 746 | 189.3 |
| D | 13 | 104 | 36184 | 187.21 | 770 | 746 | 189.3 |
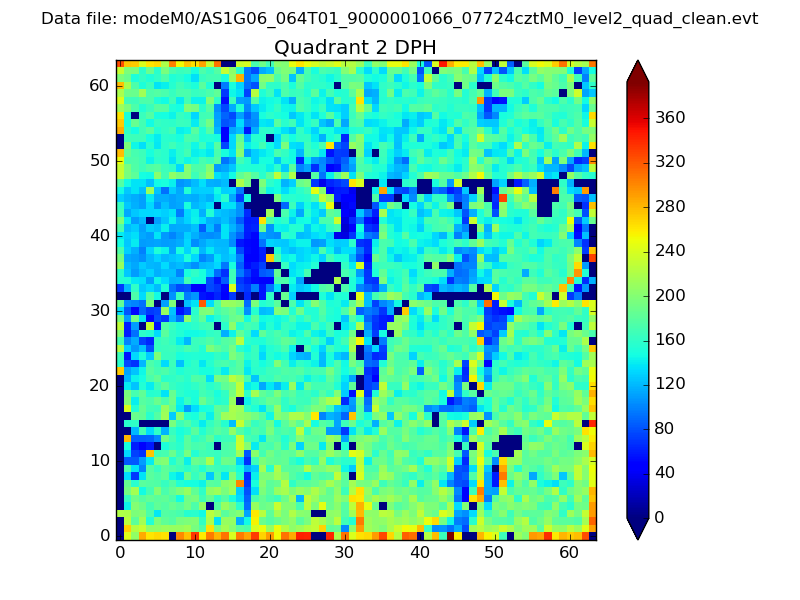
Histogram calculated using DETX and DETY for each event in the final _common_clean file
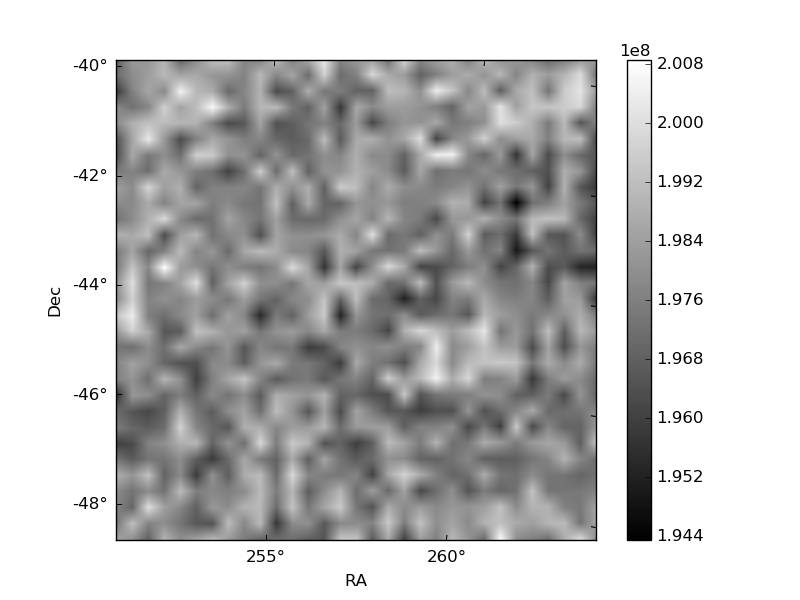
| Quadrant A | 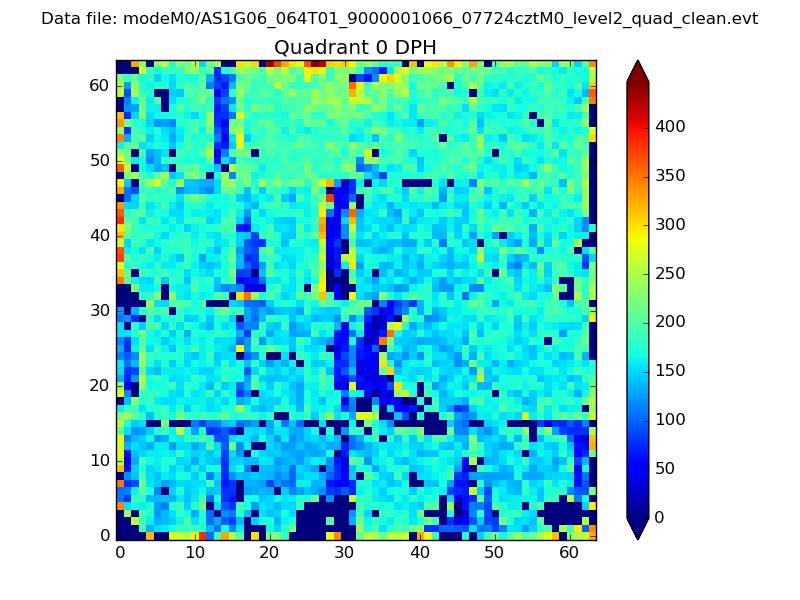 |
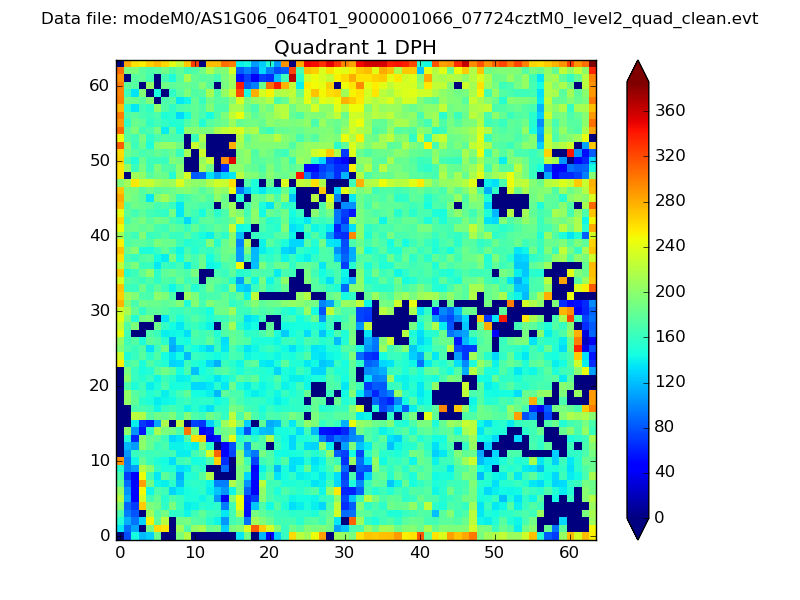 |
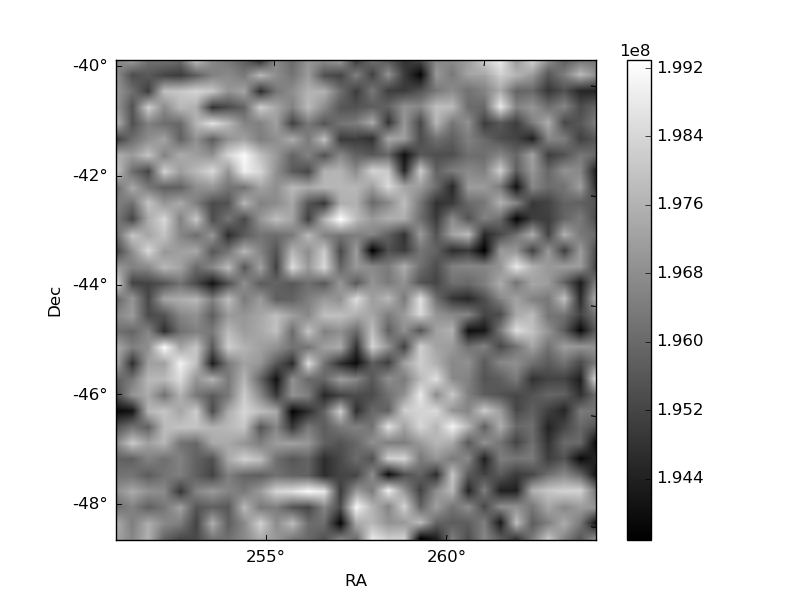
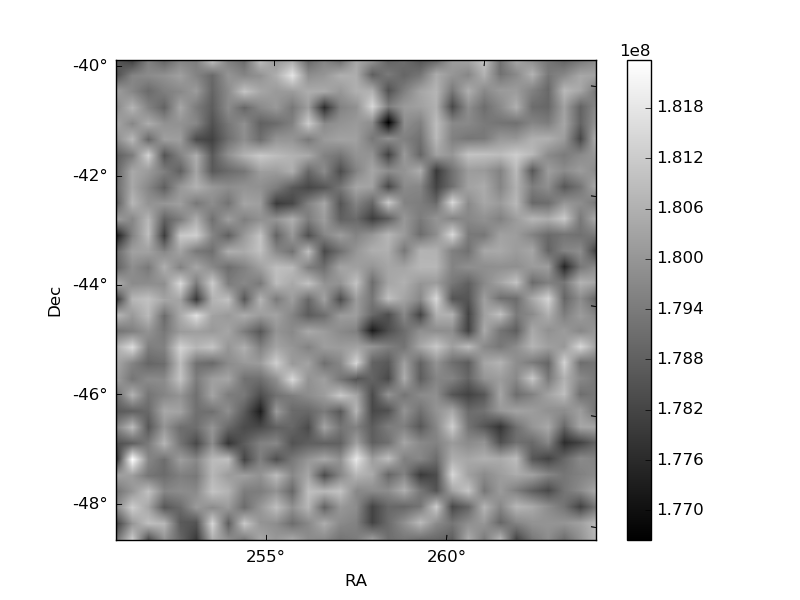
Quadrant B |
|---|---|---|---|
| Quadrant D |  |
 |
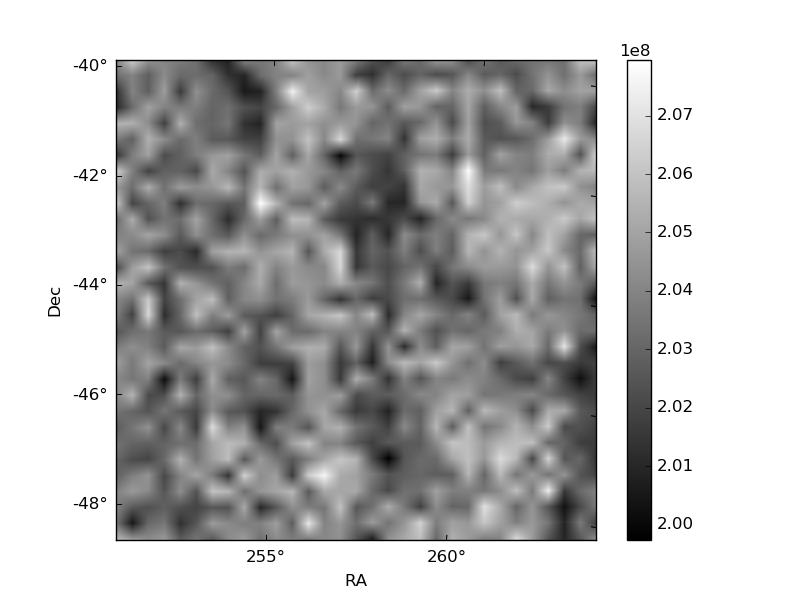
Quadrant C |
| Plot type | Count rate plots | Images |
|---|---|---|
| Comparison with Poisson distribution Blue bars denote a histogram of data divided into 1 sec bins. Red curve is a Poisson curve with rate = median count rate of data. |
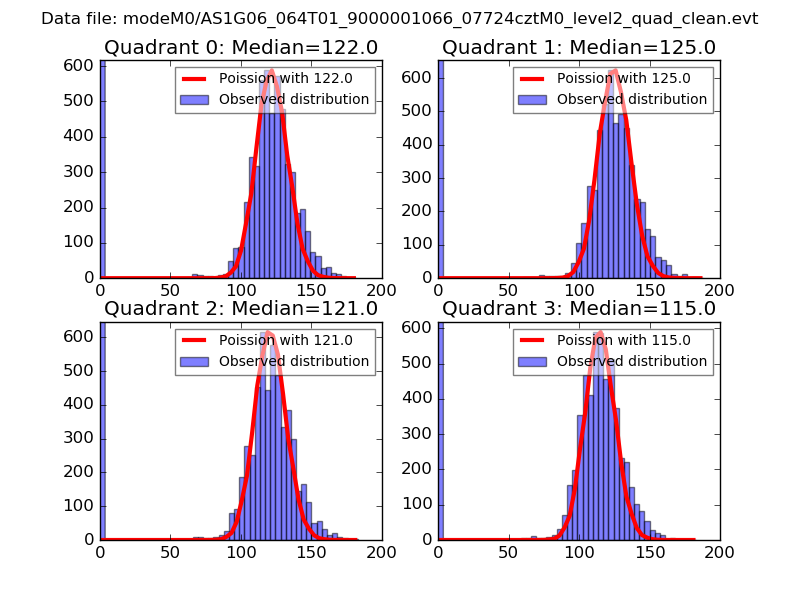 |
 |
| Quadrant-wise count rates Data is divided into 100 sec bins |
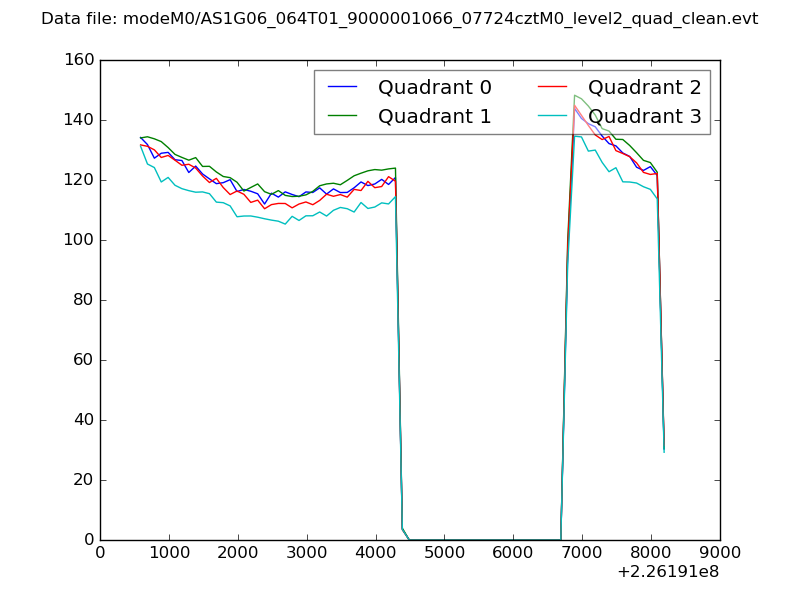 |
|
| Module-wise count rates for Quadrant A Data is divided into 100 sec bins |
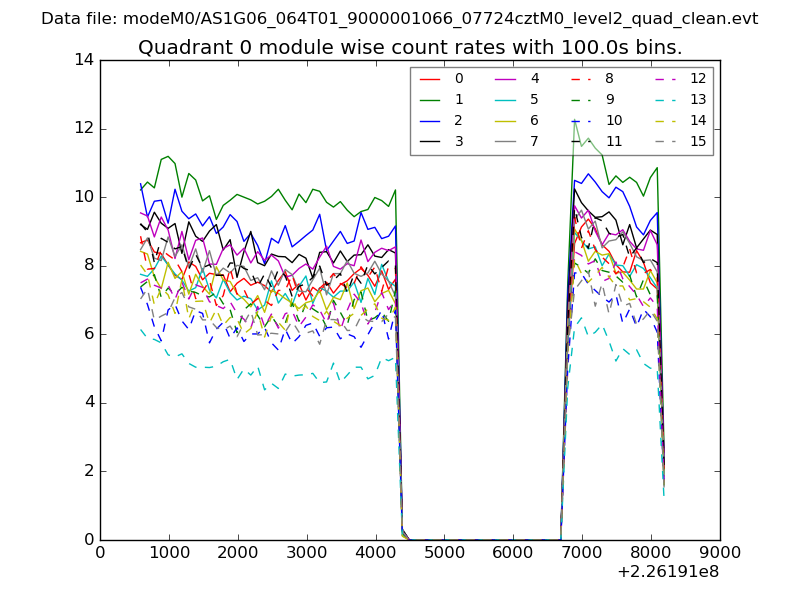 |
 |
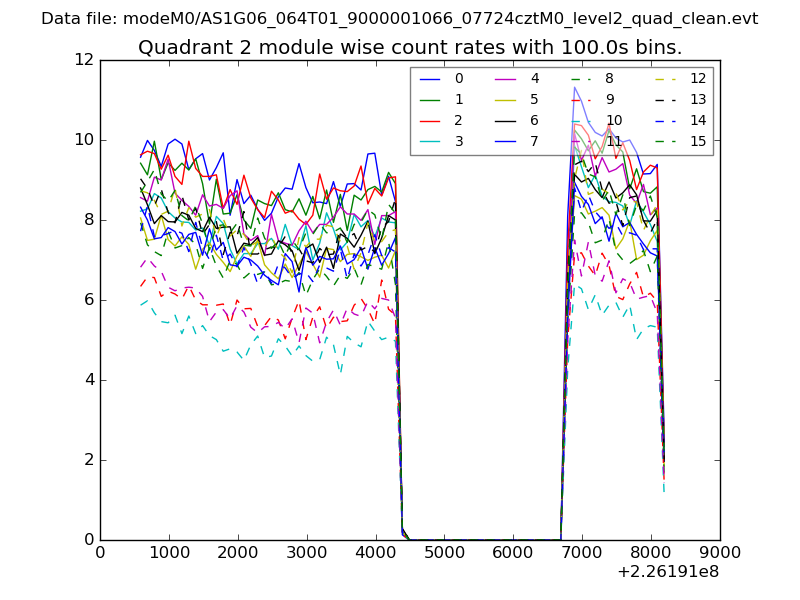
| Module-wise count rates for Quadrant B Data is divided into 100 sec bins |
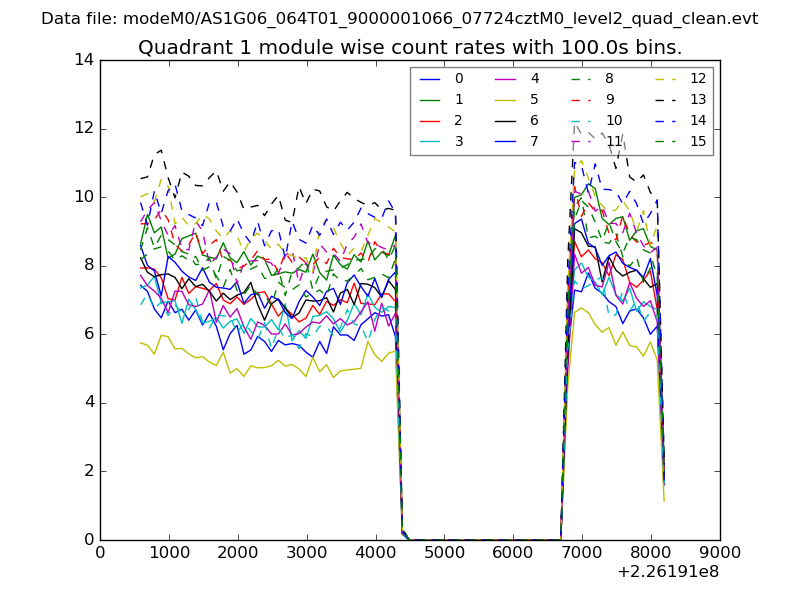 |
 |
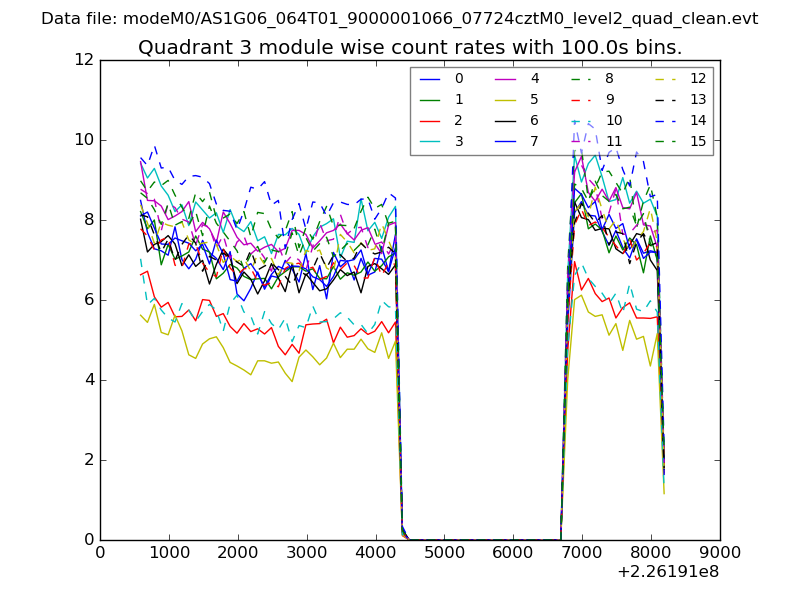
| Module-wise count rates for Quadrant C Data is divided into 100 sec bins |
 |
 |
| Module-wise count rates for Quadrant D Data is divided into 100 sec bins |
 |
 |
| Parameter | Plot |
|---|---|
| CZT HV Monitor | 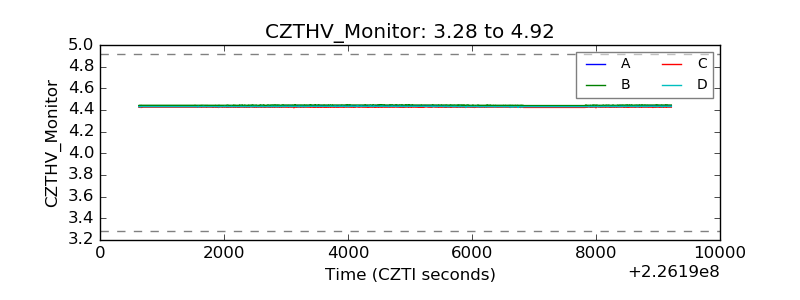 |
| D_VDD | 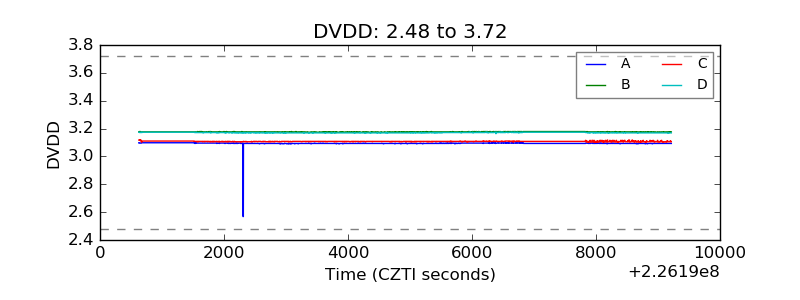 |
| Temperature 1 | 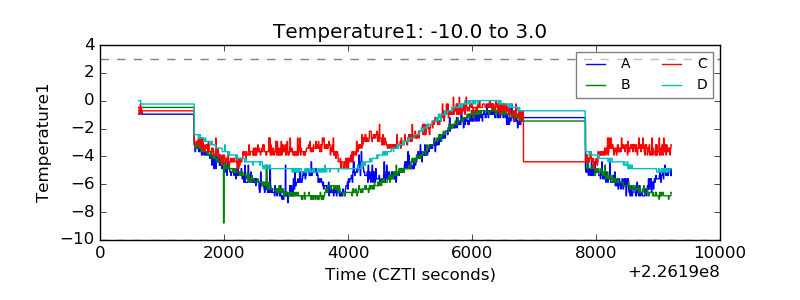 |
| Veto HV Monitor | 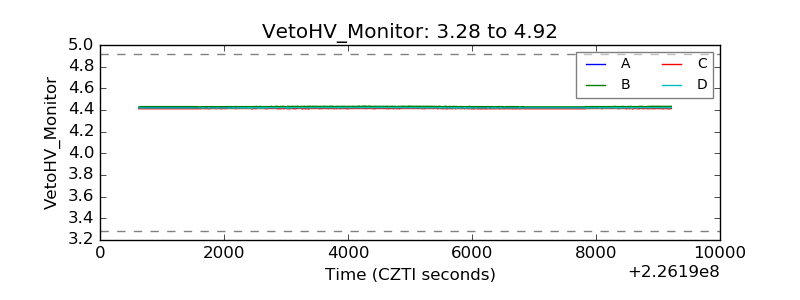 |
| Veto LLD | 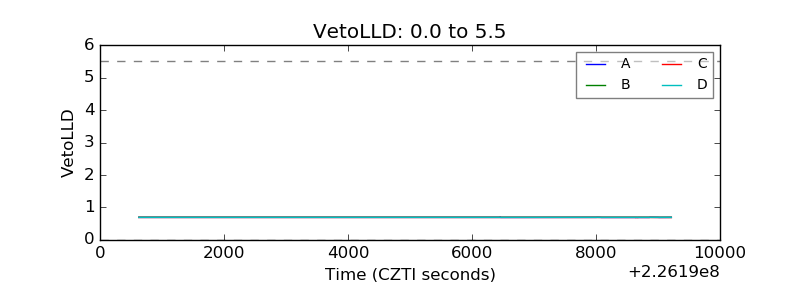 |
| Alpha Counter | 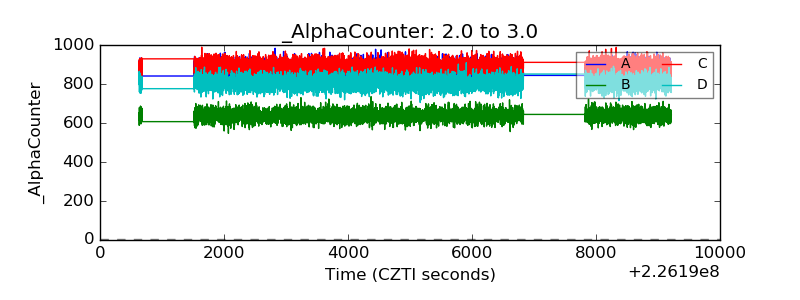 |
| _CPM_Rate | 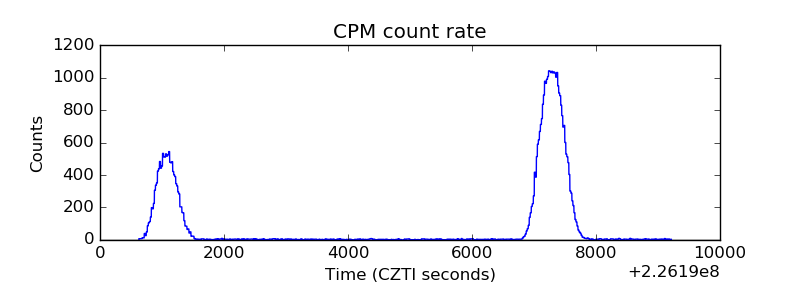 |
| CZT Counter | 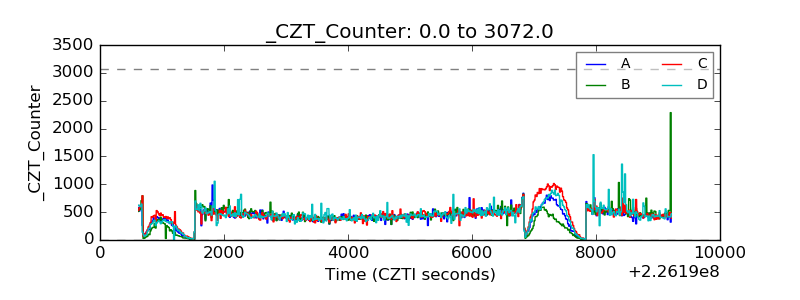 |
| +2.5 Volts monitor |  |
| +5 Volts monitor |  |
| _ROLL_ROT | 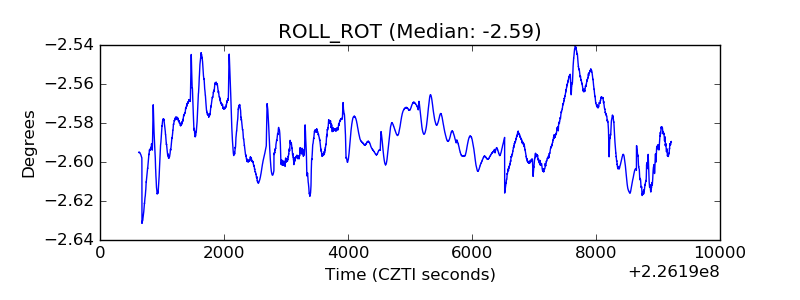 |
| _Roll_DEC | 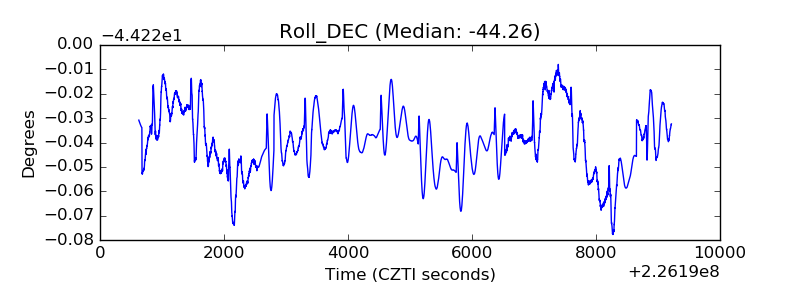 |
| _Roll_RA | 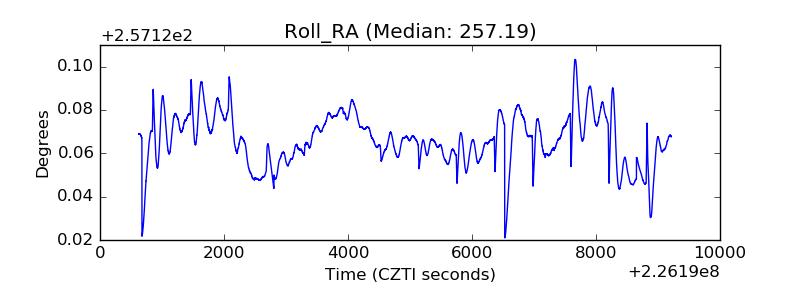 |
| Veto Counter | 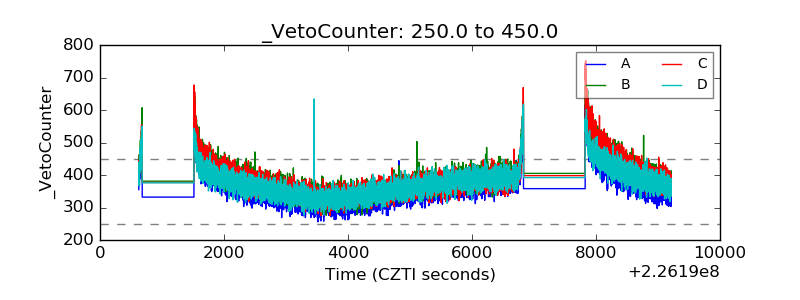 |