| Param | Original file | Final file |
|---|---|---|
| Filename | modeM0/AS1G06_064T01_9000001066_07726cztM0_level2.evt | modeM0/AS1G06_064T01_9000001066_07726cztM0_level2_quad_clean.evt |
| Size (bytes) | 439,827,840 | 95,915,520 |
| Size | 419.5 MB | 91.5 MB |
| Events in quadrant A | 3,124,882 | 612,070 |
| Events in quadrant B | 3,247,463 | 630,544 |
| Events in quadrant C | 3,130,402 | 612,744 |
| Events in quadrant D | 3,360,492 | 580,872 |
| Mode SS | |||
|---|---|---|---|
| Quadrant | BADHDUFLAG | Total packets | Discarded packets |
| A | 0 | 136 | 0 |
| B | 0 | 136 | 0 |
| C | 0 | 136 | 0 |
| D | 0 | 136 | 0 |
| Mode M0 | |||
|---|---|---|---|
| Quadrant | BADHDUFLAG | Total packets | Discarded packets |
| A | 0 | 13816 | 3 |
| B | 0 | 14054 | 2 |
| C | 0 | 13733 | 2 |
| D | 0 | 14443 | 2 |
| Mode M9 | |||
|---|---|---|---|
| Quadrant | BADHDUFLAG | Total packets | Discarded packets |
| A | 0 | 22 | 0 |
| B | 0 | 22 | 0 |
| C | 0 | 22 | 0 |
| D | 0 | 22 | 0 |
| Quadrant | Total seconds | Saturated seconds | Saturation percentage |
|---|---|---|---|
| A | 6730 | 29 | 0.430906% |
| B | 6730 | 51 | 0.757801% |
| C | 6730 | 17 | 0.252600% |
| D | 6730 | 33 | 0.490342% |
Noise dominated data is calculated using 1-second bins in cleaned event files. If a bin has >2000 counts, and if more than 50% of those come from <1% of pixels, then it is considered to be noise-dominated and hence unusable.
| Quadrant | # 1 sec bins | Bins with >0 counts | Bins with >2000 counts | High rate bins dominated by noise | Noise dominated (total time) | Noise dominated (detector-on time) | Marked lightcurve |
|---|---|---|---|---|---|---|---|
| A | 8850 | 6732 | 1 | 1 | 0.01% | 0.01% | 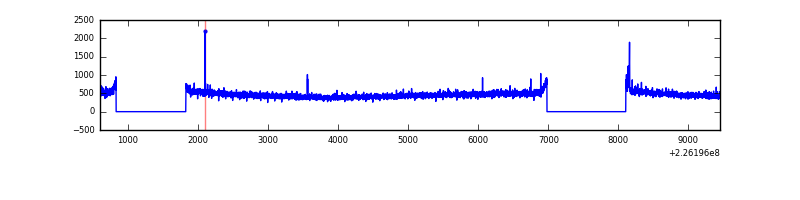 |
| B | 8850 | 6732 | 6 | 6 | 0.07% | 0.09% | 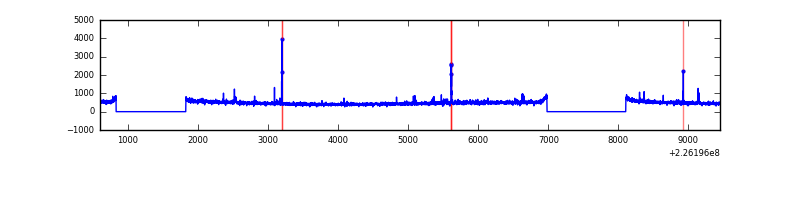 |
| C | 8850 | 6732 | 0 | 0 | 0.00% | 0.00% | 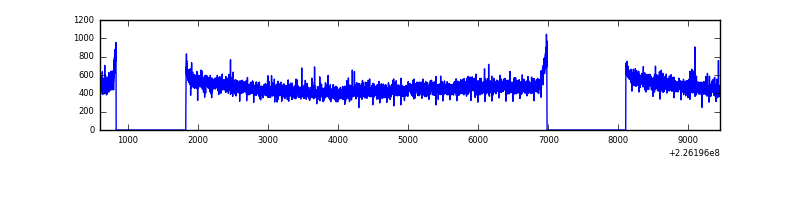 |
| D | 8850 | 6732 | 12 | 12 | 0.14% | 0.18% | 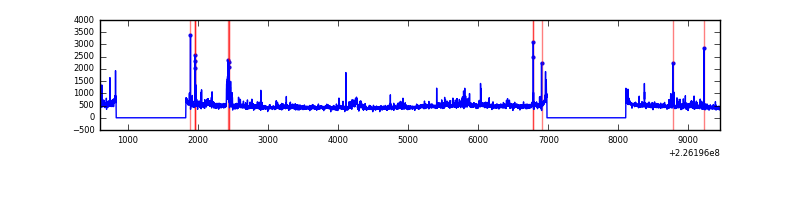 |
Top three noisy pixels from each quadrant. If the there are fewer than three noisy pixels in the level2.evt file, extra rows are filled as -1
| Pixel properties | Quadrant properties | ||||||
|---|---|---|---|---|---|---|---|
| Quadrant | DetID | PixID | Counts | Sigma | Mean | Median | Sigma |
| A | 15 | 234 | 19892 | 116.29 | 803 | 787 | 164.3 |
| A | 3 | 1 | 8256 | 45.46 | 803 | 787 | 164.3 |
| A | 0 | 226 | 7496 | 40.84 | 803 | 787 | 164.3 |
| B | 0 | 214 | 28470 | 178.64 | 816 | 798 | 154.9 |
| B | 4 | 239 | 17265 | 106.31 | 816 | 798 | 154.9 |
| B | 12 | 111 | 14899 | 91.03 | 816 | 798 | 154.9 |
| C | 8 | 128 | 12031 | 61.09 | 792 | 796 | 183.9 |
| C | 9 | 68 | 11693 | 59.25 | 792 | 796 | 183.9 |
| C | 8 | 112 | 6424 | 30.6 | 792 | 796 | 183.9 |
| D | 13 | 105 | 87977 | 455.95 | 785 | 762 | 191.3 |
| D | 2 | 152 | 83313 | 431.56 | 785 | 762 | 191.3 |
| D | 13 | 104 | 78193 | 404.8 | 785 | 762 | 191.3 |
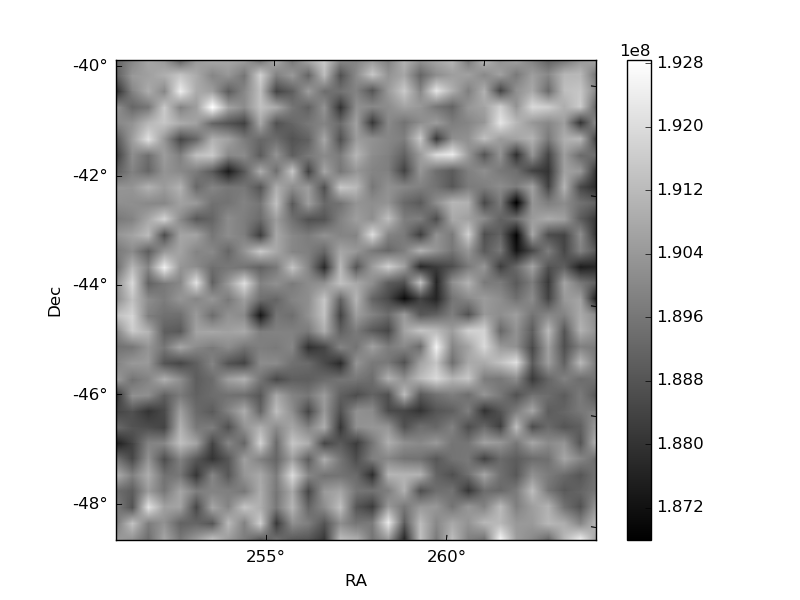
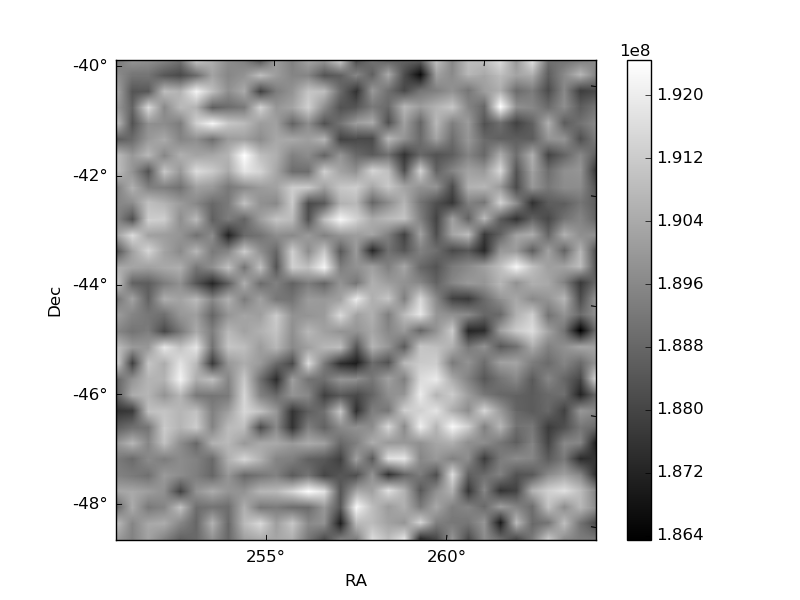
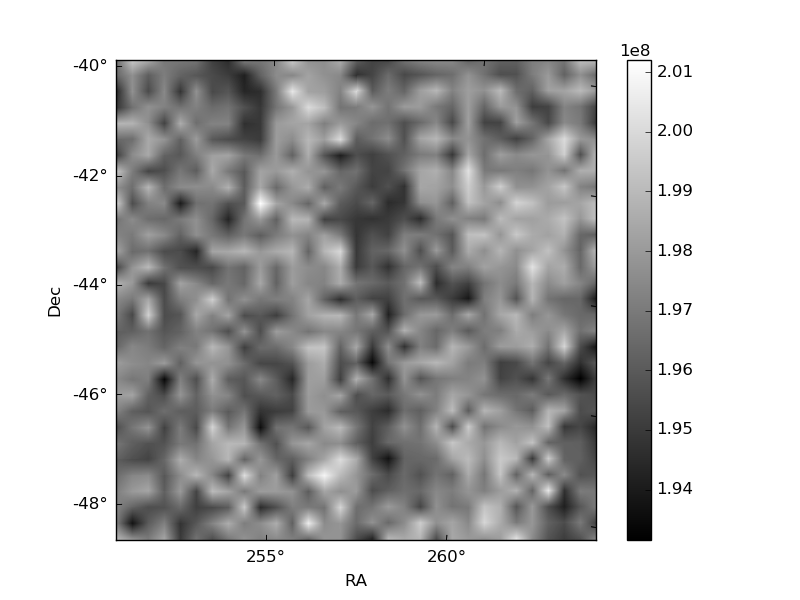
Histogram calculated using DETX and DETY for each event in the final _common_clean file
| Quadrant A | 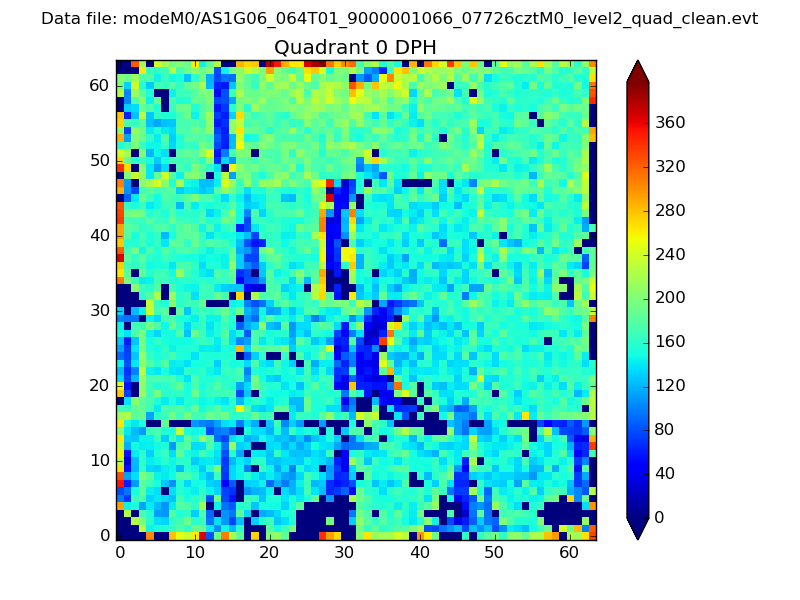 |
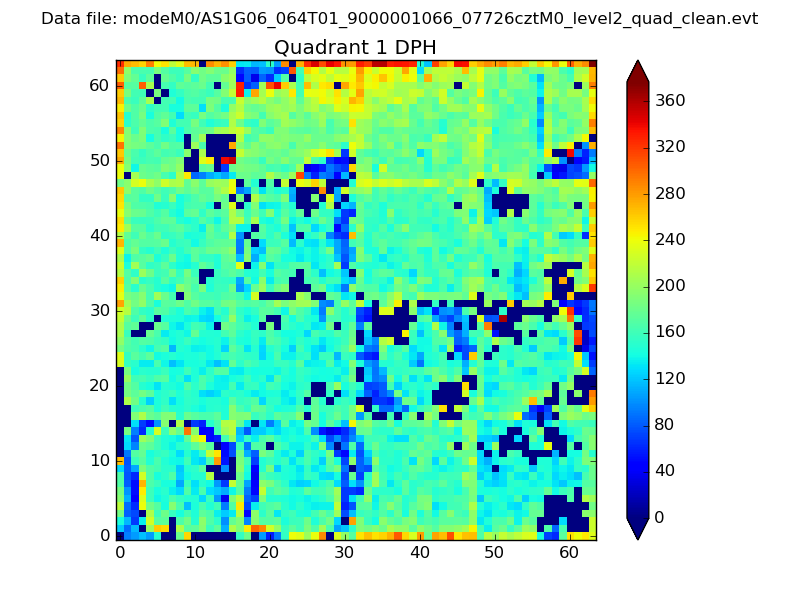 |
Quadrant B |
|---|---|---|---|
| Quadrant D | 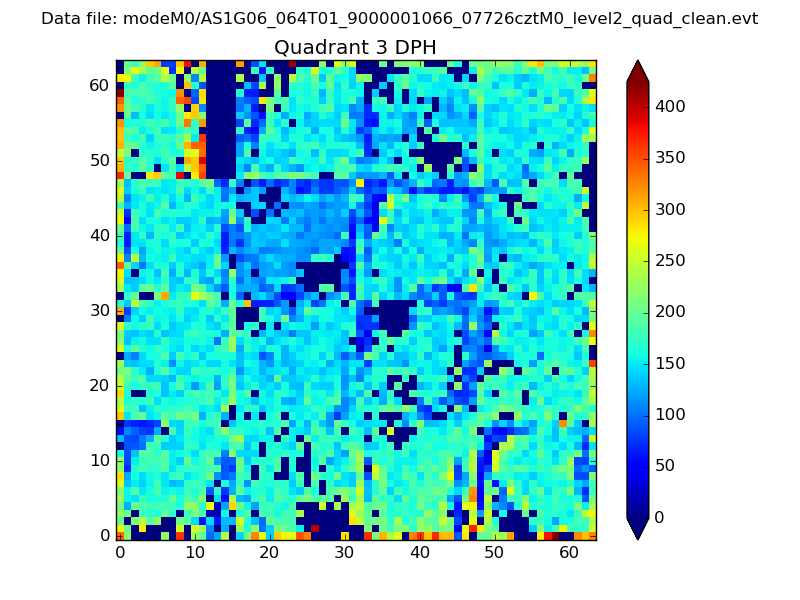 |
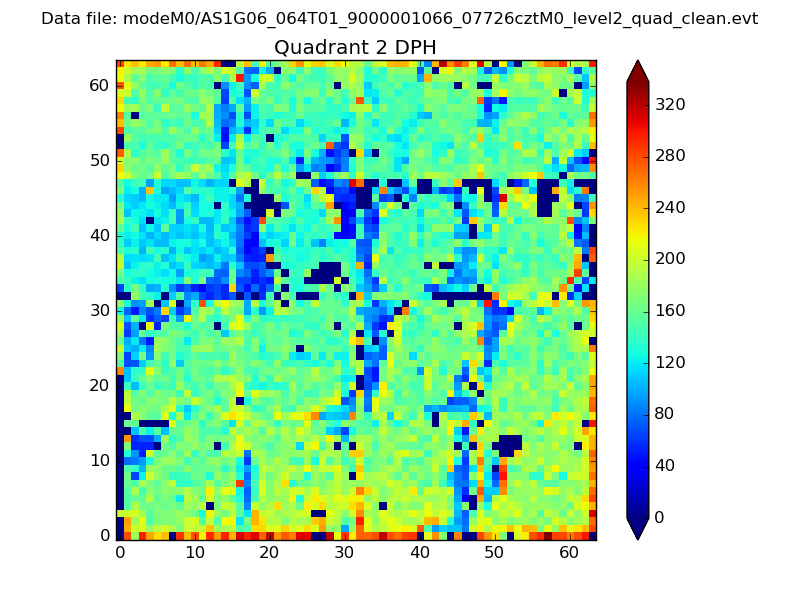 |
Quadrant C |
| Plot type | Count rate plots | Images |
|---|---|---|
| Comparison with Poisson distribution Blue bars denote a histogram of data divided into 1 sec bins. Red curve is a Poisson curve with rate = median count rate of data. |
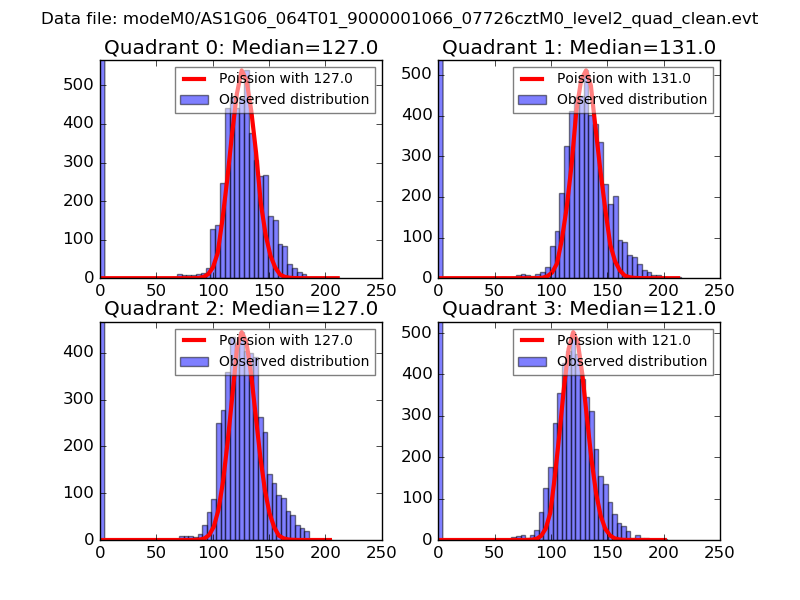 |
 |
| Quadrant-wise count rates Data is divided into 100 sec bins |
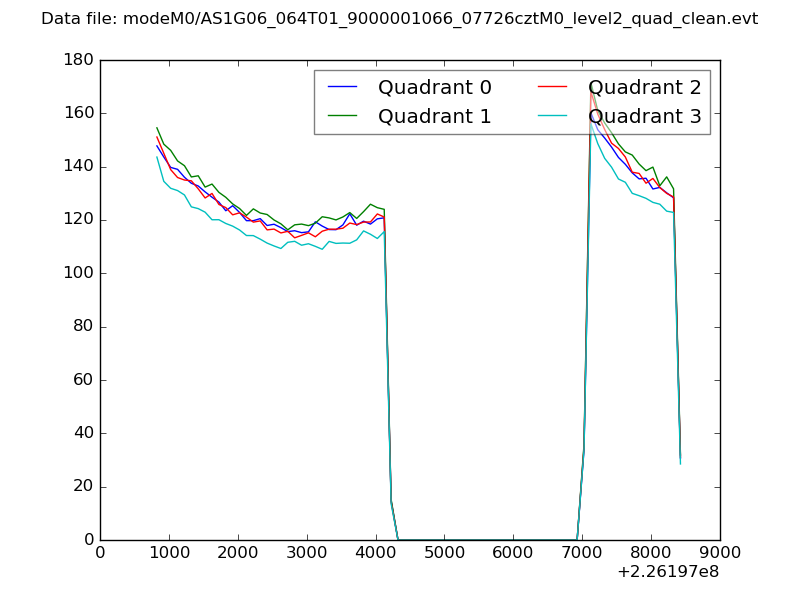 |
|
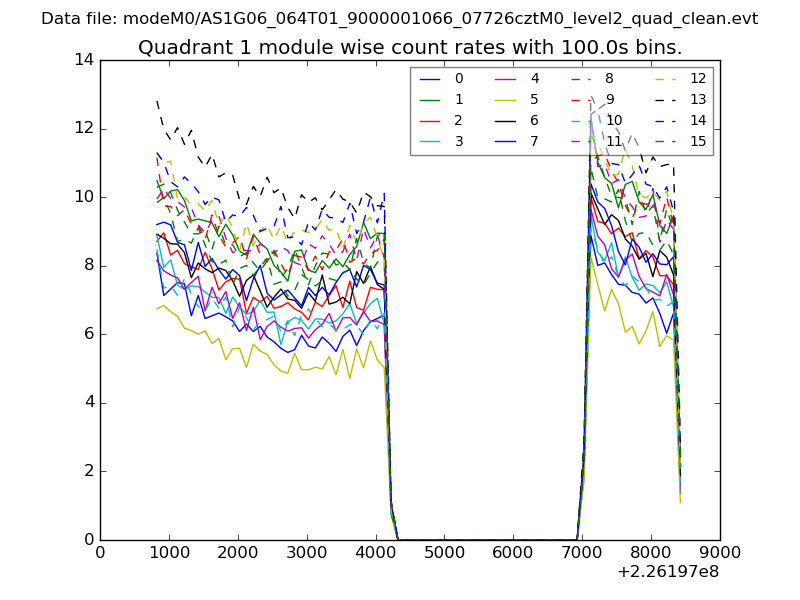
| Module-wise count rates for Quadrant A Data is divided into 100 sec bins |
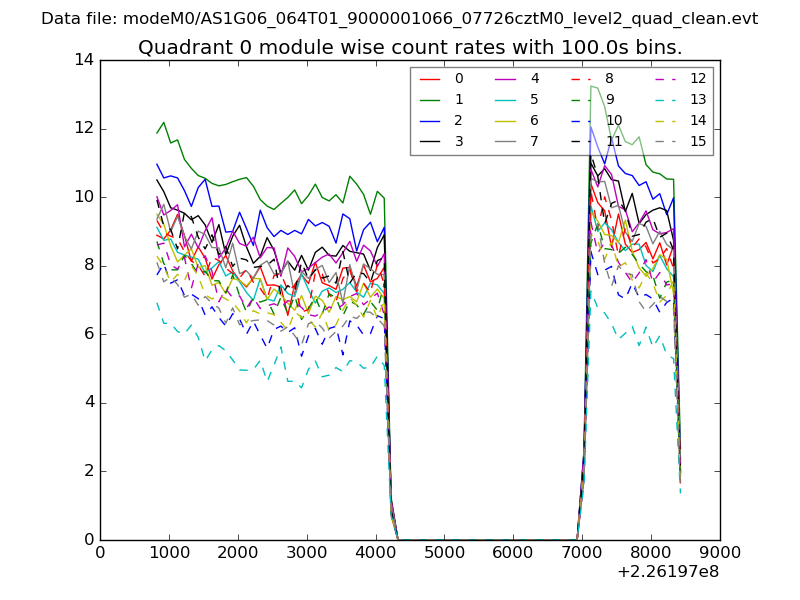 |
 |
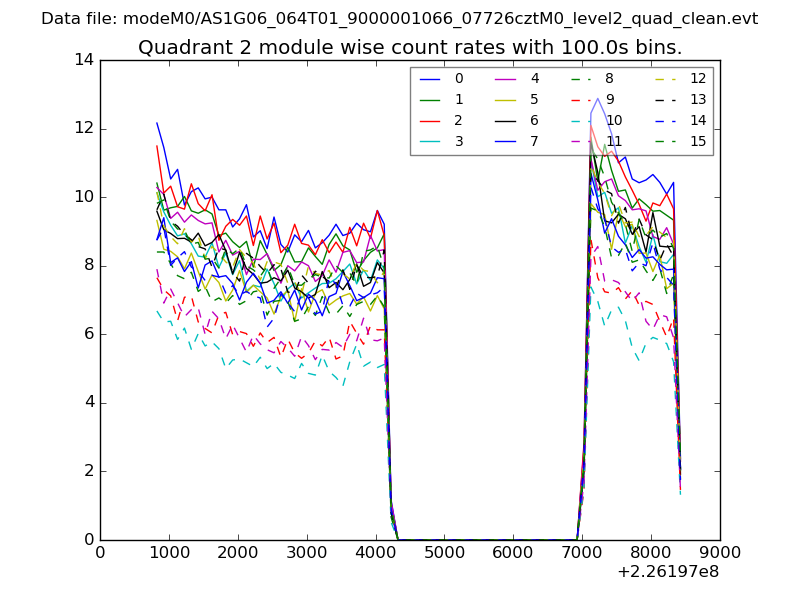
| Module-wise count rates for Quadrant B Data is divided into 100 sec bins |
 |
 |
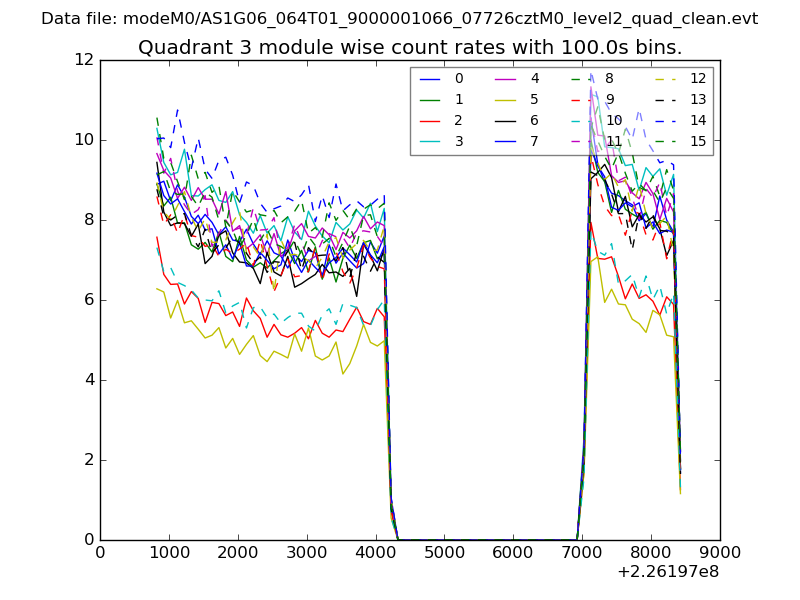
| Module-wise count rates for Quadrant C Data is divided into 100 sec bins |
 |
 |
| Module-wise count rates for Quadrant D Data is divided into 100 sec bins |
 |
 |
| Parameter | Plot |
|---|---|
| CZT HV Monitor | 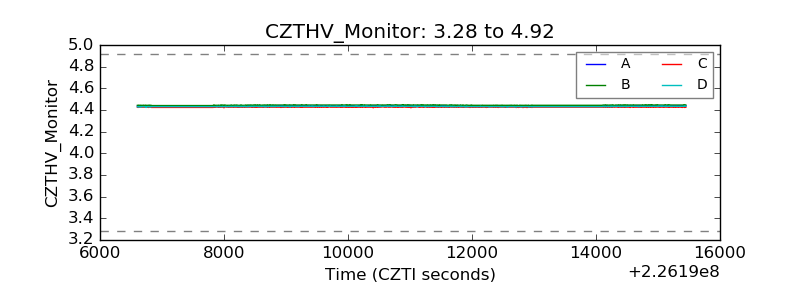 |
| D_VDD | 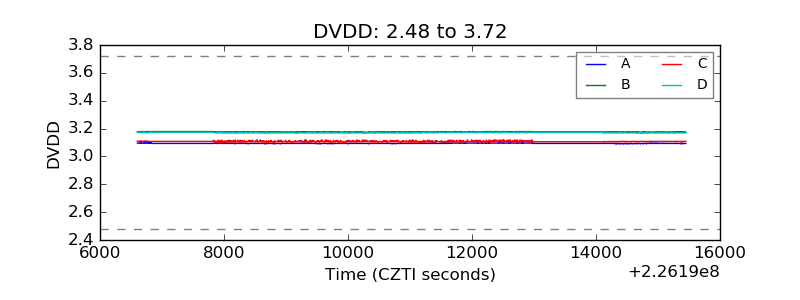 |
| Temperature 1 | 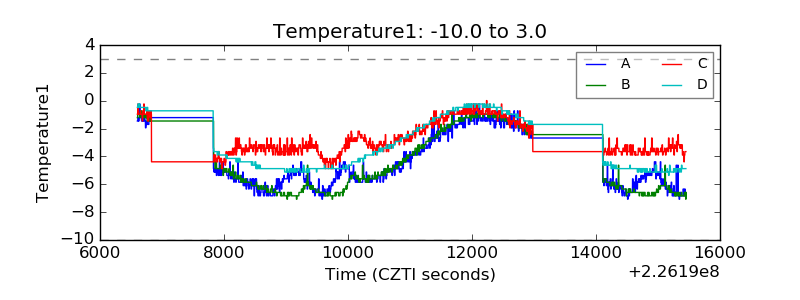 |
| Veto HV Monitor | 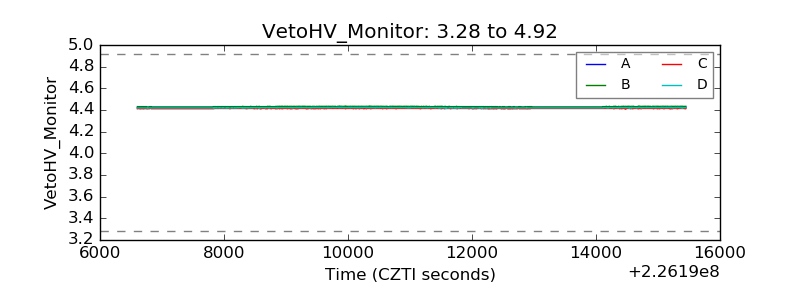 |
| Veto LLD | 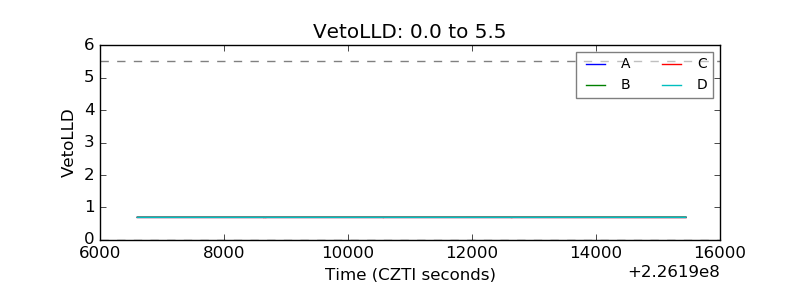 |
| Alpha Counter | 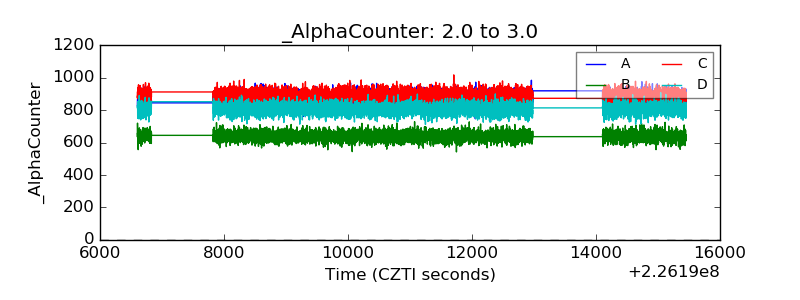 |
| _CPM_Rate |  |
| CZT Counter | 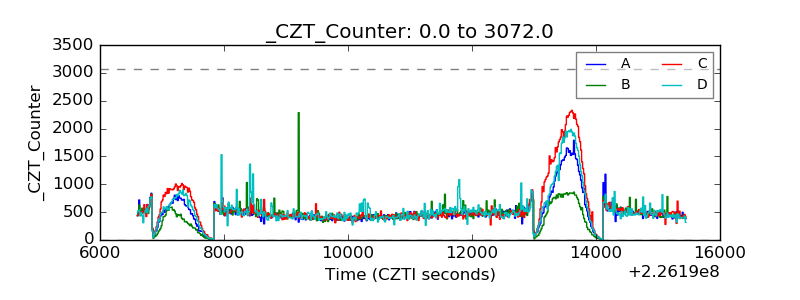 |
| +2.5 Volts monitor |  |
| +5 Volts monitor |  |
| _ROLL_ROT | 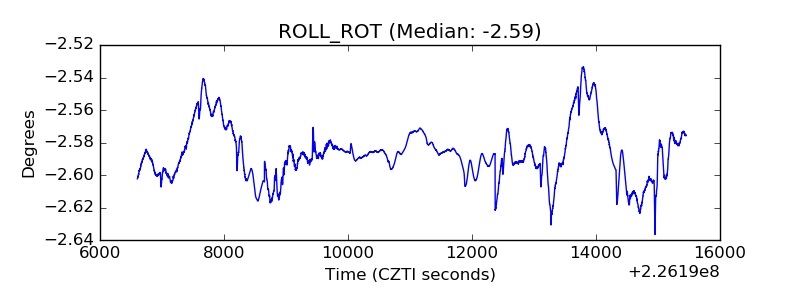 |
| _Roll_DEC | 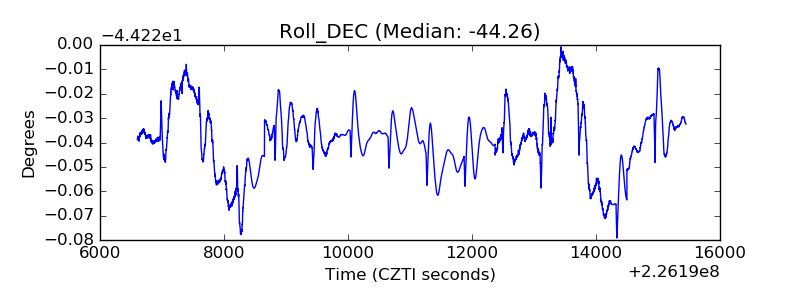 |
| _Roll_RA |  |
| Veto Counter | 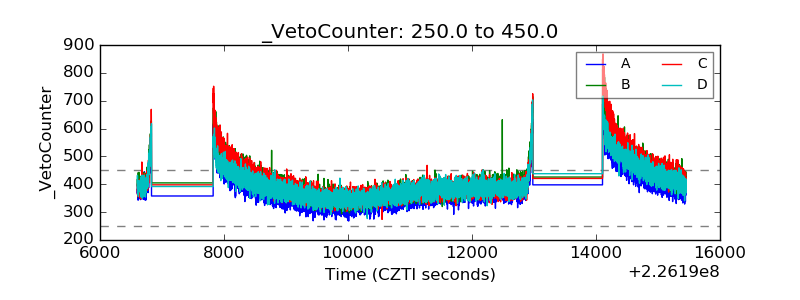 |