| Param | Original file | Final file |
|---|---|---|
| Filename | modeM0/AS1G06_064T01_9000001066_07728cztM0_level2.evt | modeM0/AS1G06_064T01_9000001066_07728cztM0_level2_quad_clean.evt |
| Size (bytes) | 389,459,520 | 80,219,520 |
| Size | 371.4 MB | 76.5 MB |
| Events in quadrant A | 2,703,681 | 512,703 |
| Events in quadrant B | 2,794,224 | 525,254 |
| Events in quadrant C | 3,133,412 | 509,241 |
| Events in quadrant D | 2,777,872 | 485,678 |
| Mode SS | |||
|---|---|---|---|
| Quadrant | BADHDUFLAG | Total packets | Discarded packets |
| A | 0 | 116 | 0 |
| B | 0 | 116 | 0 |
| C | 0 | 116 | 0 |
| D | 0 | 116 | 0 |
| Mode M0 | |||
|---|---|---|---|
| Quadrant | BADHDUFLAG | Total packets | Discarded packets |
| A | 0 | 11608 | 2 |
| B | 0 | 11864 | 1 |
| C | 0 | 12996 | 1 |
| D | 0 | 11985 | 1 |
| Mode M9 | |||
|---|---|---|---|
| Quadrant | BADHDUFLAG | Total packets | Discarded packets |
| A | 0 | 14 | 0 |
| B | 0 | 14 | 0 |
| C | 0 | 14 | 0 |
| D | 0 | 14 | 0 |
| Quadrant | Total seconds | Saturated seconds | Saturation percentage |
|---|---|---|---|
| A | 5671 | 28 | 0.493740% |
| B | 5671 | 45 | 0.793511% |
| C | 5671 | 106 | 1.869159% |
| D | 5671 | 35 | 0.617175% |
Noise dominated data is calculated using 1-second bins in cleaned event files. If a bin has >2000 counts, and if more than 50% of those come from <1% of pixels, then it is considered to be noise-dominated and hence unusable.
| Quadrant | # 1 sec bins | Bins with >0 counts | Bins with >2000 counts | High rate bins dominated by noise | Noise dominated (total time) | Noise dominated (detector-on time) | Marked lightcurve |
|---|---|---|---|---|---|---|---|
| A | 6966 | 5673 | 0 | 0 | 0.00% | 0.00% | 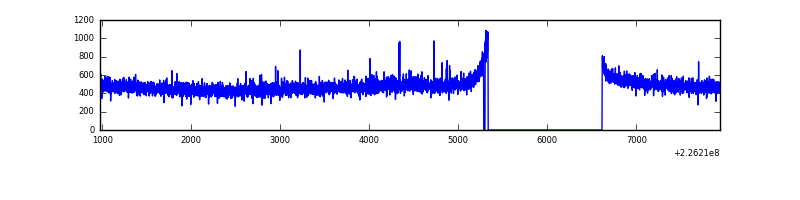 |
| B | 6966 | 5673 | 11 | 11 | 0.16% | 0.19% | 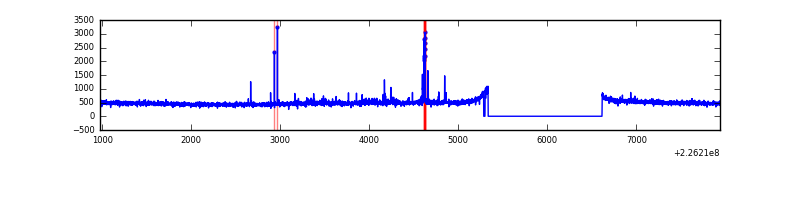 |
| C | 6966 | 5673 | 54 | 54 | 0.78% | 0.95% | 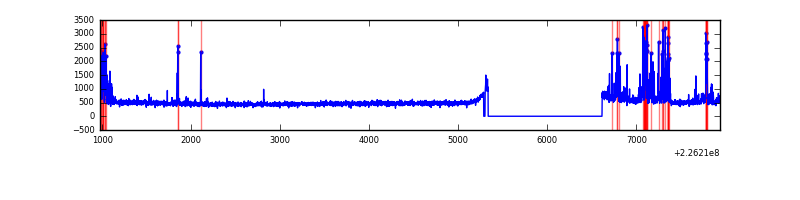 |
| D | 6966 | 5673 | 11 | 11 | 0.16% | 0.19% | 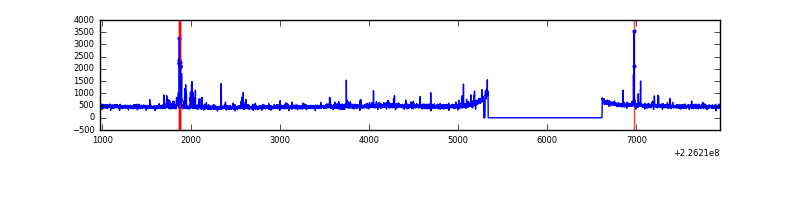 |
Top three noisy pixels from each quadrant. If the there are fewer than three noisy pixels in the level2.evt file, extra rows are filled as -1
| Pixel properties | Quadrant properties | ||||||
|---|---|---|---|---|---|---|---|
| Quadrant | DetID | PixID | Counts | Sigma | Mean | Median | Sigma |
| A | 15 | 234 | 8118 | 52.78 | 697 | 682 | 140.9 |
| A | 0 | 226 | 6712 | 42.8 | 697 | 682 | 140.9 |
| A | 12 | 194 | 6282 | 39.74 | 697 | 682 | 140.9 |
| B | 0 | 230 | 45011 | 336.15 | 700 | 686 | 131.9 |
| B | 4 | 170 | 12959 | 93.08 | 700 | 686 | 131.9 |
| B | 12 | 111 | 12498 | 89.58 | 700 | 686 | 131.9 |
| C | 9 | 68 | 441728 | 2788.07 | 688 | 693 | 158.2 |
| C | 13 | 61 | 5224 | 28.64 | 688 | 693 | 158.2 |
| C | 12 | 4 | 4607 | 24.74 | 688 | 693 | 158.2 |
| D | 2 | 152 | 108018 | 641.63 | 688 | 668 | 167.3 |
| D | 13 | 104 | 31170 | 182.31 | 688 | 668 | 167.3 |
| D | 5 | 233 | 19763 | 114.13 | 688 | 668 | 167.3 |
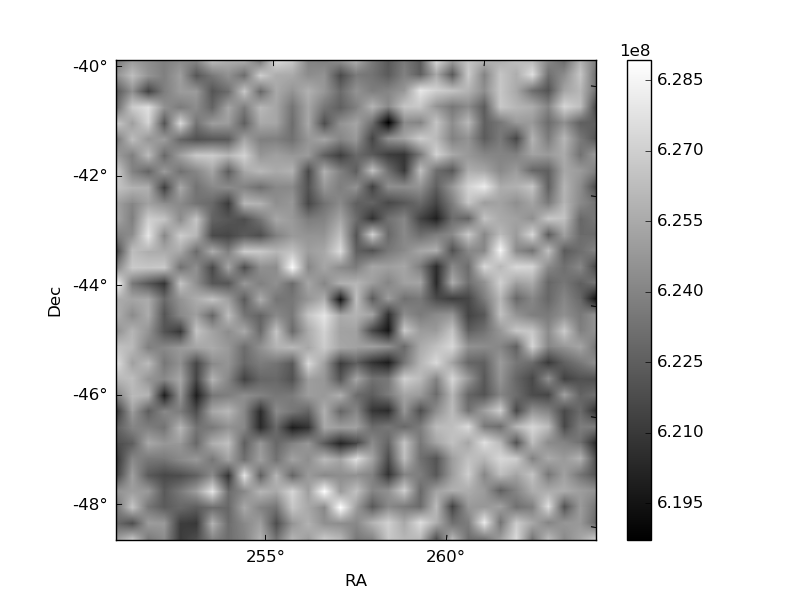
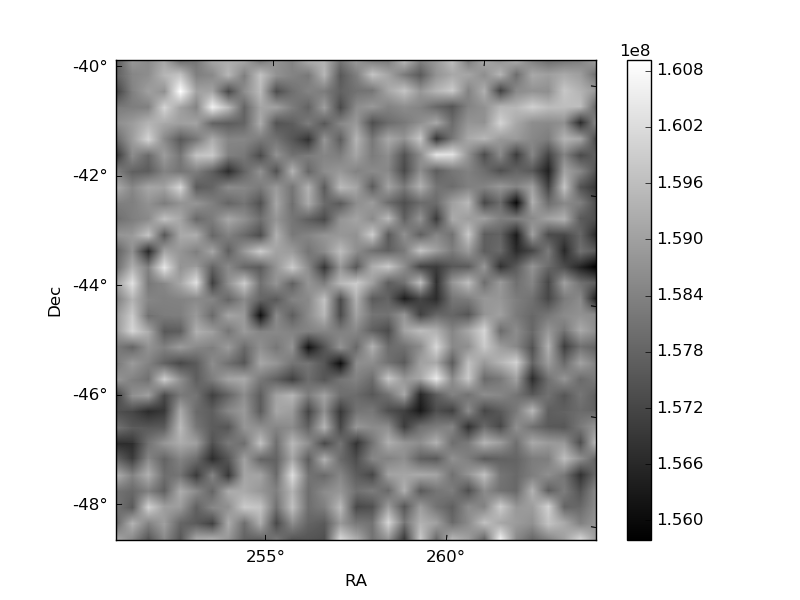
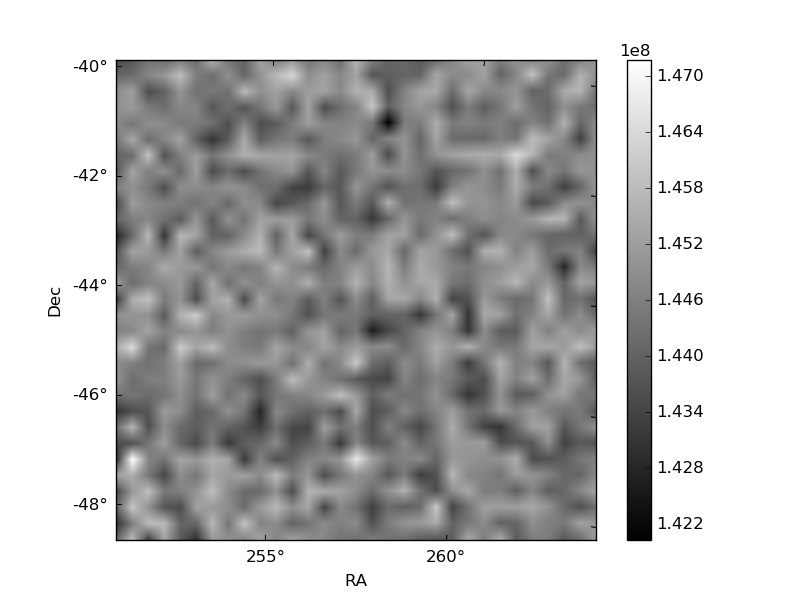
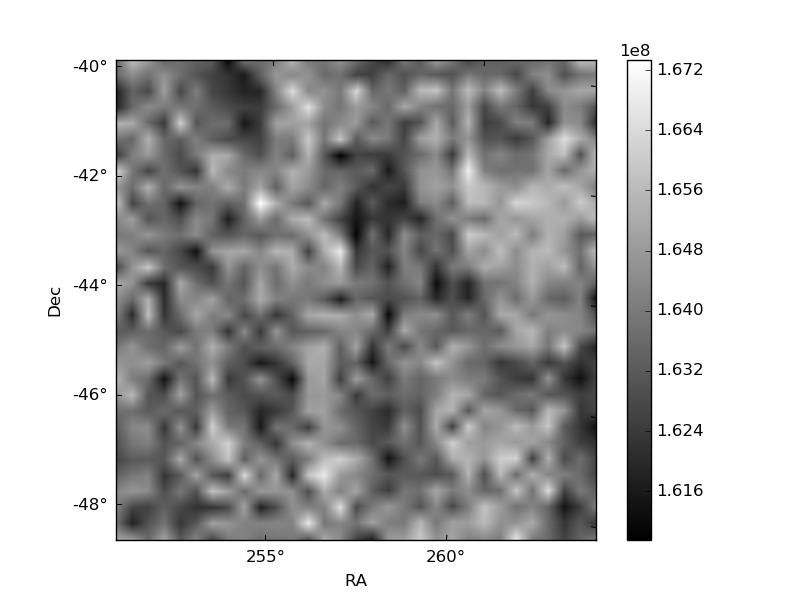
Histogram calculated using DETX and DETY for each event in the final _common_clean file
| Quadrant A | 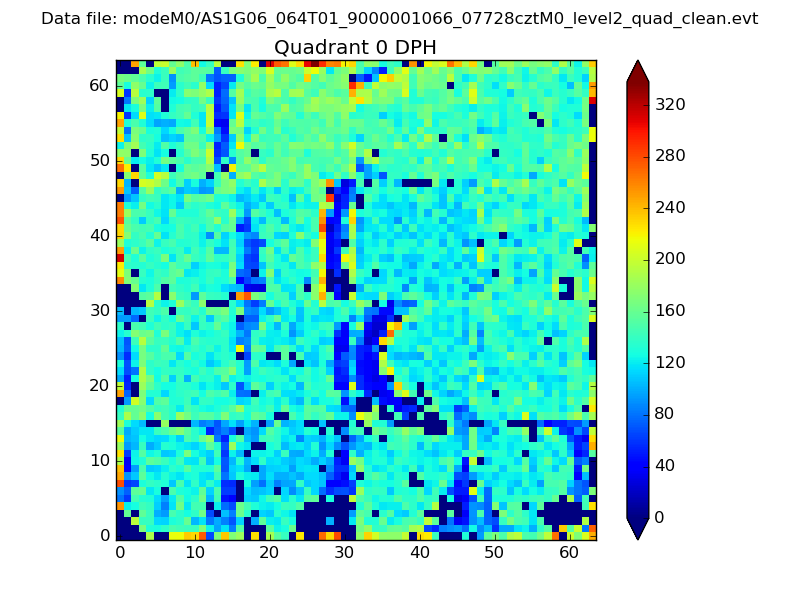 |
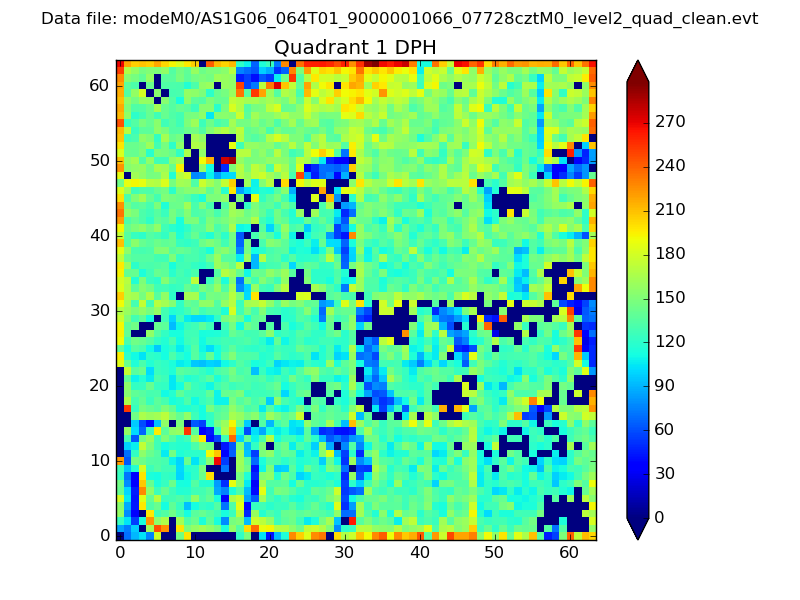 |
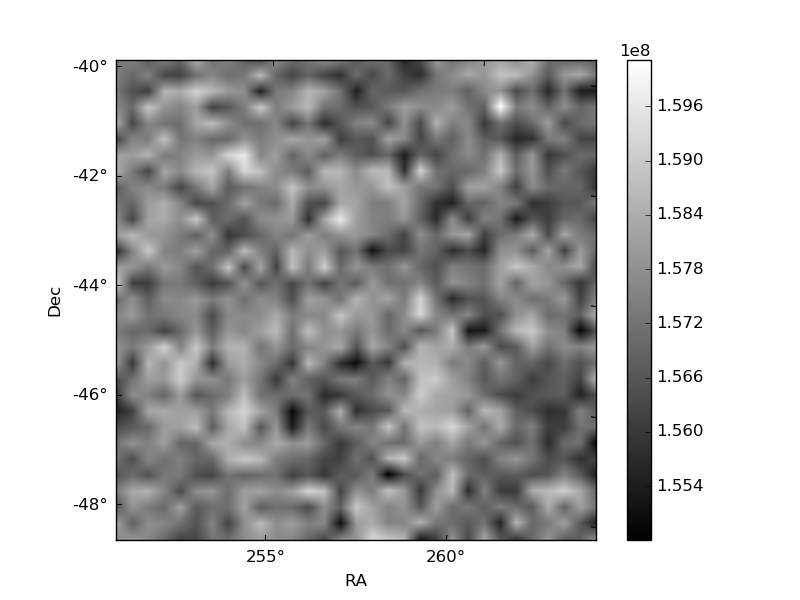
Quadrant B |
|---|---|---|---|
| Quadrant D | 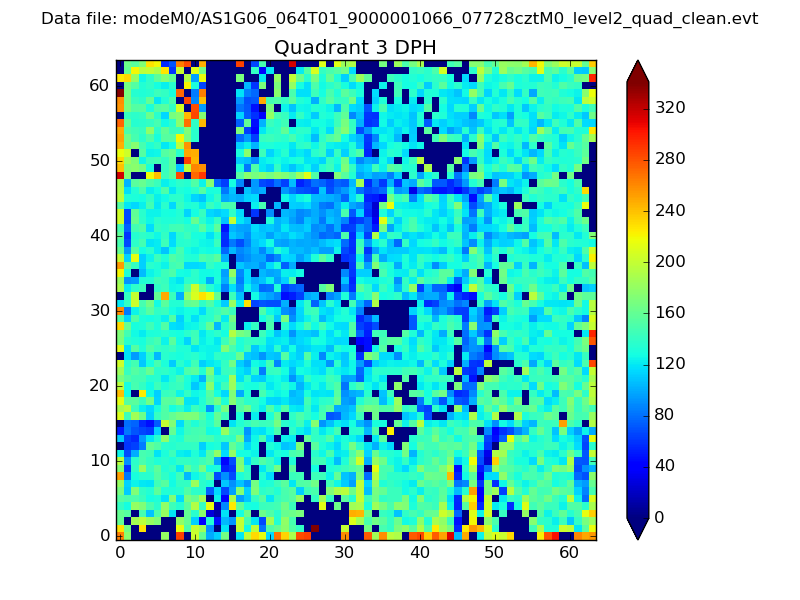 |
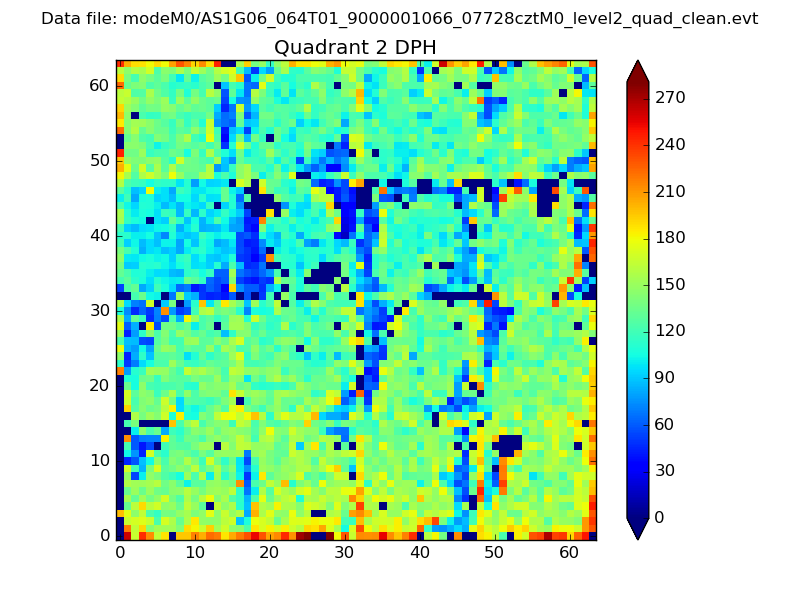 |
Quadrant C |
| Plot type | Count rate plots | Images |
|---|---|---|
| Comparison with Poisson distribution Blue bars denote a histogram of data divided into 1 sec bins. Red curve is a Poisson curve with rate = median count rate of data. |
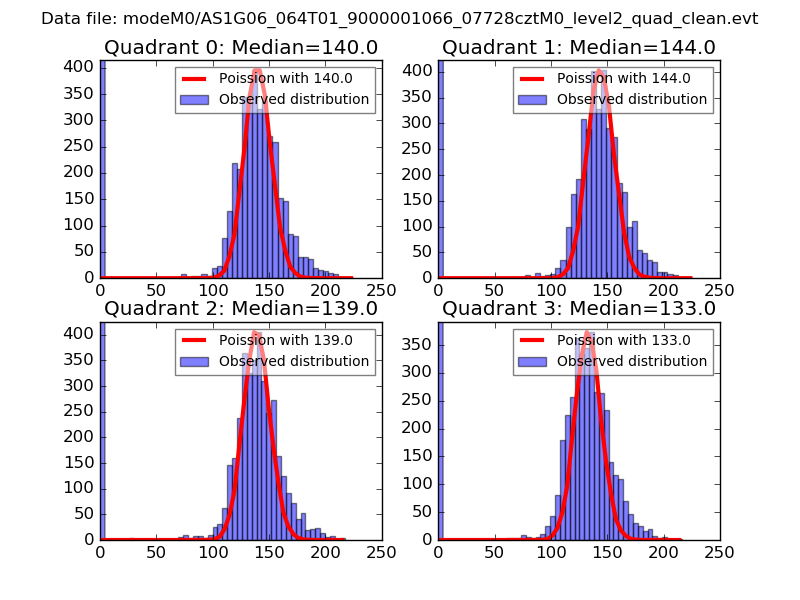 |
 |
| Quadrant-wise count rates Data is divided into 100 sec bins |
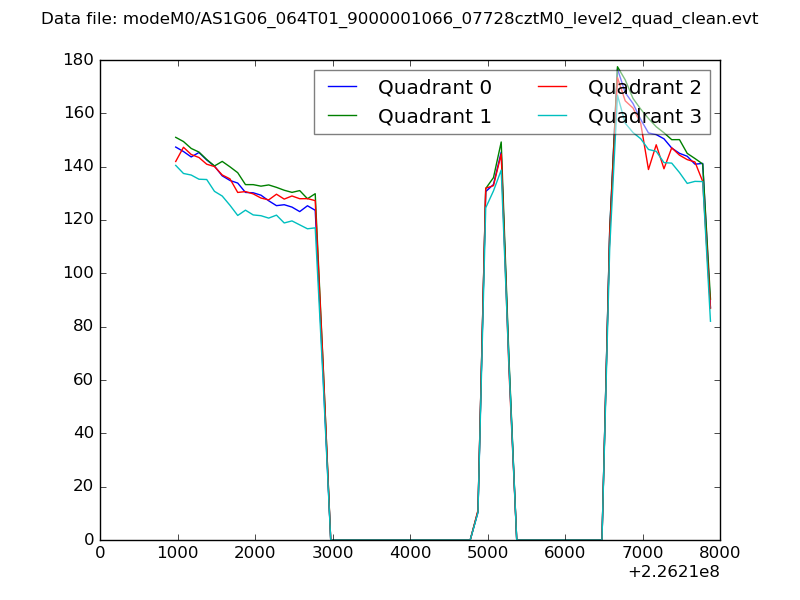 |
|
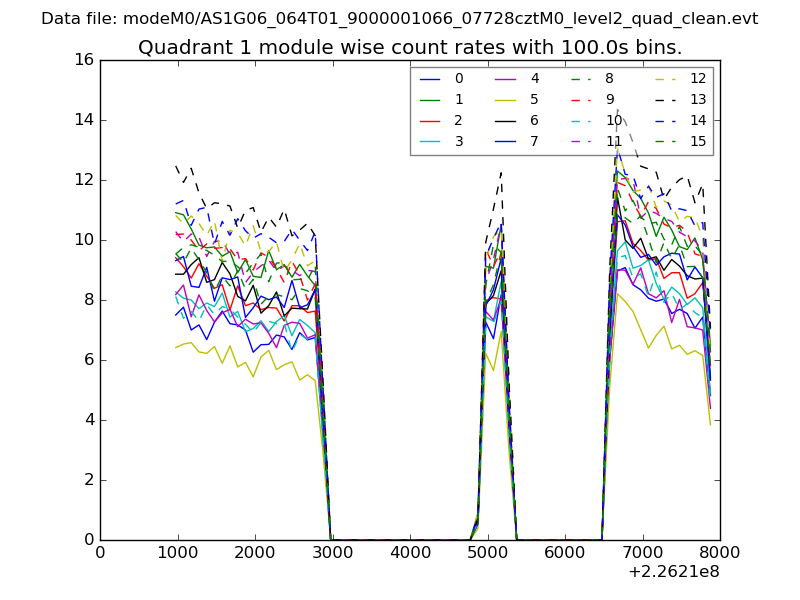
| Module-wise count rates for Quadrant A Data is divided into 100 sec bins |
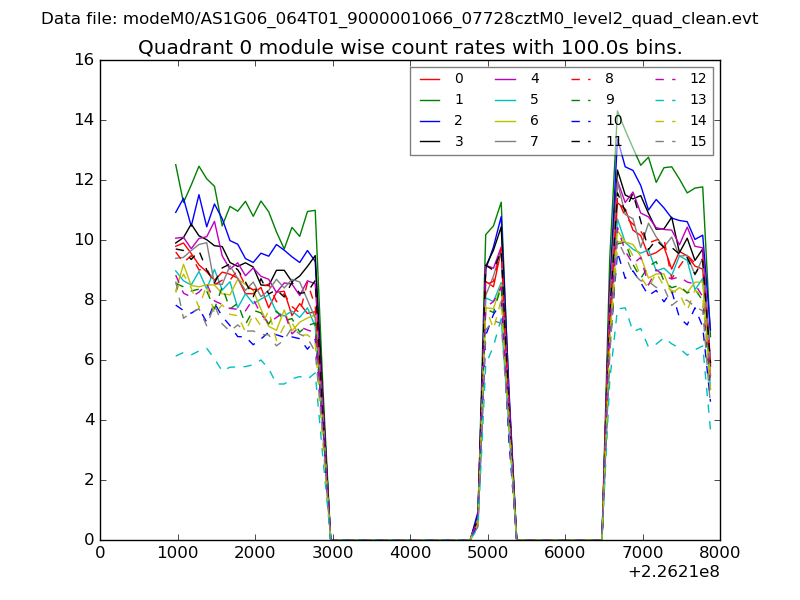 |
 |
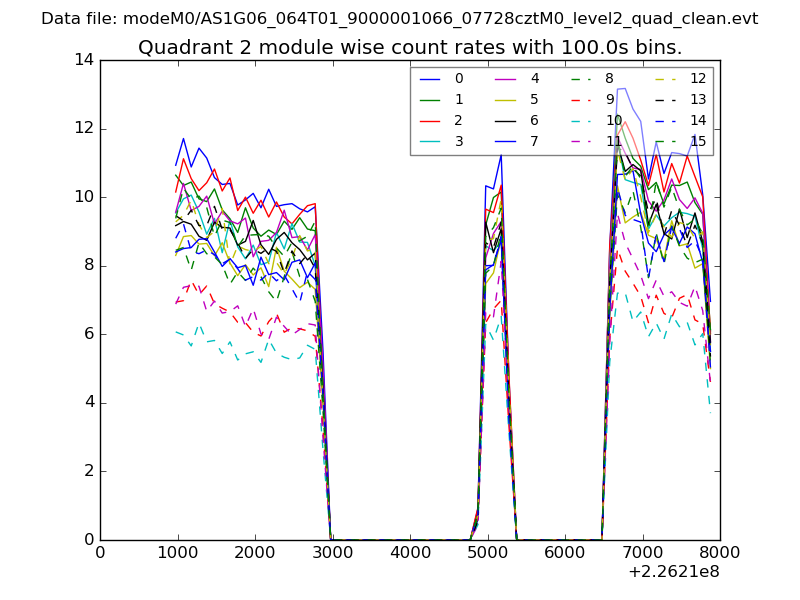
| Module-wise count rates for Quadrant B Data is divided into 100 sec bins |
 |
 |
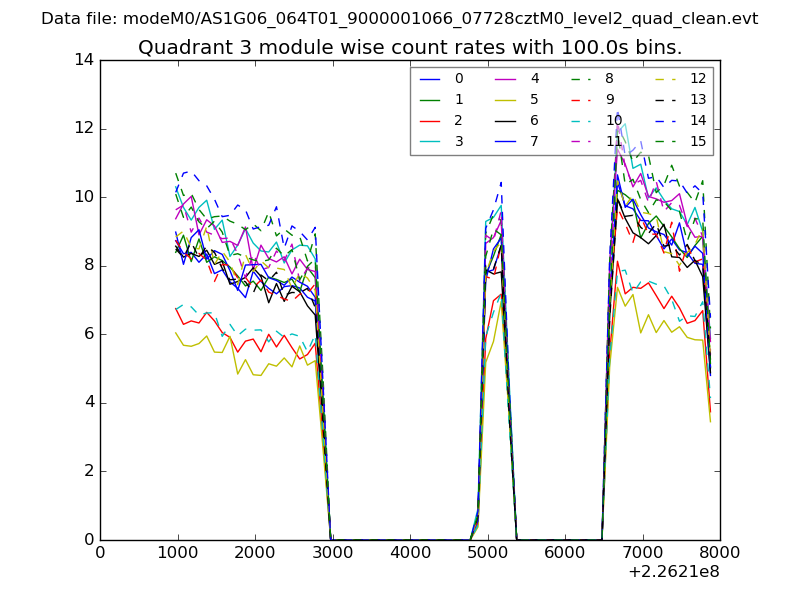
| Module-wise count rates for Quadrant C Data is divided into 100 sec bins |
 |
 |
| Module-wise count rates for Quadrant D Data is divided into 100 sec bins |
 |
 |
| Parameter | Plot |
|---|---|
| CZT HV Monitor |  |
| D_VDD | 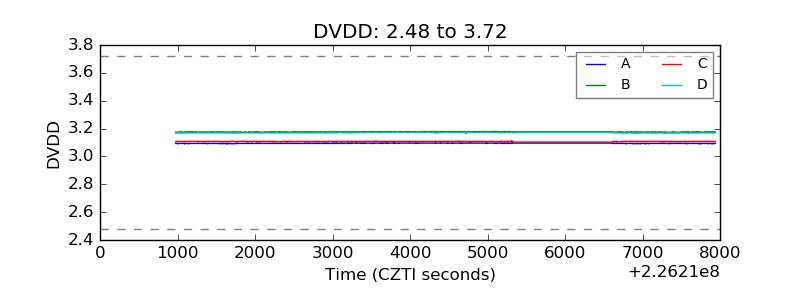 |
| Temperature 1 | 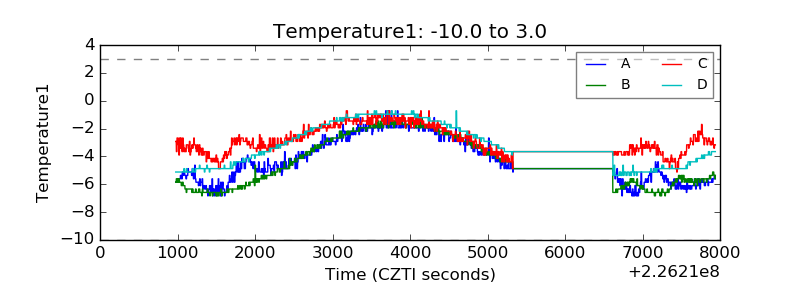 |
| Veto HV Monitor | 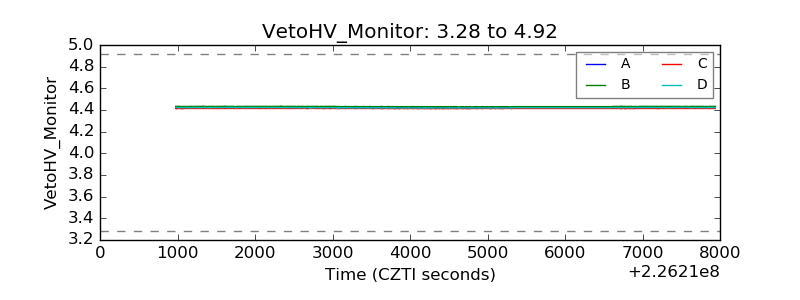 |
| Veto LLD |  |
| Alpha Counter | 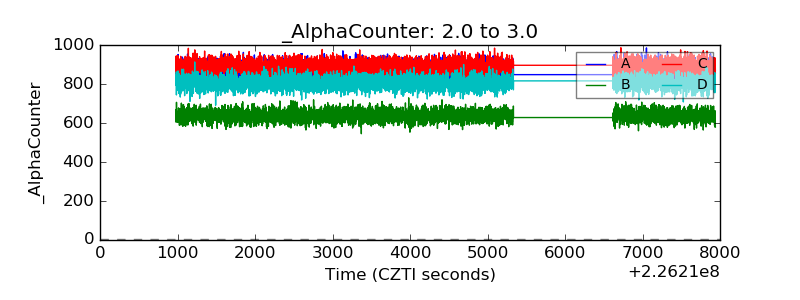 |
| _CPM_Rate | 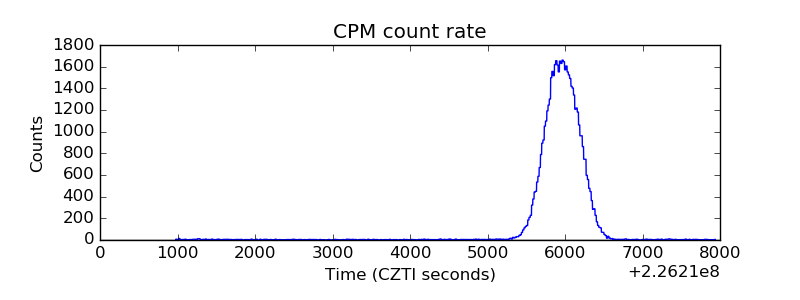 |
| CZT Counter | 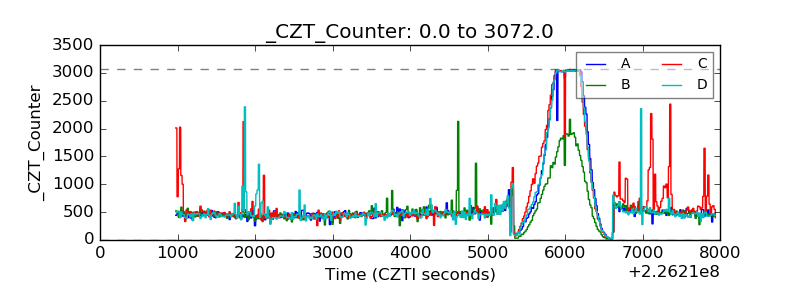 |
| +2.5 Volts monitor |  |
| +5 Volts monitor | 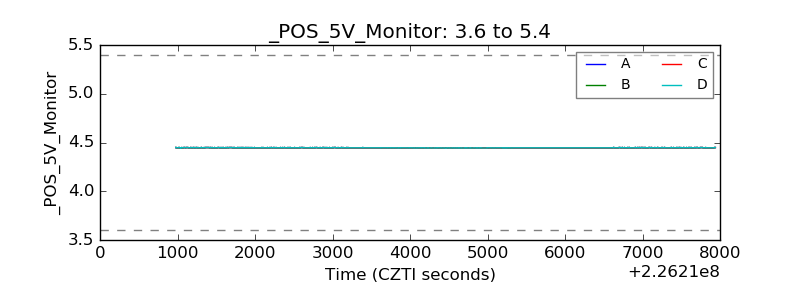 |
| _ROLL_ROT | 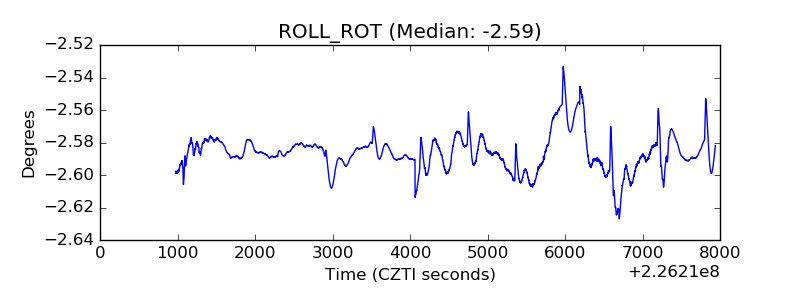 |
| _Roll_DEC | 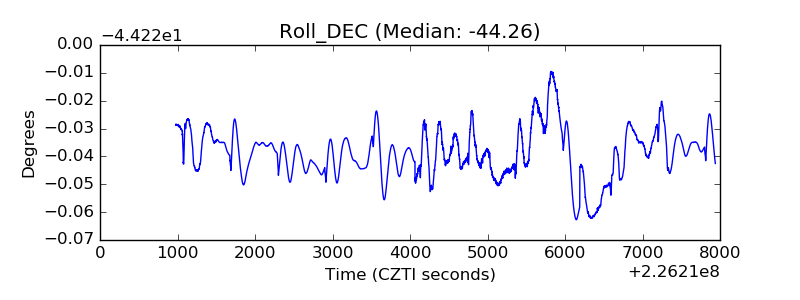 |
| _Roll_RA | 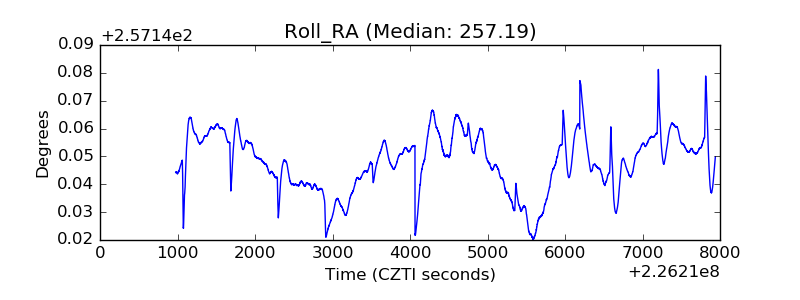 |
| Veto Counter |  |