| Param | Original file | Final file |
|---|---|---|
| Filename | modeM0/AS1G06_064T01_9000001066_07729cztM0_level2.evt | modeM0/AS1G06_064T01_9000001066_07729cztM0_level2_quad_clean.evt |
| Size (bytes) | 412,954,560 | 87,978,240 |
| Size | 393.8 MB | 83.9 MB |
| Events in quadrant A | 2,931,769 | 567,652 |
| Events in quadrant B | 2,973,362 | 578,396 |
| Events in quadrant C | 3,261,666 | 561,254 |
| Events in quadrant D | 2,931,872 | 538,253 |
| Mode SS | |||
|---|---|---|---|
| Quadrant | BADHDUFLAG | Total packets | Discarded packets |
| A | 0 | 122 | 0 |
| B | 0 | 122 | 0 |
| C | 0 | 122 | 0 |
| D | 0 | 122 | 0 |
| Mode M0 | |||
|---|---|---|---|
| Quadrant | BADHDUFLAG | Total packets | Discarded packets |
| A | 0 | 12424 | 2 |
| B | 0 | 12477 | 1 |
| C | 0 | 13445 | 1 |
| D | 0 | 12556 | 1 |
| Mode M9 | |||
|---|---|---|---|
| Quadrant | BADHDUFLAG | Total packets | Discarded packets |
| A | 0 | 13 | 0 |
| B | 0 | 13 | 0 |
| C | 0 | 13 | 0 |
| D | 0 | 13 | 0 |
| Quadrant | Total seconds | Saturated seconds | Saturation percentage |
|---|---|---|---|
| A | 5993 | 53 | 0.884365% |
| B | 5993 | 52 | 0.867679% |
| C | 5993 | 87 | 1.451694% |
| D | 5993 | 51 | 0.850993% |
Noise dominated data is calculated using 1-second bins in cleaned event files. If a bin has >2000 counts, and if more than 50% of those come from <1% of pixels, then it is considered to be noise-dominated and hence unusable.
| Quadrant | # 1 sec bins | Bins with >0 counts | Bins with >2000 counts | High rate bins dominated by noise | Noise dominated (total time) | Noise dominated (detector-on time) | Marked lightcurve |
|---|---|---|---|---|---|---|---|
| A | 7268 | 5994 | 1 | 1 | 0.01% | 0.02% | 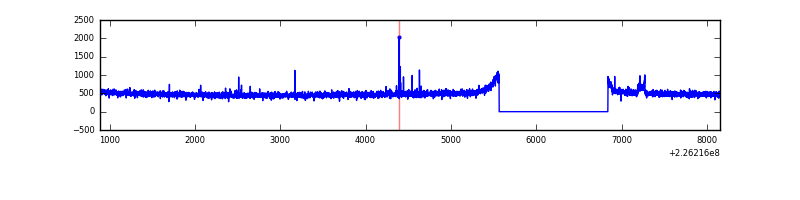 |
| B | 7268 | 5994 | 0 | 0 | 0.00% | 0.00% | 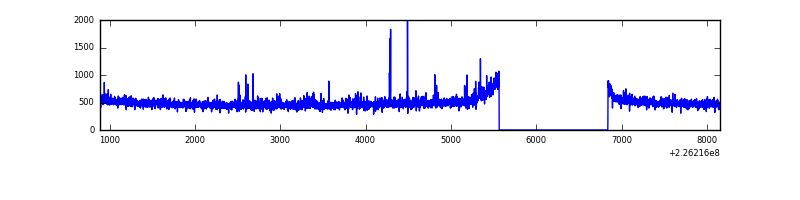 |
| C | 7268 | 5994 | 36 | 36 | 0.50% | 0.60% | 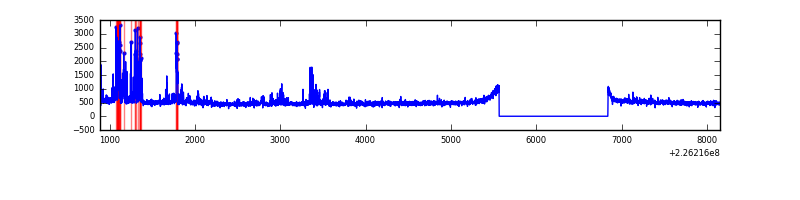 |
| D | 7268 | 5993 | 7 | 7 | 0.10% | 0.12% | 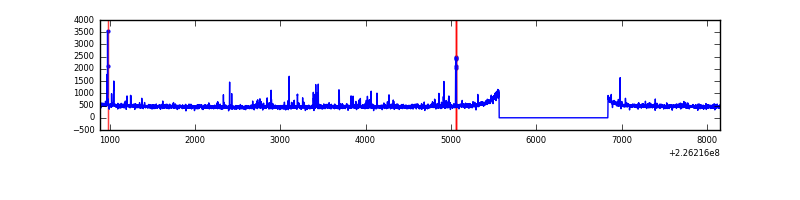 |
Top three noisy pixels from each quadrant. If the there are fewer than three noisy pixels in the level2.evt file, extra rows are filled as -1
| Pixel properties | Quadrant properties | ||||||
|---|---|---|---|---|---|---|---|
| Quadrant | DetID | PixID | Counts | Sigma | Mean | Median | Sigma |
| A | 14 | 111 | 16565 | 104.1 | 752 | 734 | 152.1 |
| A | 15 | 234 | 9672 | 58.77 | 752 | 734 | 152.1 |
| A | 0 | 226 | 7168 | 42.31 | 752 | 734 | 152.1 |
| B | 0 | 214 | 20660 | 140.44 | 753 | 737 | 141.9 |
| B | 4 | 239 | 14154 | 94.58 | 753 | 737 | 141.9 |
| B | 12 | 111 | 13301 | 88.57 | 753 | 737 | 141.9 |
| C | 9 | 68 | 372141 | 2180.11 | 739 | 744 | 170.4 |
| C | 13 | 61 | 5702 | 29.1 | 739 | 744 | 170.4 |
| C | 10 | 22 | 5408 | 27.38 | 739 | 744 | 170.4 |
| D | 13 | 104 | 44504 | 241.4 | 740 | 718 | 181.4 |
| D | 2 | 152 | 40854 | 221.27 | 740 | 718 | 181.4 |
| D | 7 | 55 | 28363 | 152.41 | 740 | 718 | 181.4 |
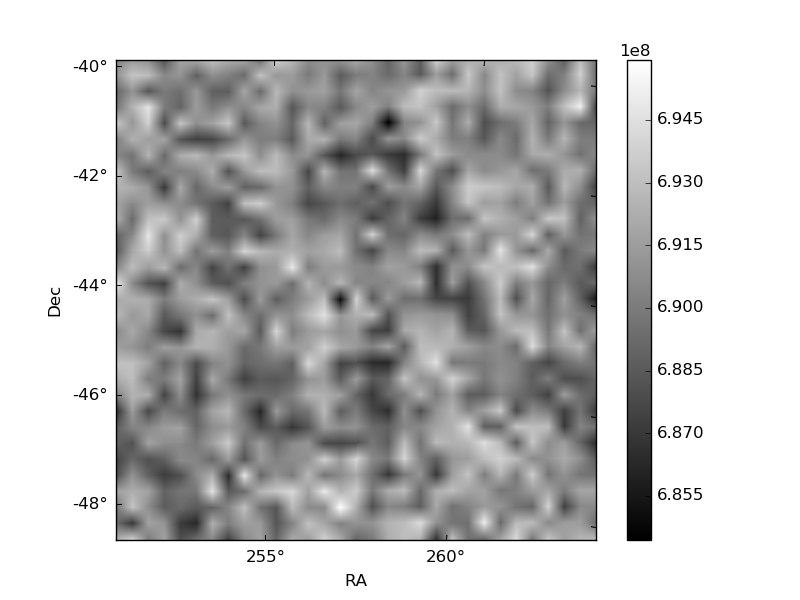
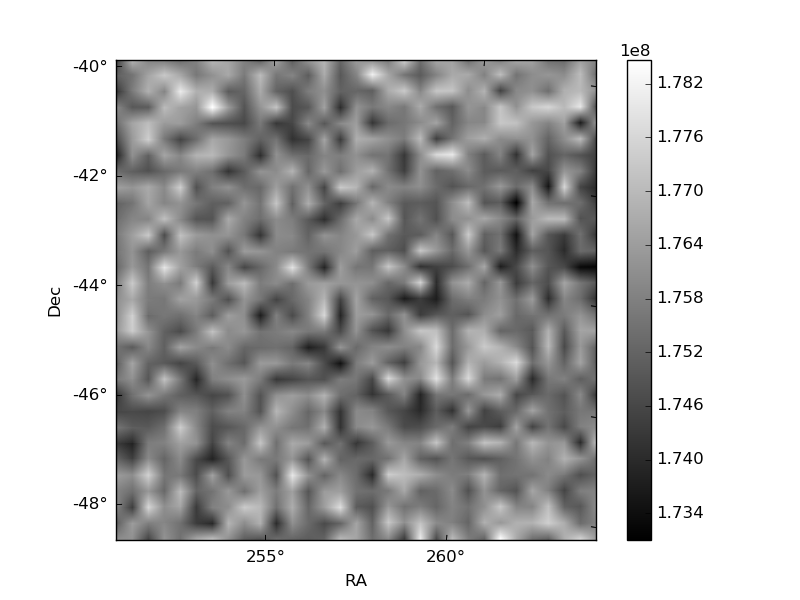
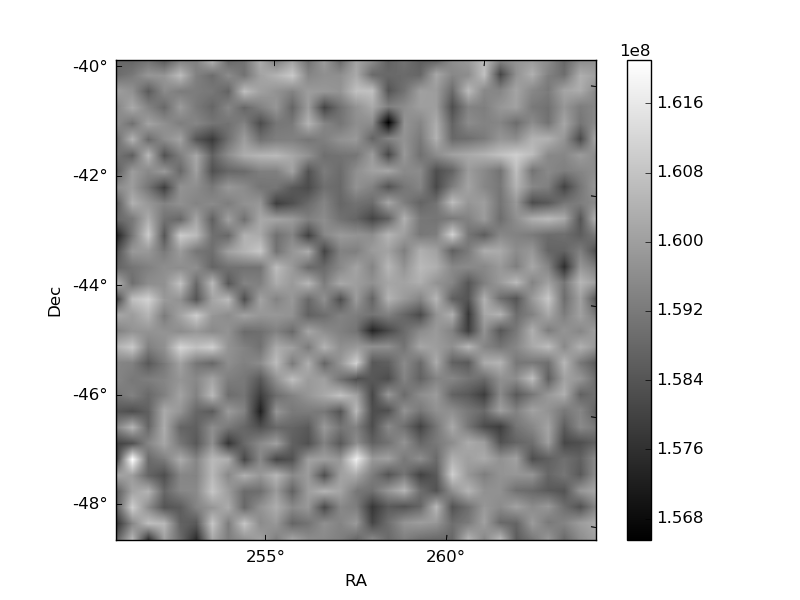
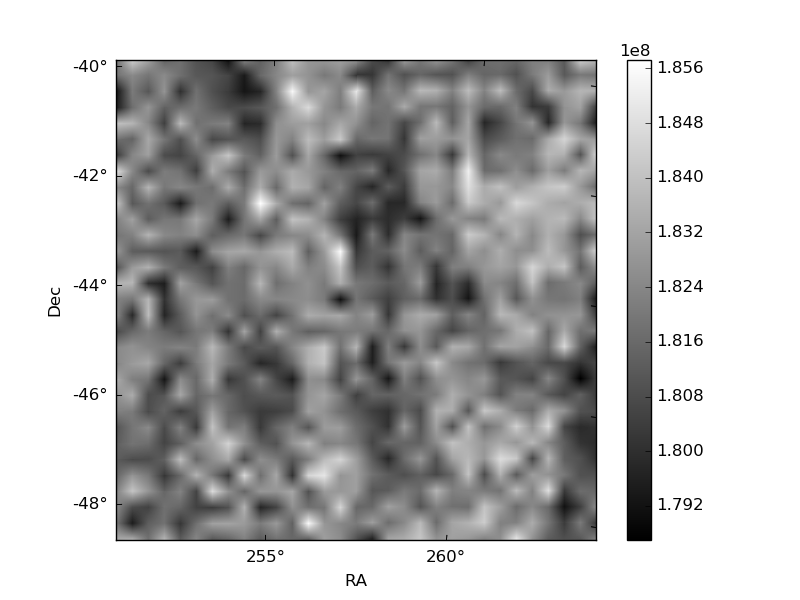
Histogram calculated using DETX and DETY for each event in the final _common_clean file
| Quadrant A | 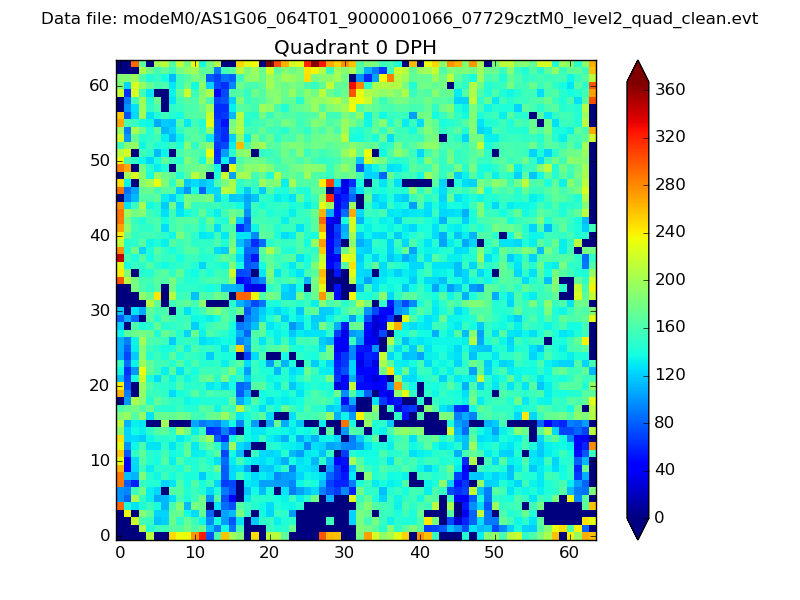 |
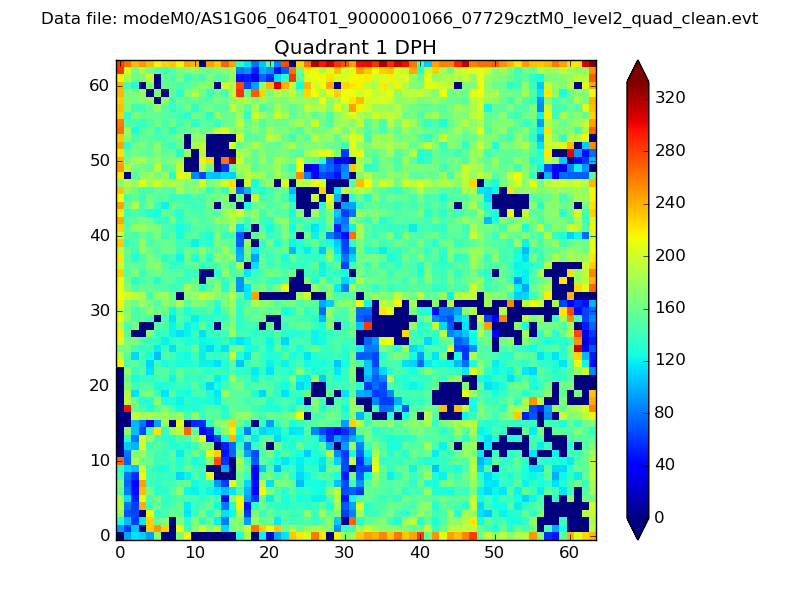 |
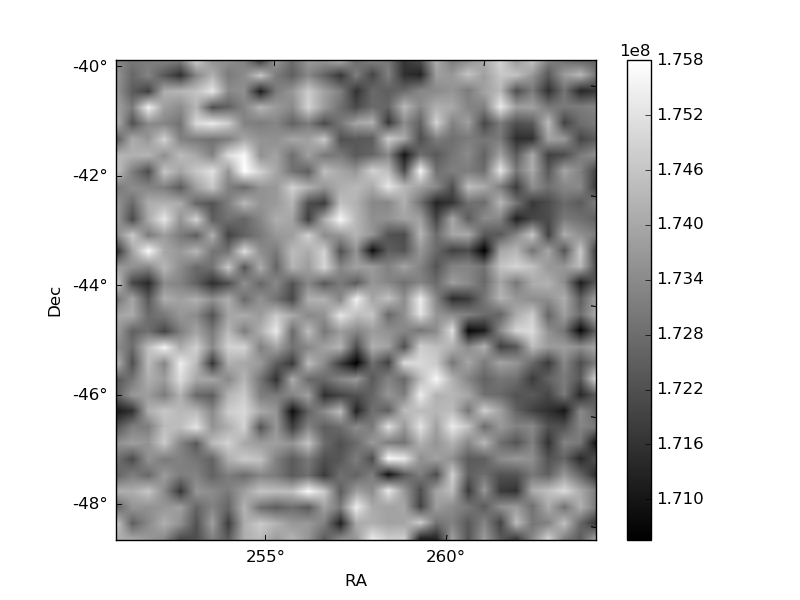
Quadrant B |
|---|---|---|---|
| Quadrant D | 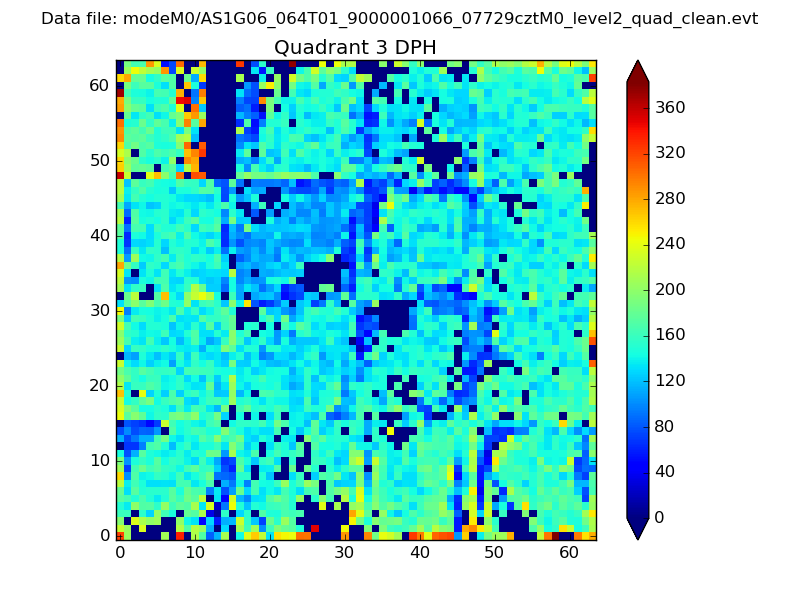 |
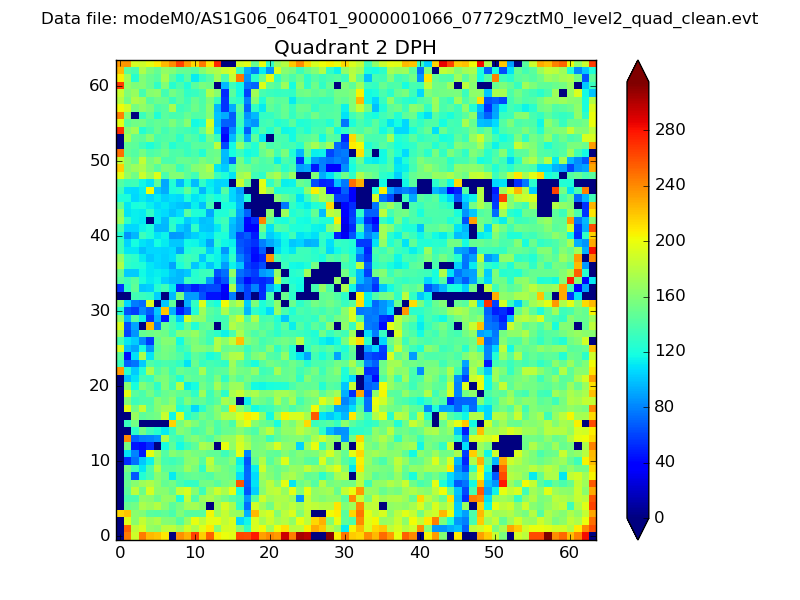 |
Quadrant C |
| Plot type | Count rate plots | Images |
|---|---|---|
| Comparison with Poisson distribution Blue bars denote a histogram of data divided into 1 sec bins. Red curve is a Poisson curve with rate = median count rate of data. |
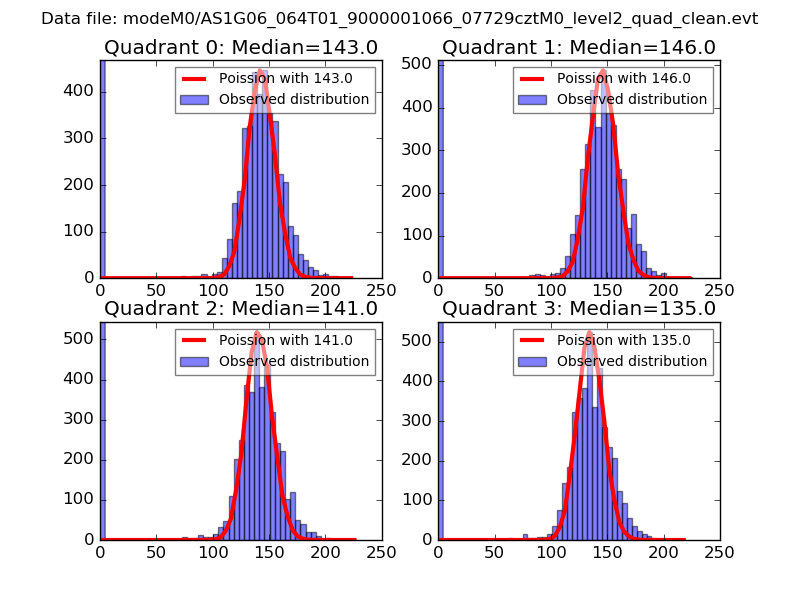 |
 |
| Quadrant-wise count rates Data is divided into 100 sec bins |
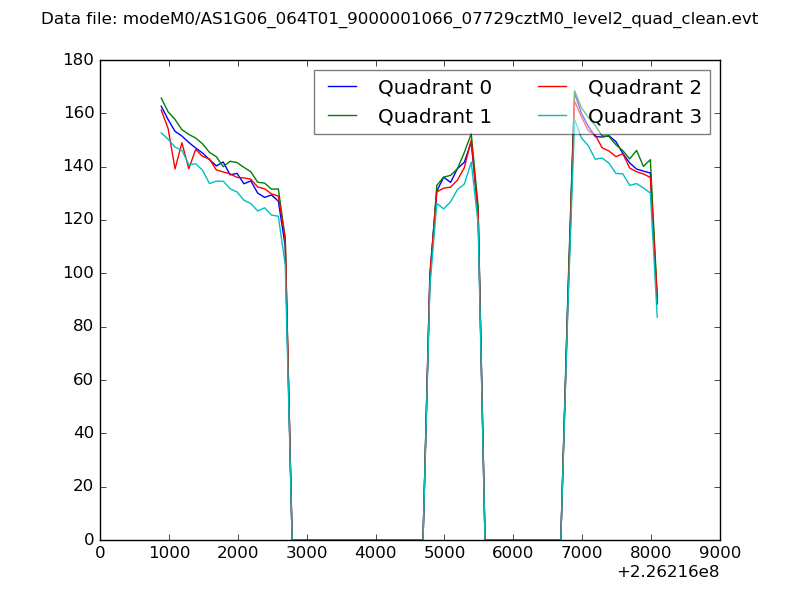 |
|
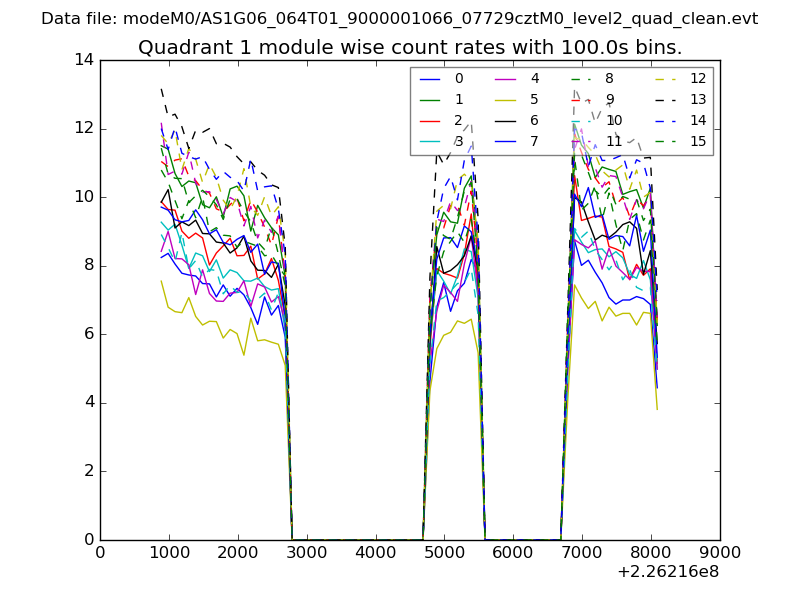
| Module-wise count rates for Quadrant A Data is divided into 100 sec bins |
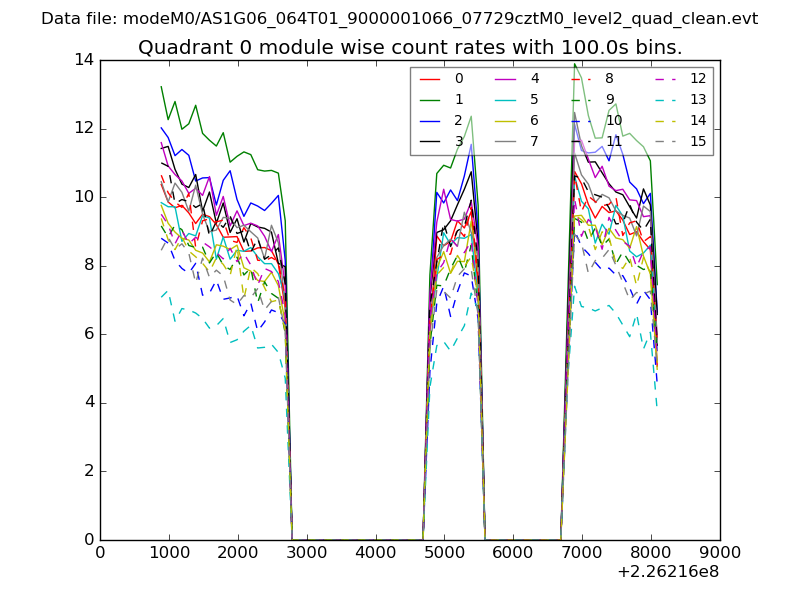 |
 |
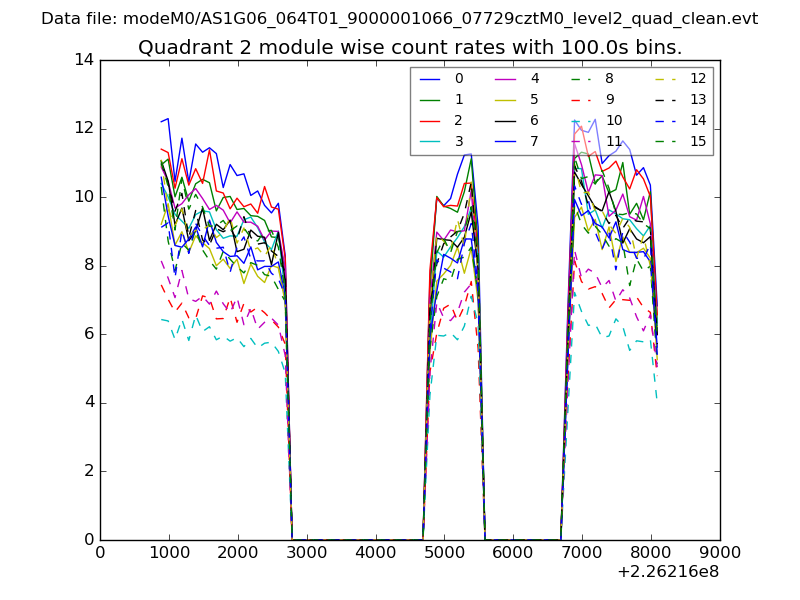
| Module-wise count rates for Quadrant B Data is divided into 100 sec bins |
 |
 |
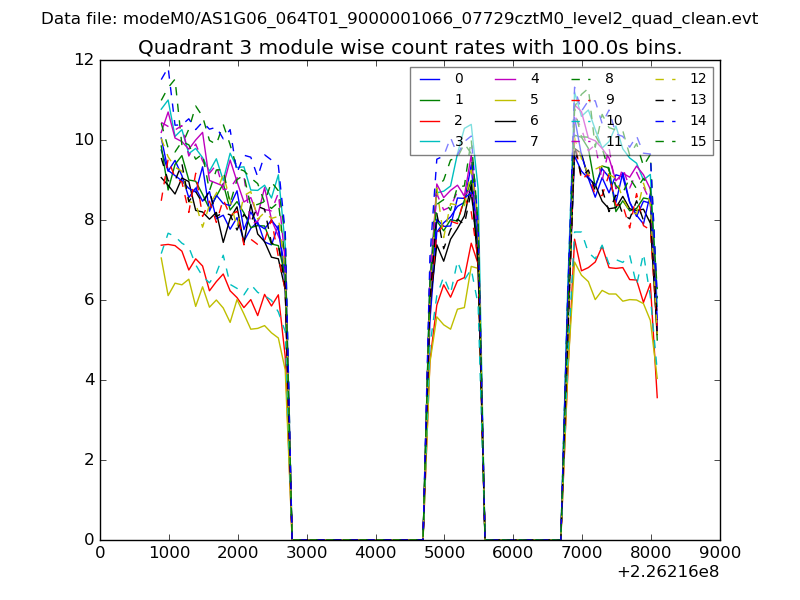
| Module-wise count rates for Quadrant C Data is divided into 100 sec bins |
 |
 |
| Module-wise count rates for Quadrant D Data is divided into 100 sec bins |
 |
 |
| Parameter | Plot |
|---|---|
| CZT HV Monitor | 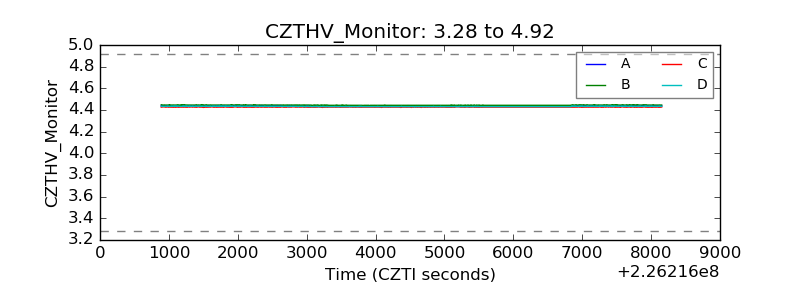 |
| D_VDD | 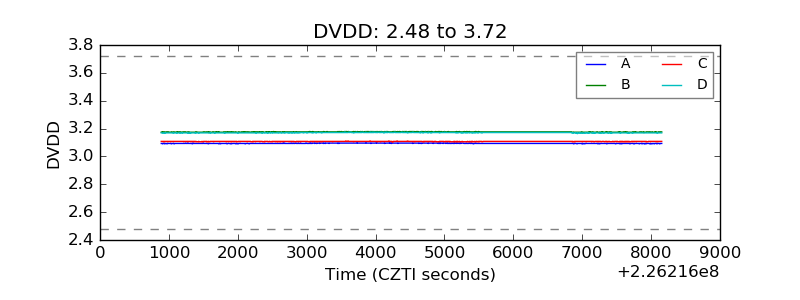 |
| Temperature 1 | 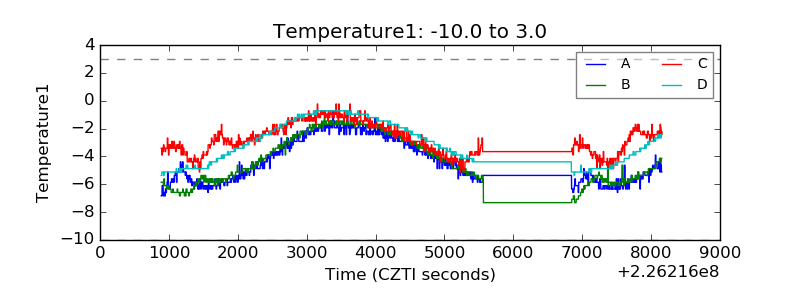 |
| Veto HV Monitor | 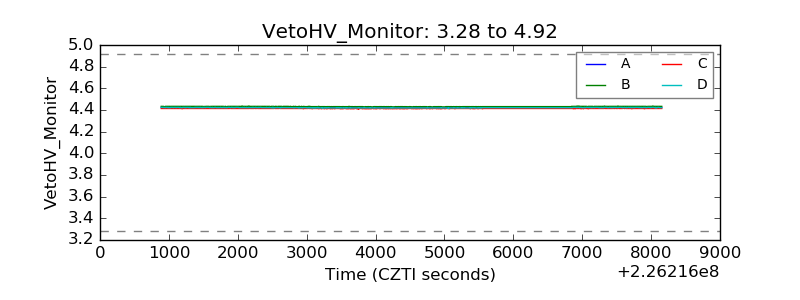 |
| Veto LLD | 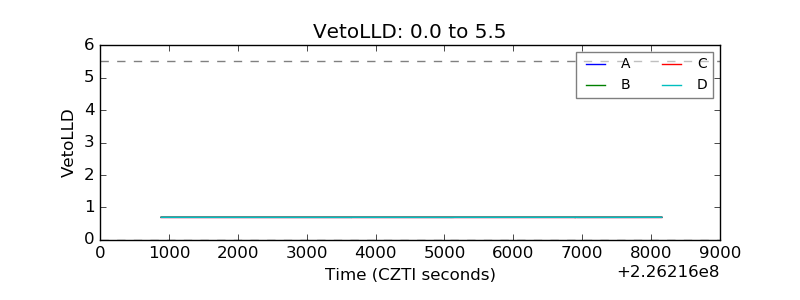 |
| Alpha Counter | 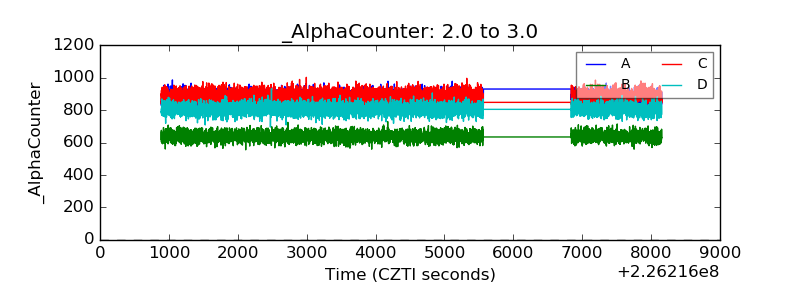 |
| _CPM_Rate | 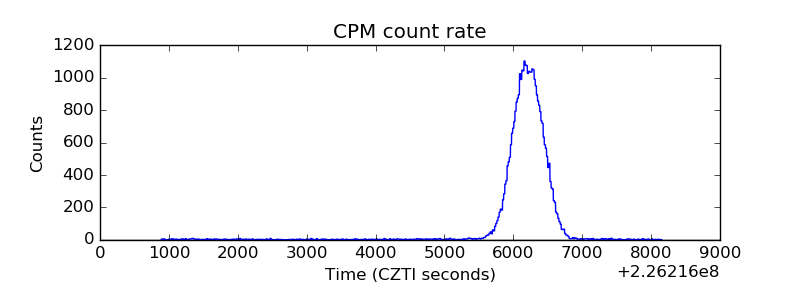 |
| CZT Counter | 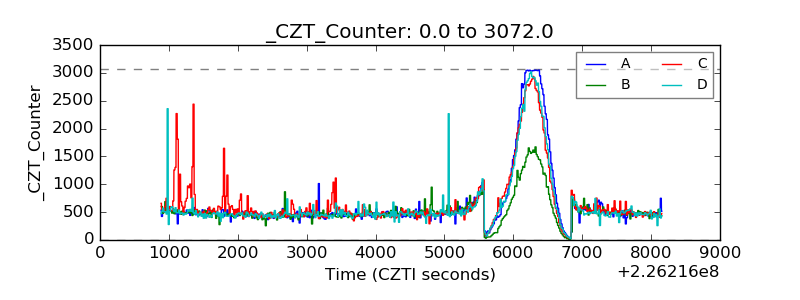 |
| +2.5 Volts monitor | 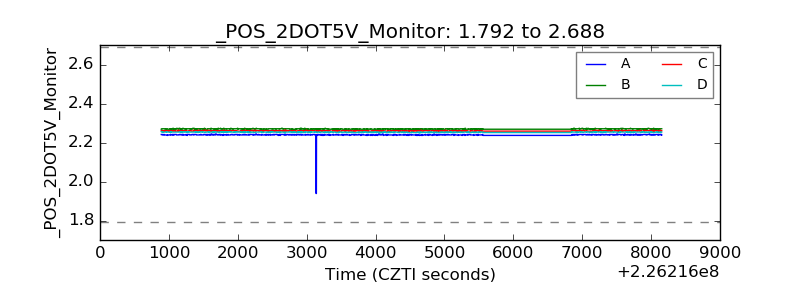 |
| +5 Volts monitor |  |
| _ROLL_ROT | 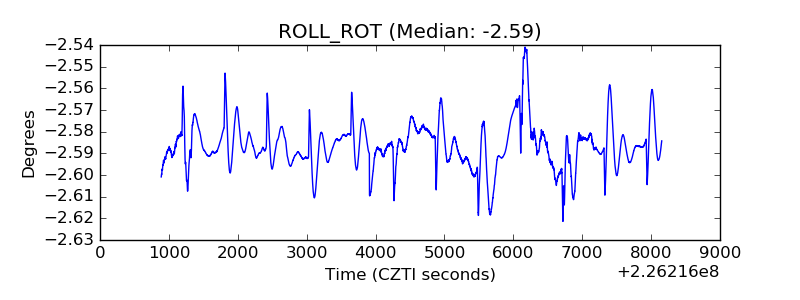 |
| _Roll_DEC | 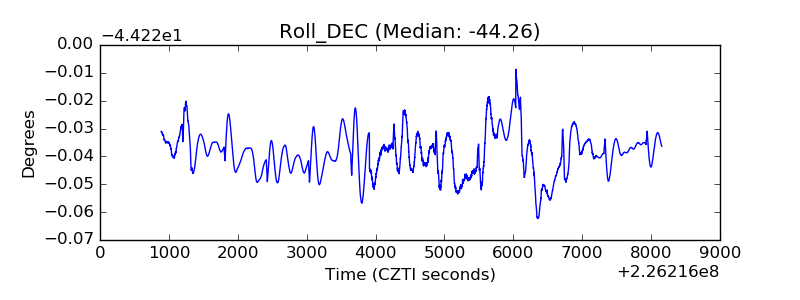 |
| _Roll_RA | 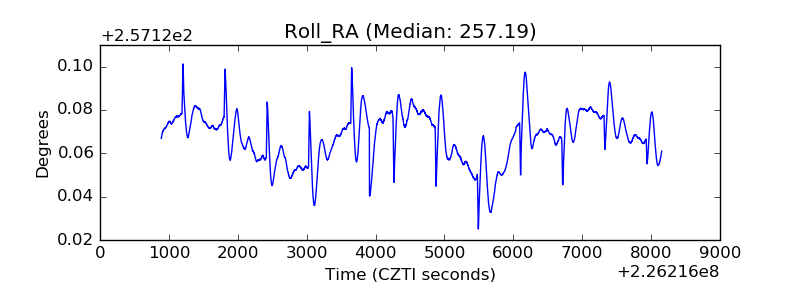 |
| Veto Counter | 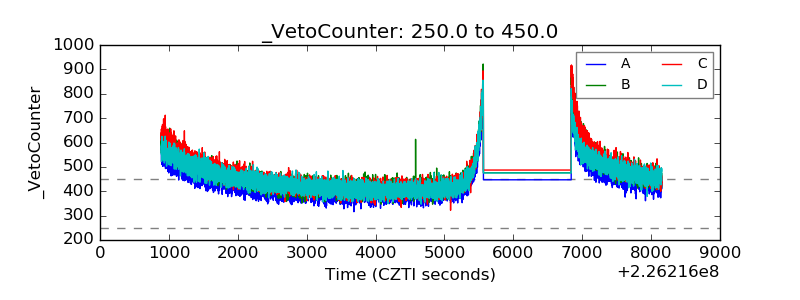 |