| Param | Original file | Final file |
|---|---|---|
| Filename | modeM0/AS1G06_064T01_9000001066_07732cztM0_level2.evt | modeM0/AS1G06_064T01_9000001066_07732cztM0_level2_quad_clean.evt |
| Size (bytes) | 478,621,440 | 88,024,320 |
| Size | 456.4 MB | 83.9 MB |
| Events in quadrant A | 3,435,598 | 546,572 |
| Events in quadrant B | 3,544,884 | 549,453 |
| Events in quadrant C | 3,472,215 | 537,834 |
| Events in quadrant D | 3,539,848 | 517,349 |
| Mode SS | |||
|---|---|---|---|
| Quadrant | BADHDUFLAG | Total packets | Discarded packets |
| A | 0 | 150 | 0 |
| B | 0 | 150 | 0 |
| C | 0 | 150 | 0 |
| D | 0 | 150 | 0 |
| Mode M0 | |||
|---|---|---|---|
| Quadrant | BADHDUFLAG | Total packets | Discarded packets |
| A | 0 | 15239 | 3 |
| B | 0 | 15417 | 2 |
| C | 0 | 15302 | 2 |
| D | 0 | 15634 | 2 |
| Mode M9 | |||
|---|---|---|---|
| Quadrant | BADHDUFLAG | Total packets | Discarded packets |
| A | 0 | 6 | 0 |
| B | 0 | 6 | 0 |
| C | 0 | 6 | 0 |
| D | 0 | 6 | 0 |
| Quadrant | Total seconds | Saturated seconds | Saturation percentage |
|---|---|---|---|
| A | 7390 | 131 | 1.772666% |
| B | 7390 | 160 | 2.165088% |
| C | 7390 | 94 | 1.271989% |
| D | 7390 | 118 | 1.596752% |
Noise dominated data is calculated using 1-second bins in cleaned event files. If a bin has >2000 counts, and if more than 50% of those come from <1% of pixels, then it is considered to be noise-dominated and hence unusable.
| Quadrant | # 1 sec bins | Bins with >0 counts | Bins with >2000 counts | High rate bins dominated by noise | Noise dominated (total time) | Noise dominated (detector-on time) | Marked lightcurve |
|---|---|---|---|---|---|---|---|
| A | 7950 | 7390 | 0 | 0 | 0.00% | 0.00% | 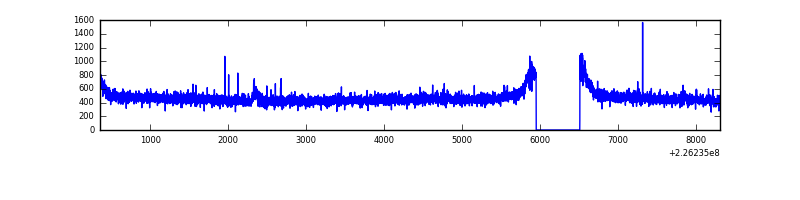 |
| B | 7950 | 7390 | 7 | 7 | 0.09% | 0.09% | 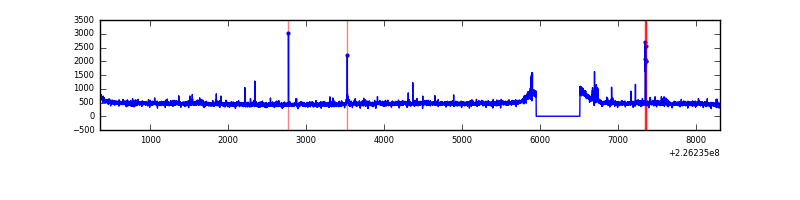 |
| C | 7950 | 7391 | 0 | 0 | 0.00% | 0.00% | 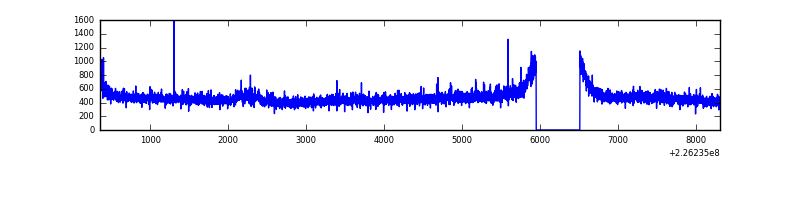 |
| D | 7950 | 7390 | 9 | 9 | 0.11% | 0.12% | 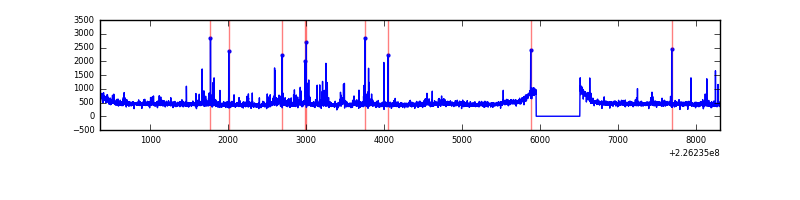 |
Top three noisy pixels from each quadrant. If the there are fewer than three noisy pixels in the level2.evt file, extra rows are filled as -1
| Pixel properties | Quadrant properties | ||||||
|---|---|---|---|---|---|---|---|
| Quadrant | DetID | PixID | Counts | Sigma | Mean | Median | Sigma |
| A | 15 | 234 | 20357 | 107.6 | 885 | 863 | 181.2 |
| A | 0 | 226 | 8516 | 42.24 | 885 | 863 | 181.2 |
| A | 12 | 194 | 7725 | 37.87 | 885 | 863 | 181.2 |
| B | 4 | 239 | 29129 | 164.7 | 886 | 863 | 171.6 |
| B | 0 | 214 | 27813 | 157.03 | 886 | 863 | 171.6 |
| B | 4 | 81 | 27403 | 154.64 | 886 | 863 | 171.6 |
| C | 9 | 68 | 65622 | 323.68 | 862 | 865 | 200.1 |
| C | 9 | 243 | 33828 | 164.76 | 862 | 865 | 200.1 |
| C | 12 | 4 | 7581 | 33.57 | 862 | 865 | 200.1 |
| D | 2 | 152 | 67975 | 316.91 | 867 | 839 | 211.8 |
| D | 13 | 104 | 49904 | 231.61 | 867 | 839 | 211.8 |
| D | 7 | 55 | 35204 | 162.22 | 867 | 839 | 211.8 |
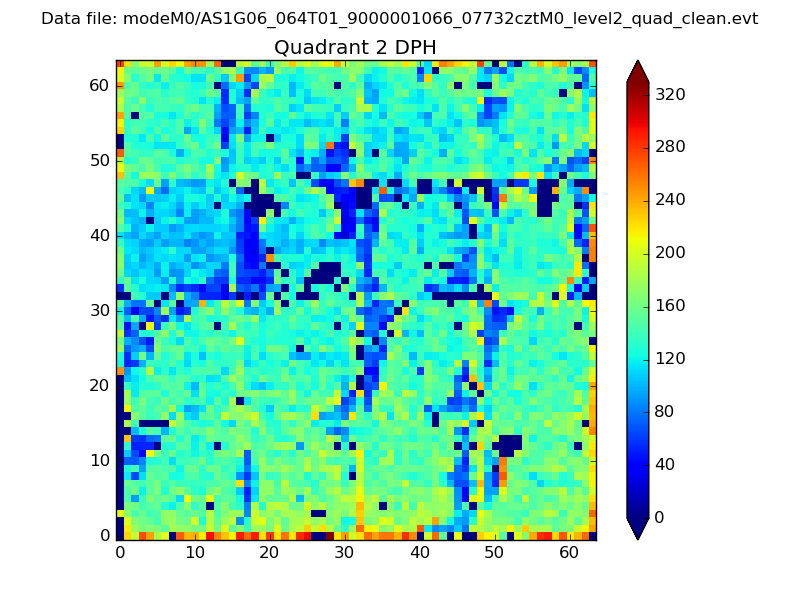
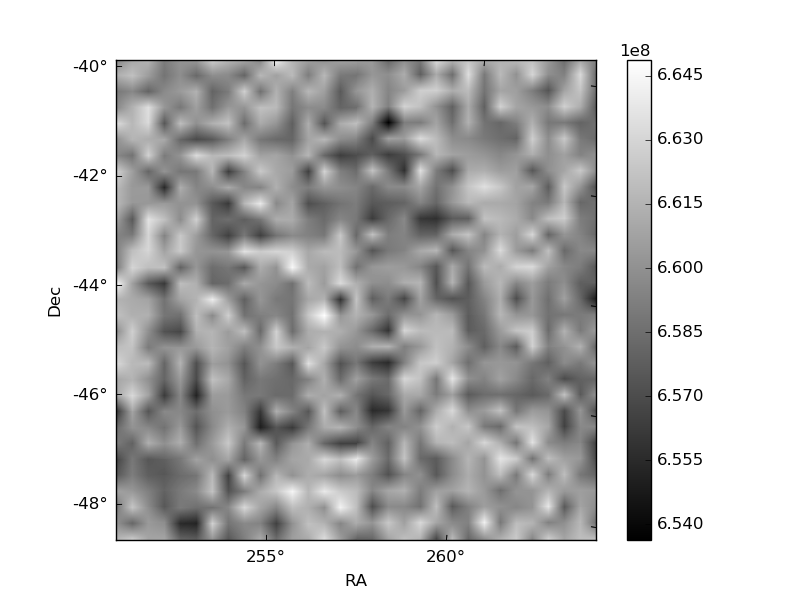
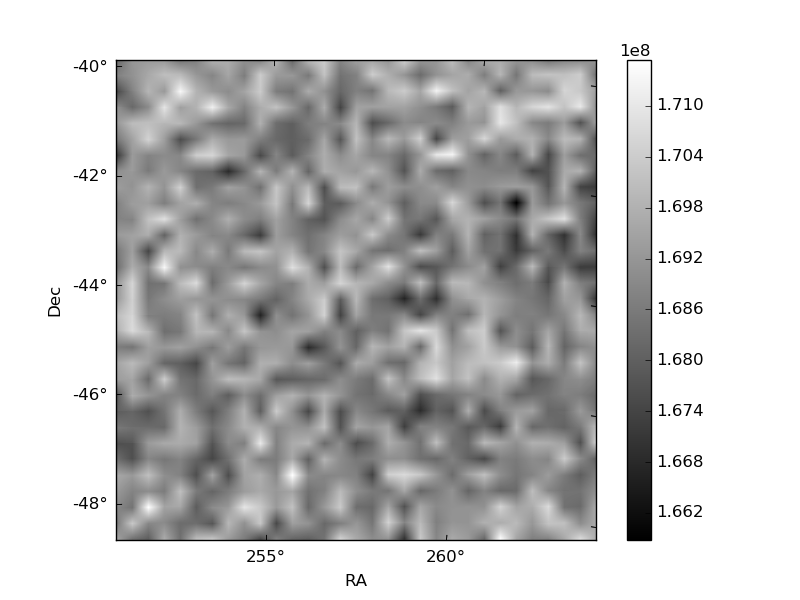
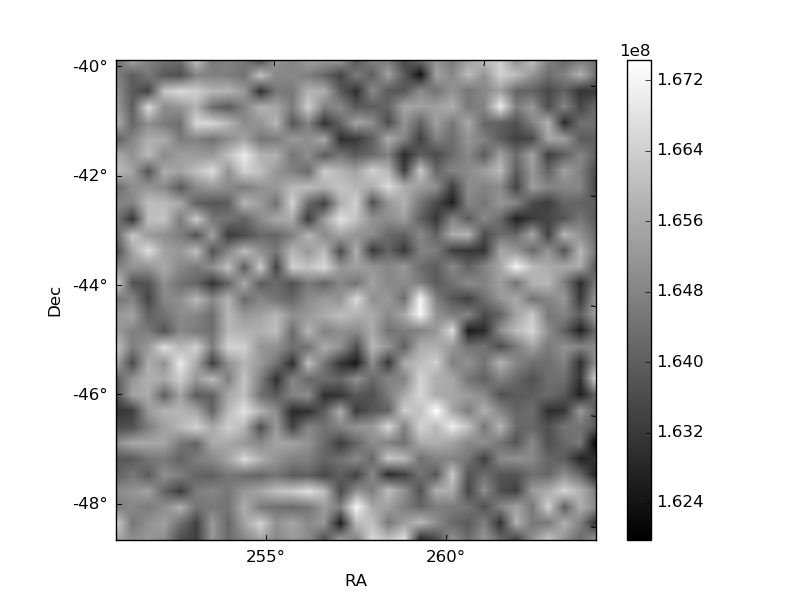
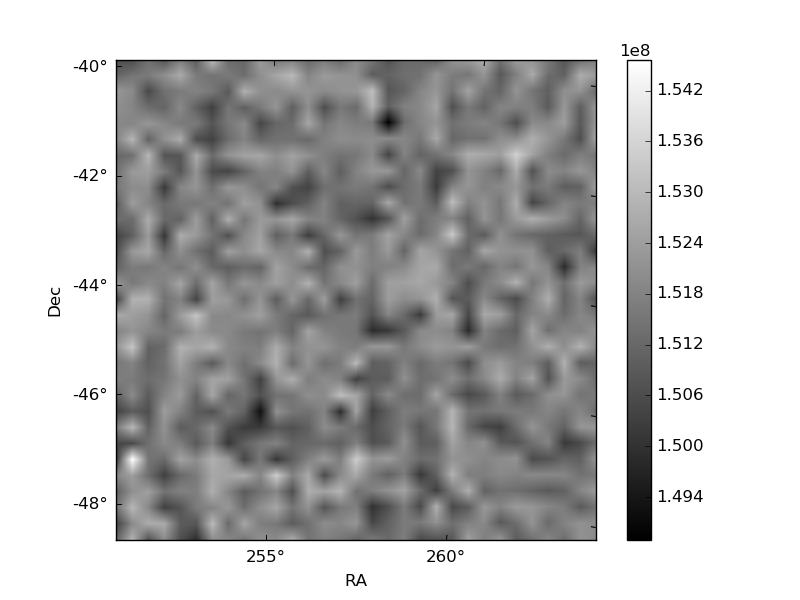
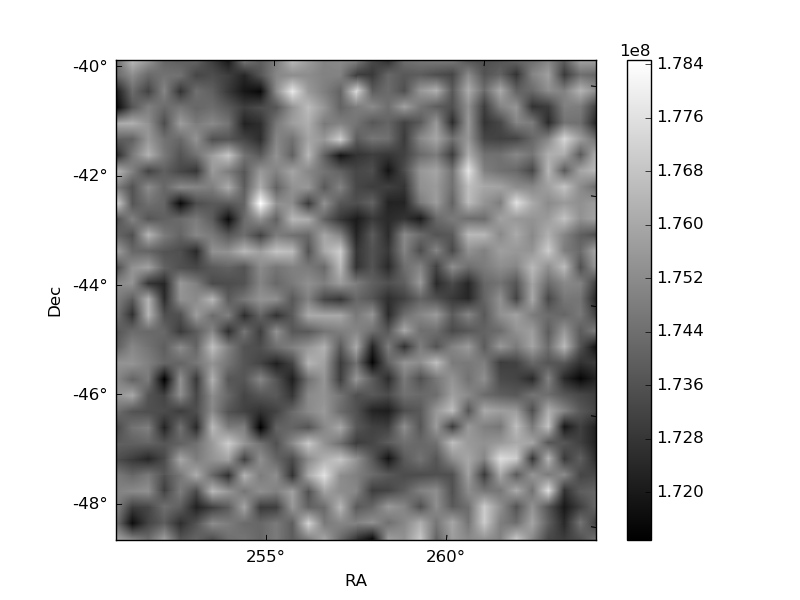
Histogram calculated using DETX and DETY for each event in the final _common_clean file
| Quadrant A | 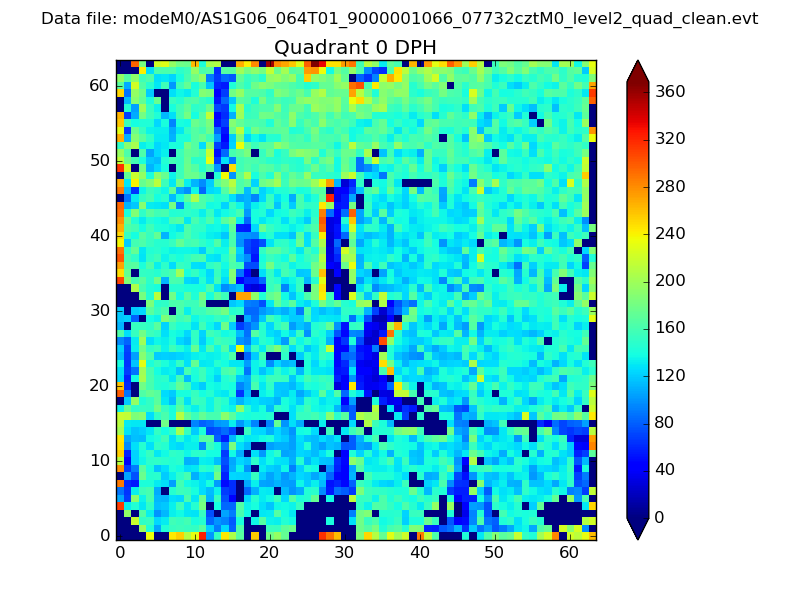 |
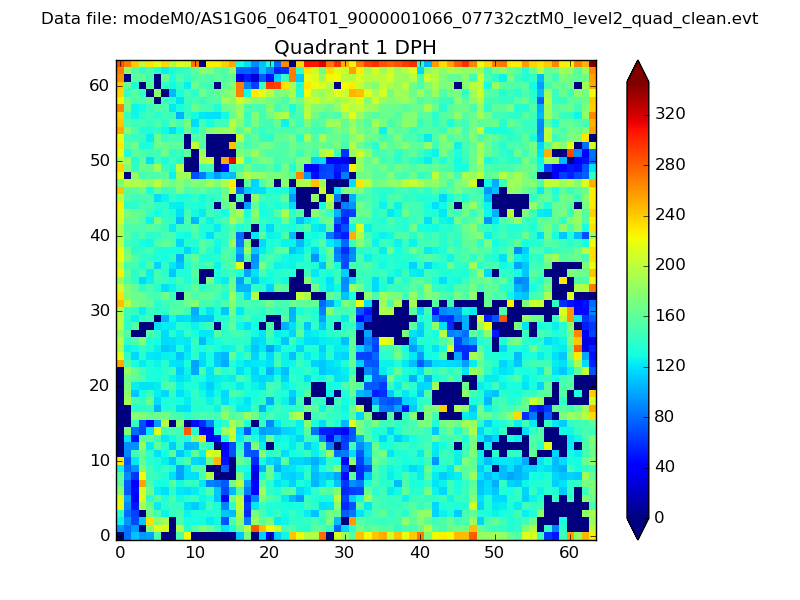 |
Quadrant B |
|---|---|---|---|
| Quadrant D | 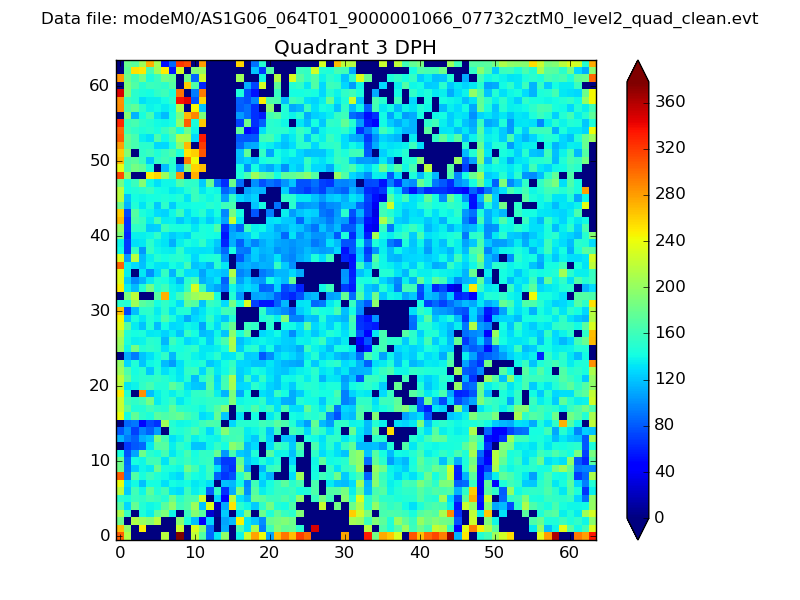 |
 |
Quadrant C |
| Plot type | Count rate plots | Images |
|---|---|---|
| Comparison with Poisson distribution Blue bars denote a histogram of data divided into 1 sec bins. Red curve is a Poisson curve with rate = median count rate of data. |
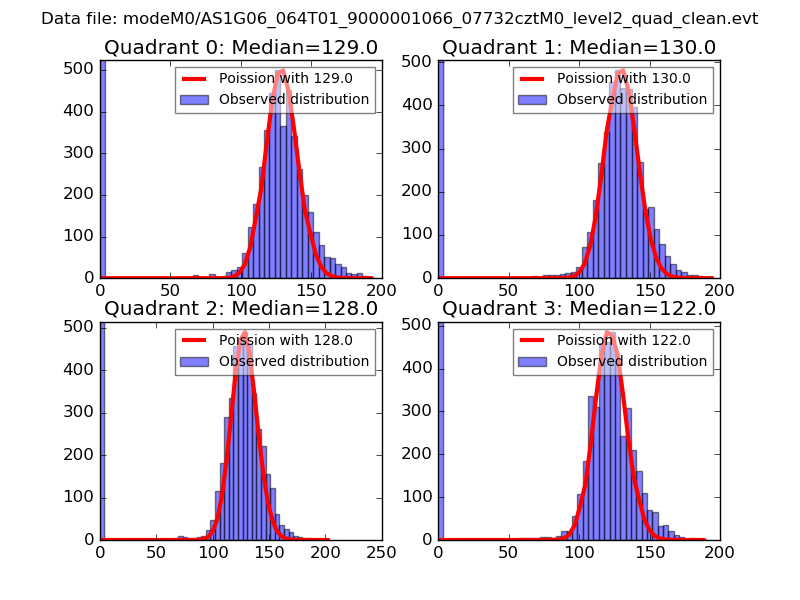 |
 |
| Quadrant-wise count rates Data is divided into 100 sec bins |
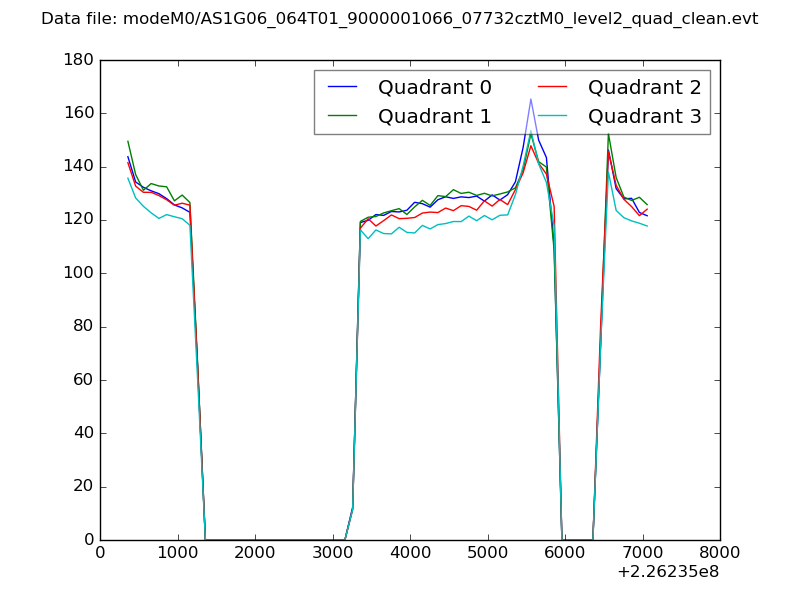 |
|
| Module-wise count rates for Quadrant A Data is divided into 100 sec bins |
 |
 |
| Module-wise count rates for Quadrant B Data is divided into 100 sec bins |
 |
 |
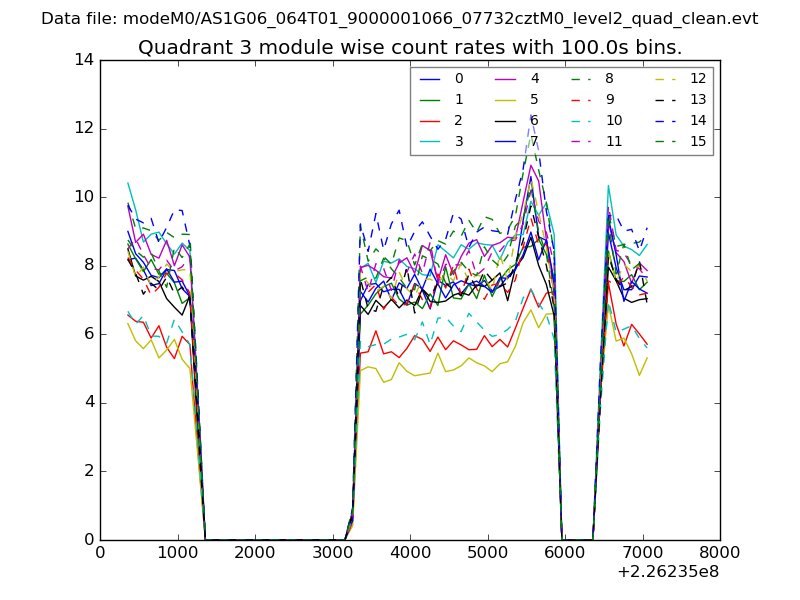
| Module-wise count rates for Quadrant C Data is divided into 100 sec bins |
 |
 |
| Module-wise count rates for Quadrant D Data is divided into 100 sec bins |
 |
 |
| Parameter | Plot |
|---|---|
| CZT HV Monitor |  |
| D_VDD | 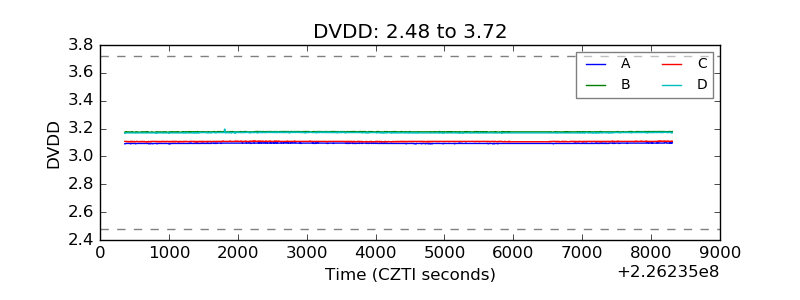 |
| Temperature 1 |  |
| Veto HV Monitor | 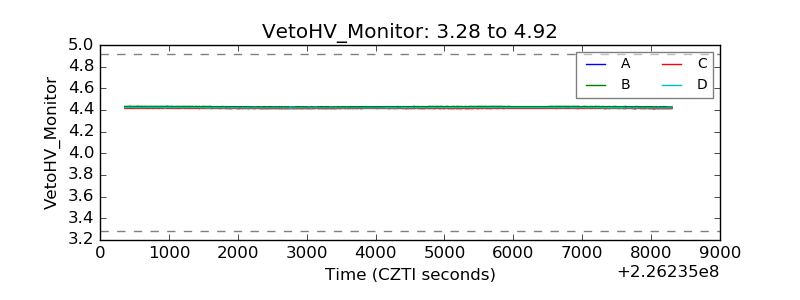 |
| Veto LLD |  |
| Alpha Counter | 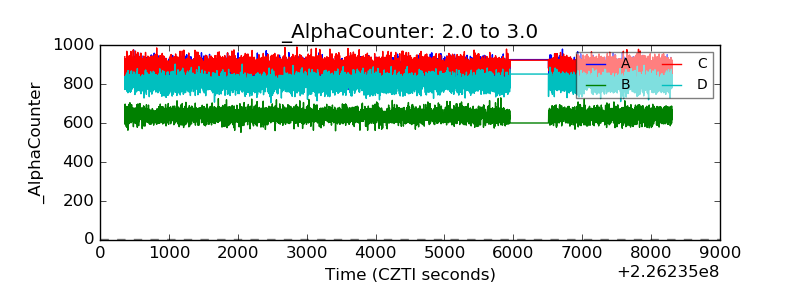 |
| _CPM_Rate | 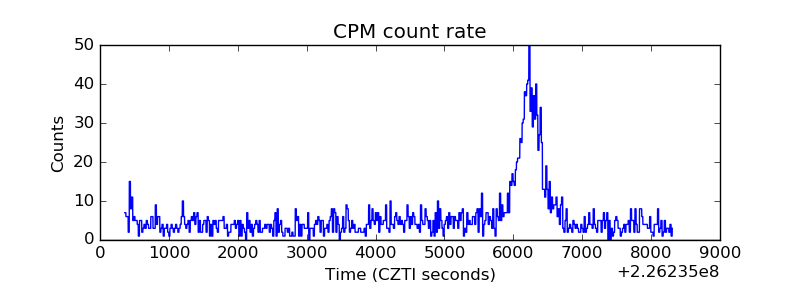 |
| CZT Counter | 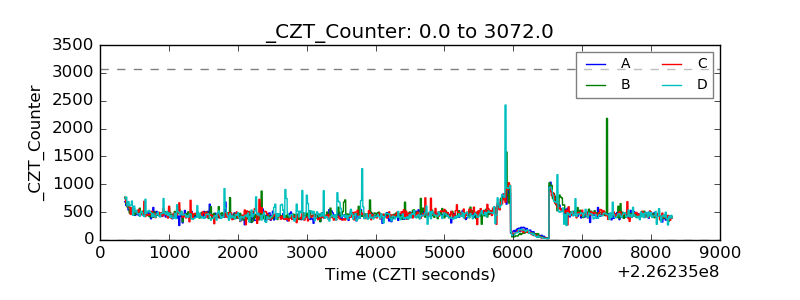 |
| +2.5 Volts monitor |  |
| +5 Volts monitor |  |
| _ROLL_ROT | 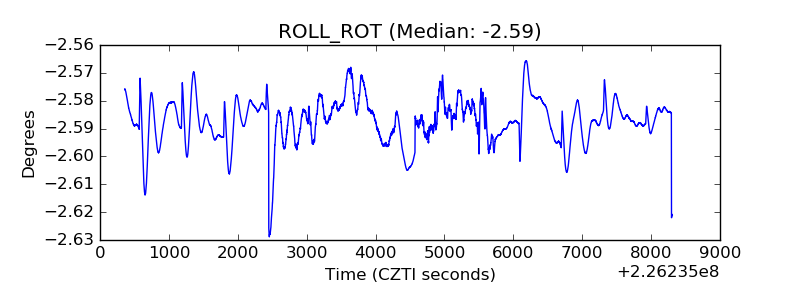 |
| _Roll_DEC | 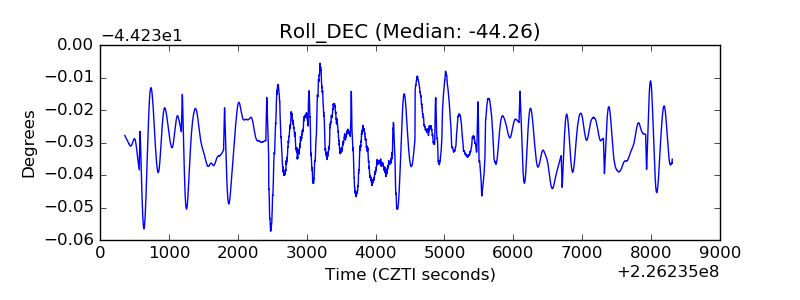 |
| _Roll_RA | 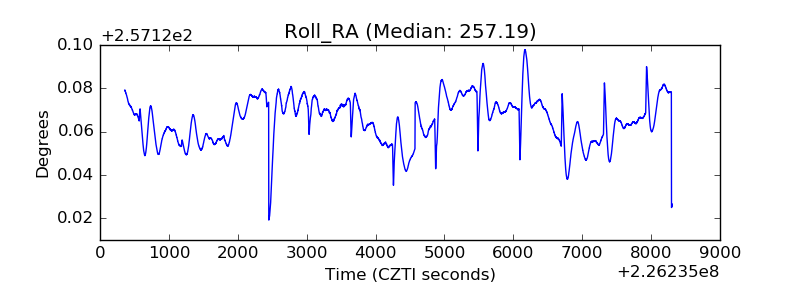 |
| Veto Counter | 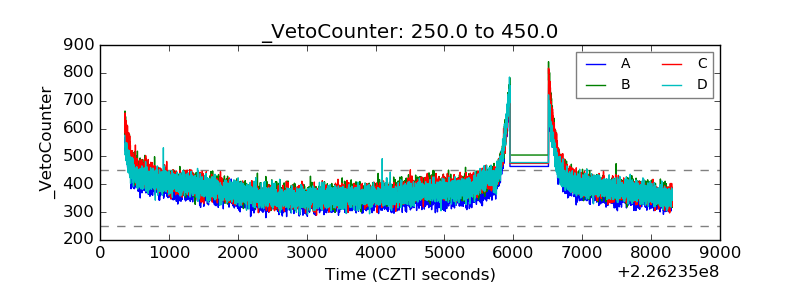 |