| Param | Original file | Final file |
|---|---|---|
| Filename | modeM0/AS1G06_064T01_9000001066_07733cztM0_level2.evt | modeM0/AS1G06_064T01_9000001066_07733cztM0_level2_quad_clean.evt |
| Size (bytes) | 524,436,480 | 89,565,120 |
| Size | 500.1 MB | 85.4 MB |
| Events in quadrant A | 3,794,443 | 548,429 |
| Events in quadrant B | 3,882,969 | 553,022 |
| Events in quadrant C | 3,919,350 | 543,947 |
| Events in quadrant D | 3,752,433 | 520,758 |
| Mode SS | |||
|---|---|---|---|
| Quadrant | BADHDUFLAG | Total packets | Discarded packets |
| A | 0 | 158 | 0 |
| B | 0 | 158 | 0 |
| C | 0 | 158 | 0 |
| D | 0 | 158 | 0 |
| Mode M0 | |||
|---|---|---|---|
| Quadrant | BADHDUFLAG | Total packets | Discarded packets |
| A | 0 | 16657 | 5 |
| B | 0 | 16753 | 4 |
| C | 0 | 16813 | 4 |
| D | 0 | 16738 | 4 |
| Quadrant | Total seconds | Saturated seconds | Saturation percentage |
|---|---|---|---|
| A | 7845 | 306 | 3.900574% |
| B | 7845 | 312 | 3.977055% |
| C | 7845 | 213 | 2.715105% |
| D | 7845 | 227 | 2.893563% |
Noise dominated data is calculated using 1-second bins in cleaned event files. If a bin has >2000 counts, and if more than 50% of those come from <1% of pixels, then it is considered to be noise-dominated and hence unusable.
| Quadrant | # 1 sec bins | Bins with >0 counts | Bins with >2000 counts | High rate bins dominated by noise | Noise dominated (total time) | Noise dominated (detector-on time) | Marked lightcurve |
|---|---|---|---|---|---|---|---|
| A | 7925 | 7847 | 1 | 1 | 0.01% | 0.01% | 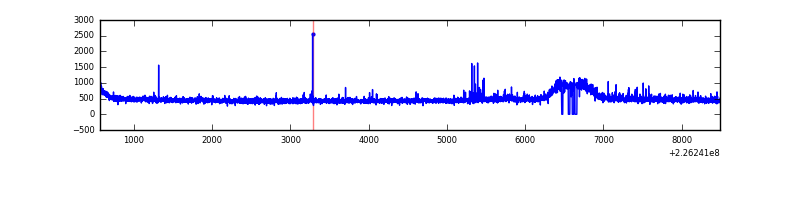 |
| B | 7925 | 7847 | 10 | 10 | 0.13% | 0.13% | 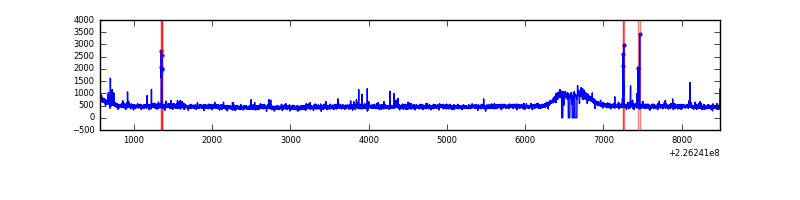 |
| C | 7925 | 7849 | 1 | 1 | 0.01% | 0.01% | 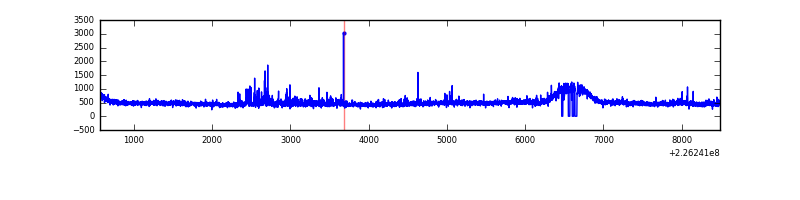 |
| D | 7925 | 7848 | 5 | 5 | 0.06% | 0.06% | 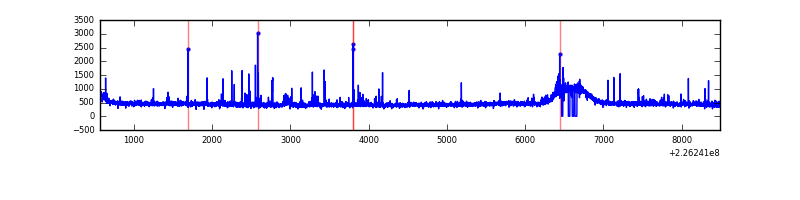 |
Top three noisy pixels from each quadrant. If the there are fewer than three noisy pixels in the level2.evt file, extra rows are filled as -1
| Pixel properties | Quadrant properties | ||||||
|---|---|---|---|---|---|---|---|
| Quadrant | DetID | PixID | Counts | Sigma | Mean | Median | Sigma |
| A | 0 | 23 | 58741 | 293.18 | 960 | 935 | 197.2 |
| A | 3 | 1 | 16930 | 81.12 | 960 | 935 | 197.2 |
| A | 0 | 226 | 13204 | 62.23 | 960 | 935 | 197.2 |
| B | 4 | 239 | 45166 | 235.12 | 961 | 937 | 188.1 |
| B | 0 | 214 | 33745 | 174.4 | 961 | 937 | 188.1 |
| B | 4 | 81 | 32306 | 166.75 | 961 | 937 | 188.1 |
| C | 9 | 68 | 262262 | 1191.97 | 935 | 937 | 219.2 |
| C | 13 | 61 | 7386 | 29.42 | 935 | 937 | 219.2 |
| C | 8 | 222 | 3771 | 12.93 | 935 | 937 | 219.2 |
| D | 13 | 104 | 31474 | 132.46 | 941 | 914 | 230.7 |
| D | 7 | 55 | 29681 | 124.69 | 941 | 914 | 230.7 |
| D | 2 | 234 | 25468 | 106.43 | 941 | 914 | 230.7 |
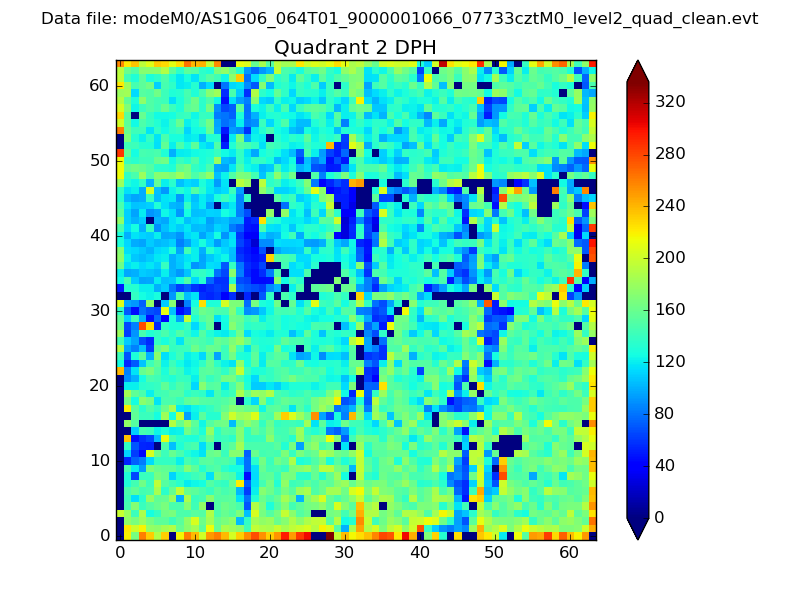
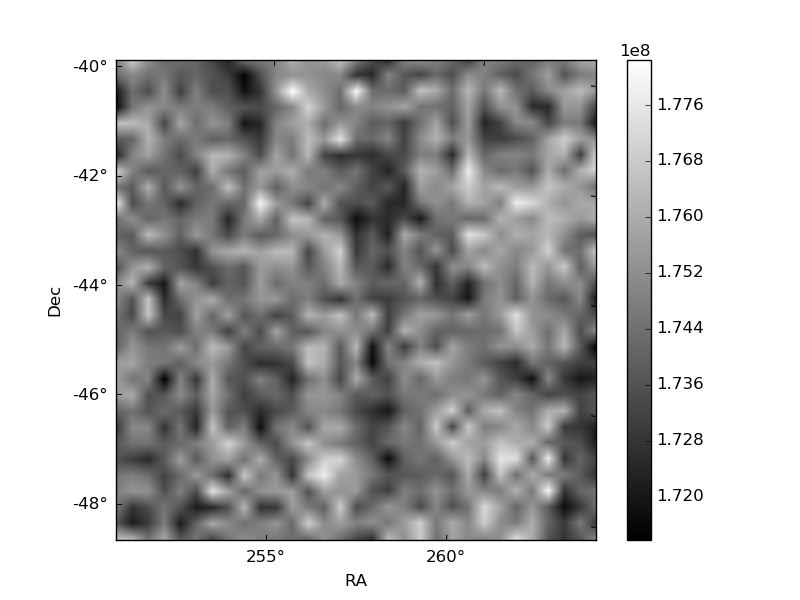
Histogram calculated using DETX and DETY for each event in the final _common_clean file
| Quadrant A | 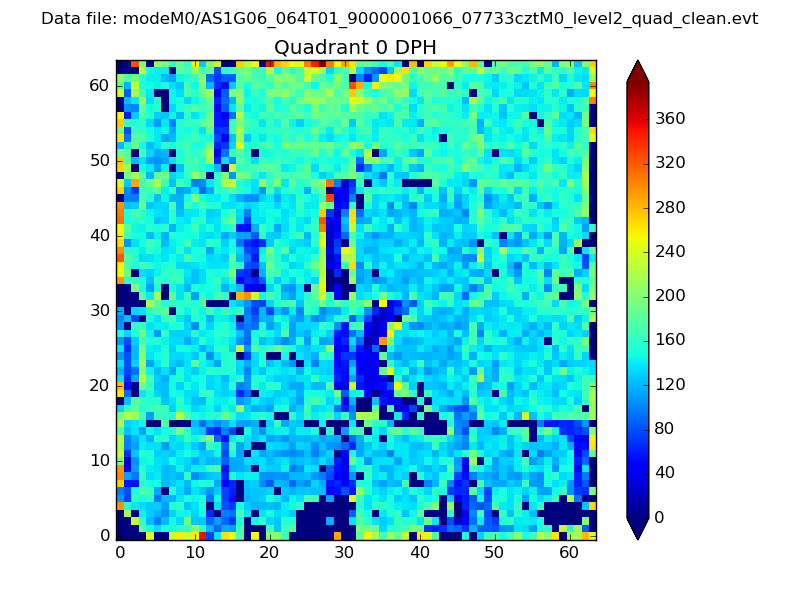 |
 |
Quadrant B |
|---|---|---|---|
| Quadrant D |  |
 |
Quadrant C |
| Plot type | Count rate plots | Images |
|---|---|---|
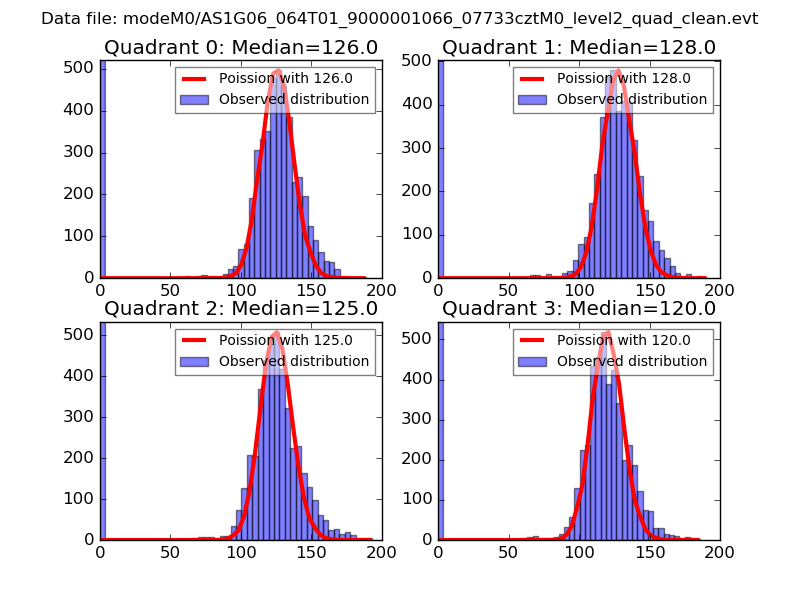
| Comparison with Poisson distribution Blue bars denote a histogram of data divided into 1 sec bins. Red curve is a Poisson curve with rate = median count rate of data. |
 |
 |
| Quadrant-wise count rates Data is divided into 100 sec bins |
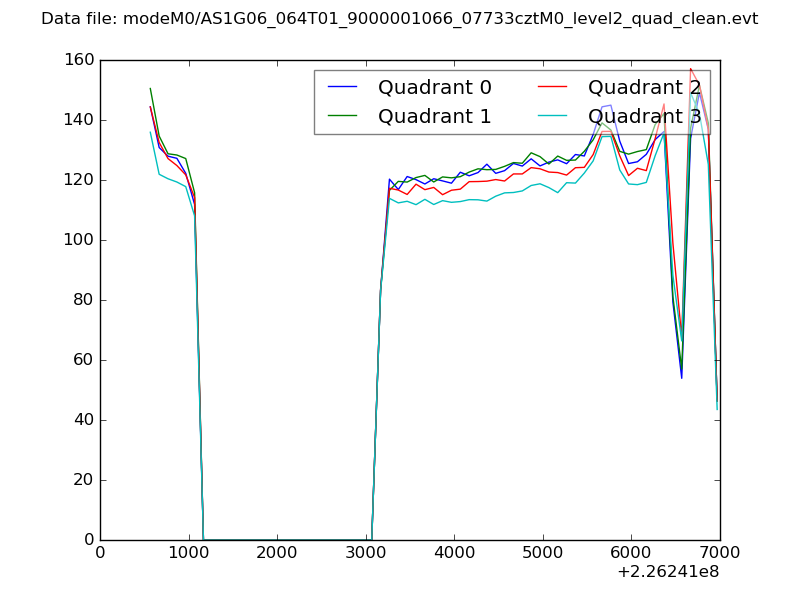 |
|
| Module-wise count rates for Quadrant A Data is divided into 100 sec bins |
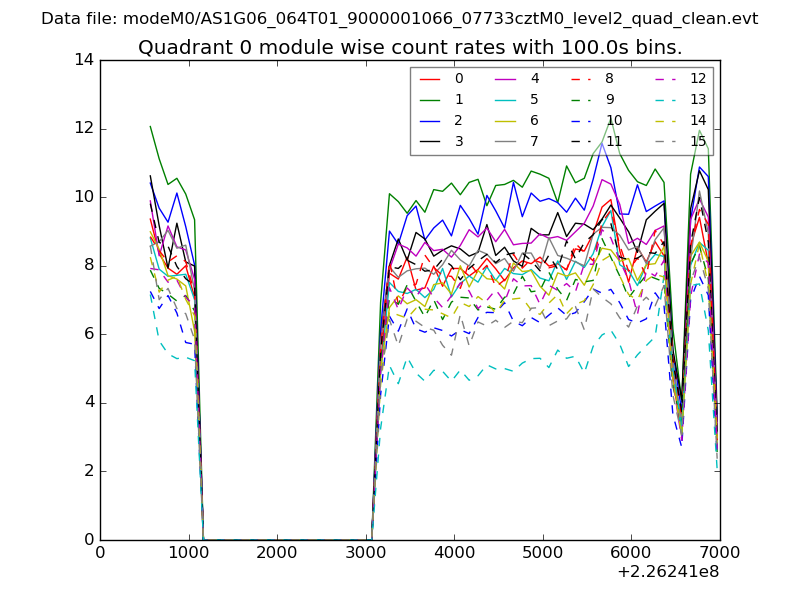 |
 |
| Module-wise count rates for Quadrant B Data is divided into 100 sec bins |
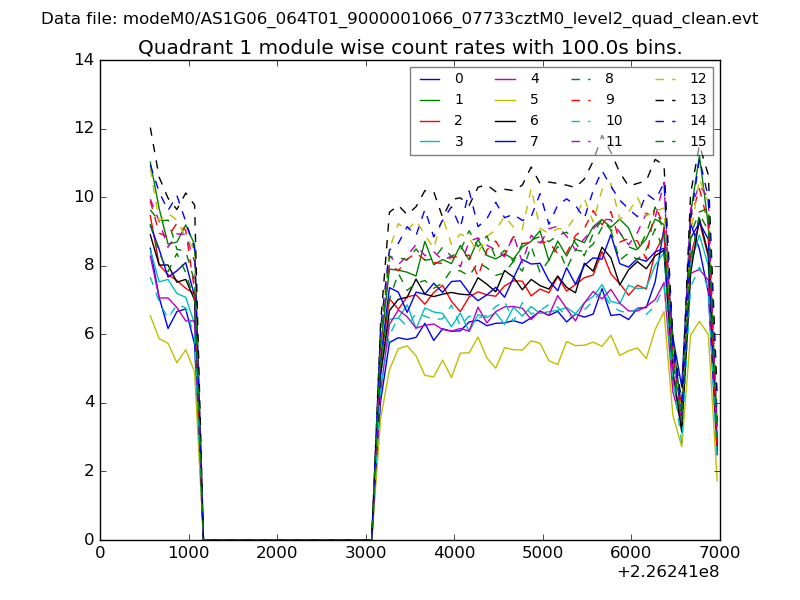 |
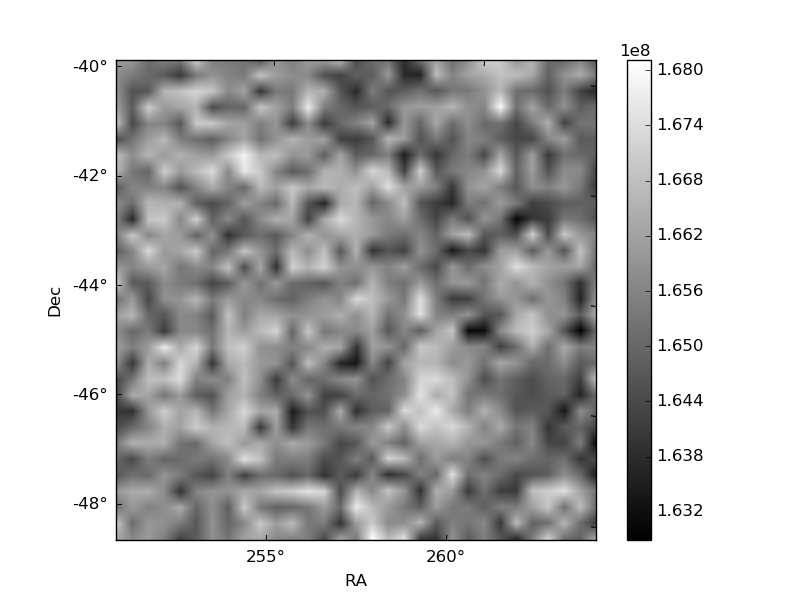 |
| Module-wise count rates for Quadrant C Data is divided into 100 sec bins |
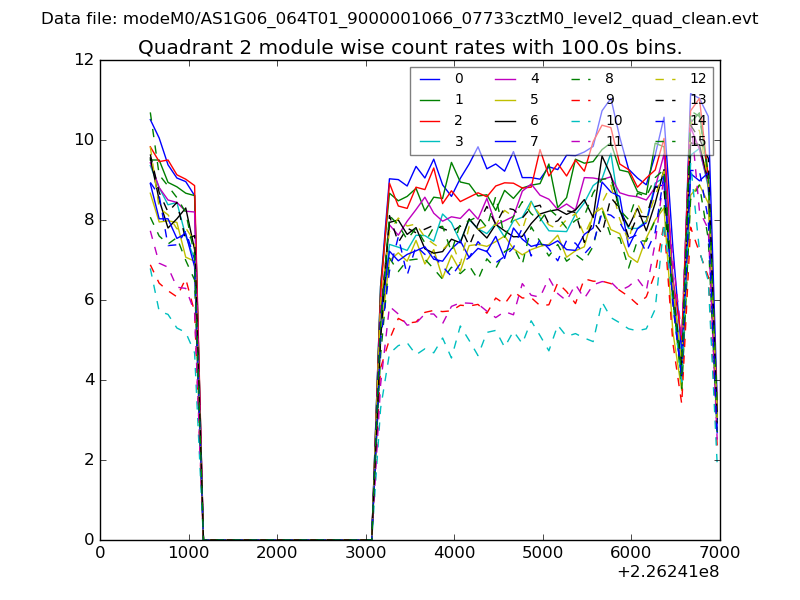 |
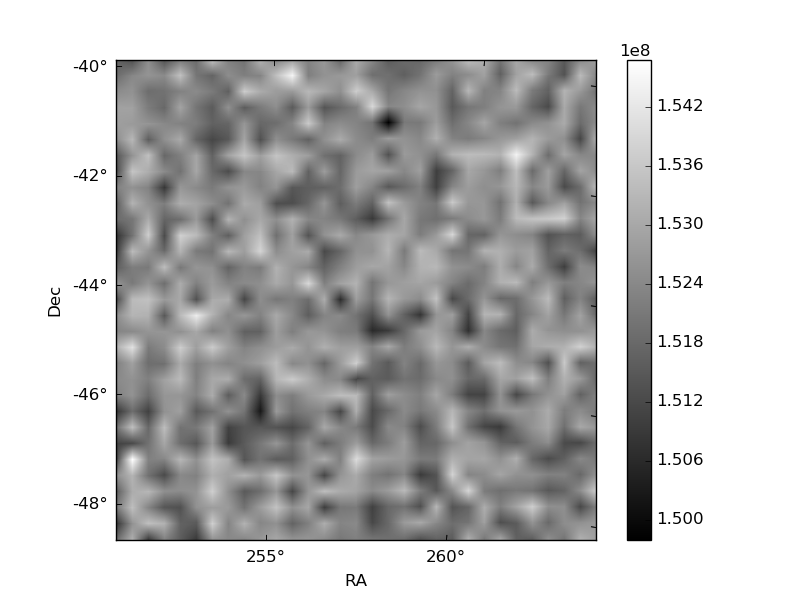 |
| Module-wise count rates for Quadrant D Data is divided into 100 sec bins |
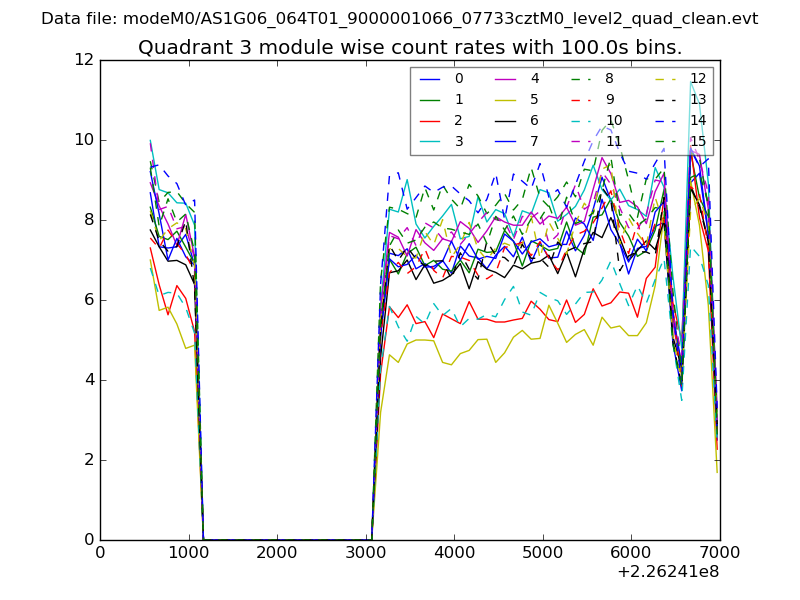 |
 |
| Parameter | Plot |
|---|---|
| CZT HV Monitor |  |
| D_VDD | 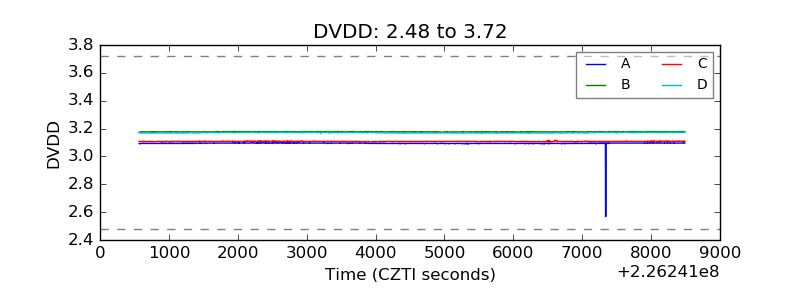 |
| Temperature 1 | 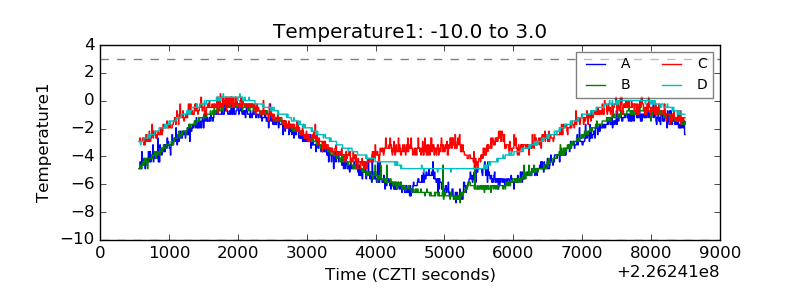 |
| Veto HV Monitor | 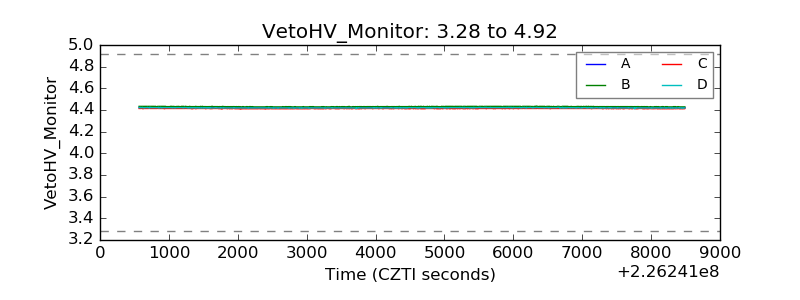 |
| Veto LLD | 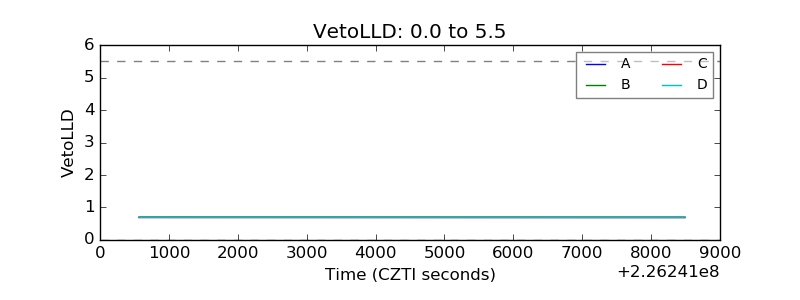 |
| Alpha Counter | 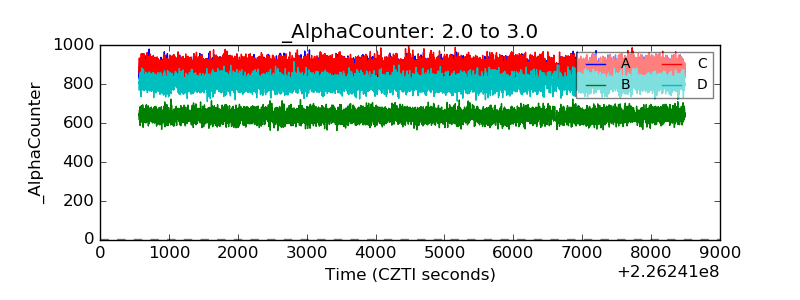 |
| _CPM_Rate | 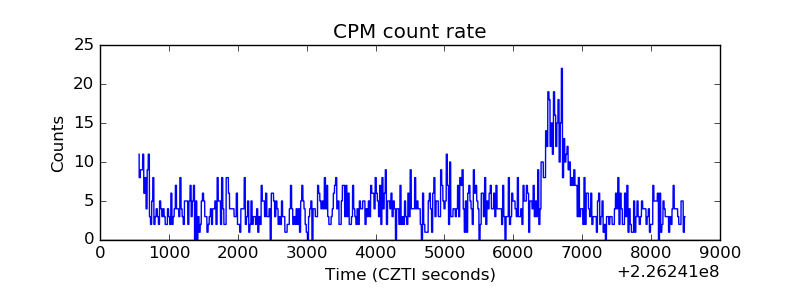 |
| CZT Counter | 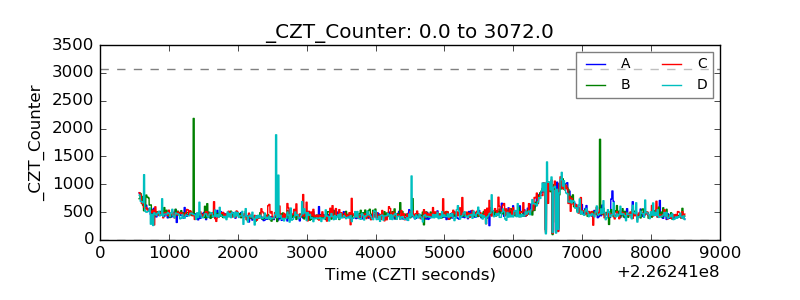 |
| +2.5 Volts monitor |  |
| +5 Volts monitor |  |
| _ROLL_ROT | 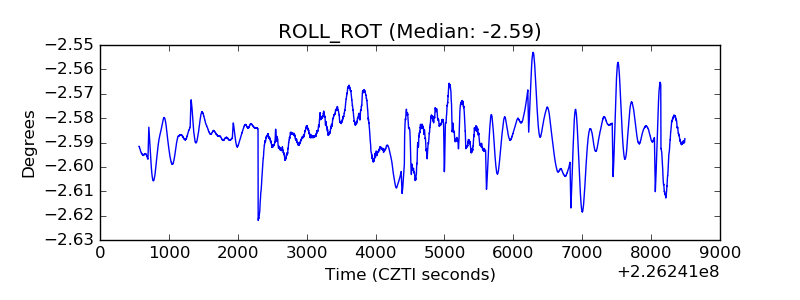 |
| _Roll_DEC | 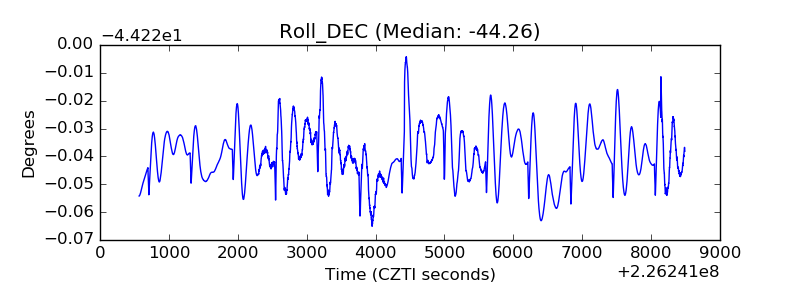 |
| _Roll_RA | 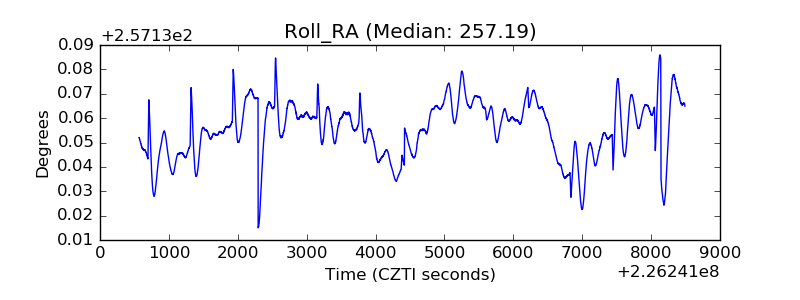 |
| Veto Counter | 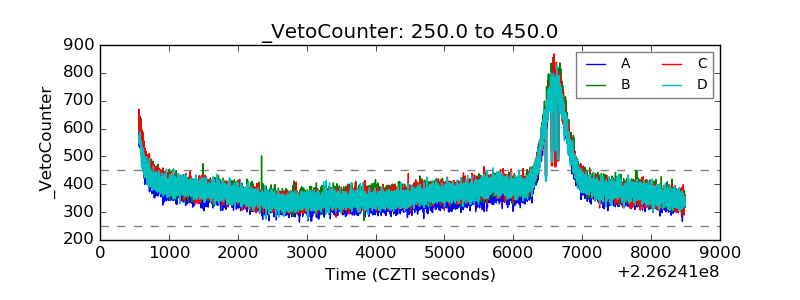 |