| Param | Original file | Final file |
|---|---|---|
| Filename | modeM0/AS1G06_064T01_9000001066_07737cztM0_level2.evt | modeM0/AS1G06_064T01_9000001066_07737cztM0_level2_quad_clean.evt |
| Size (bytes) | 1,218,444,480 | 240,373,440 |
| Size | 1.1 GB | 229.2 MB |
| Events in quadrant A | 8,812,564 | 1,522,837 |
| Events in quadrant B | 9,204,380 | 1,535,113 |
| Events in quadrant C | 8,697,393 | 1,491,730 |
| Events in quadrant D | 8,908,691 | 1,430,186 |
| Mode SS | |||
|---|---|---|---|
| Quadrant | BADHDUFLAG | Total packets | Discarded packets |
| A | 0 | 386 | 0 |
| B | 0 | 386 | 0 |
| C | 0 | 386 | 0 |
| D | 0 | 386 | 0 |
| Mode M0 | |||
|---|---|---|---|
| Quadrant | BADHDUFLAG | Total packets | Discarded packets |
| A | 0 | 39162 | 5 |
| B | 0 | 40061 | 4 |
| C | 0 | 38993 | 4 |
| D | 0 | 39932 | 7 |
| Mode M9 | |||
|---|---|---|---|
| Quadrant | BADHDUFLAG | Total packets | Discarded packets |
| A | 0 | 19 | 0 |
| B | 0 | 19 | 0 |
| C | 0 | 19 | 0 |
| D | 0 | 19 | 0 |
| Quadrant | Total seconds | Saturated seconds | Saturation percentage |
|---|---|---|---|
| A | 18877 | 211 | 1.117762% |
| B | 18877 | 284 | 1.504476% |
| C | 18877 | 130 | 0.688669% |
| D | 18876 | 193 | 1.022462% |
Noise dominated data is calculated using 1-second bins in cleaned event files. If a bin has >2000 counts, and if more than 50% of those come from <1% of pixels, then it is considered to be noise-dominated and hence unusable.
| Quadrant | # 1 sec bins | Bins with >0 counts | Bins with >2000 counts | High rate bins dominated by noise | Noise dominated (total time) | Noise dominated (detector-on time) | Marked lightcurve |
|---|---|---|---|---|---|---|---|
| A | 20769 | 18879 | 1 | 1 | 0.00% | 0.01% |  |
| B | 20769 | 18880 | 20 | 20 | 0.10% | 0.11% |  |
| C | 20769 | 18881 | 6 | 6 | 0.03% | 0.03% |  |
| D | 20768 | 18880 | 56 | 56 | 0.27% | 0.30% |  |
Top three noisy pixels from each quadrant. If the there are fewer than three noisy pixels in the level2.evt file, extra rows are filled as -1
| Pixel properties | Quadrant properties | ||||||
|---|---|---|---|---|---|---|---|
| Quadrant | DetID | PixID | Counts | Sigma | Mean | Median | Sigma |
| A | 0 | 23 | 204766 | 444.12 | 2215 | 2164 | 456.2 |
| A | 0 | 226 | 35295 | 72.63 | 2215 | 2164 | 456.2 |
| A | 3 | 1 | 25754 | 51.71 | 2215 | 2164 | 456.2 |
| B | 0 | 229 | 186972 | 432.98 | 2229 | 2175 | 426.8 |
| B | 4 | 239 | 79121 | 180.28 | 2229 | 2175 | 426.8 |
| B | 10 | 252 | 75684 | 172.23 | 2229 | 2175 | 426.8 |
| C | 9 | 68 | 301447 | 602.29 | 2150 | 2159 | 496.9 |
| C | 13 | 61 | 16787 | 29.44 | 2150 | 2159 | 496.9 |
| C | 8 | 222 | 10542 | 16.87 | 2150 | 2159 | 496.9 |
| D | 2 | 152 | 130625 | 246.07 | 2145 | 2077 | 522.4 |
| D | 5 | 233 | 124717 | 234.76 | 2145 | 2077 | 522.4 |
| D | 12 | 233 | 107958 | 202.68 | 2145 | 2077 | 522.4 |
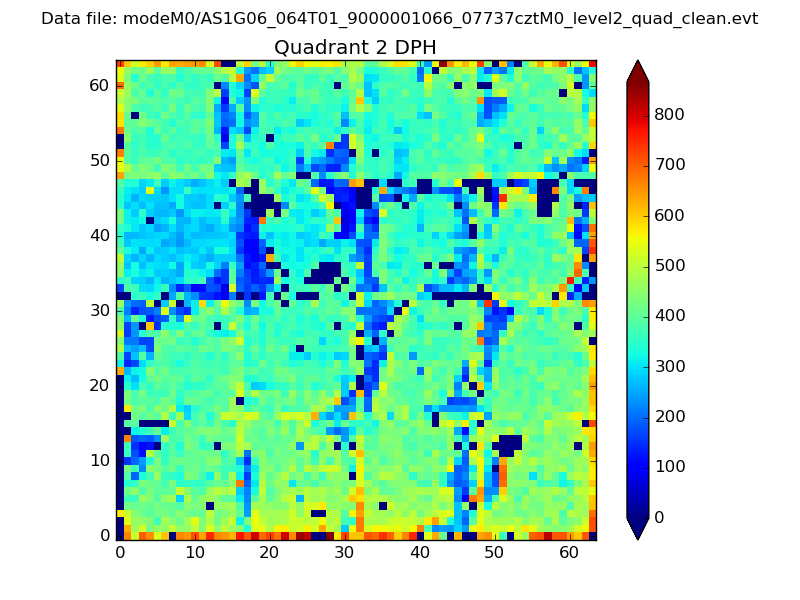
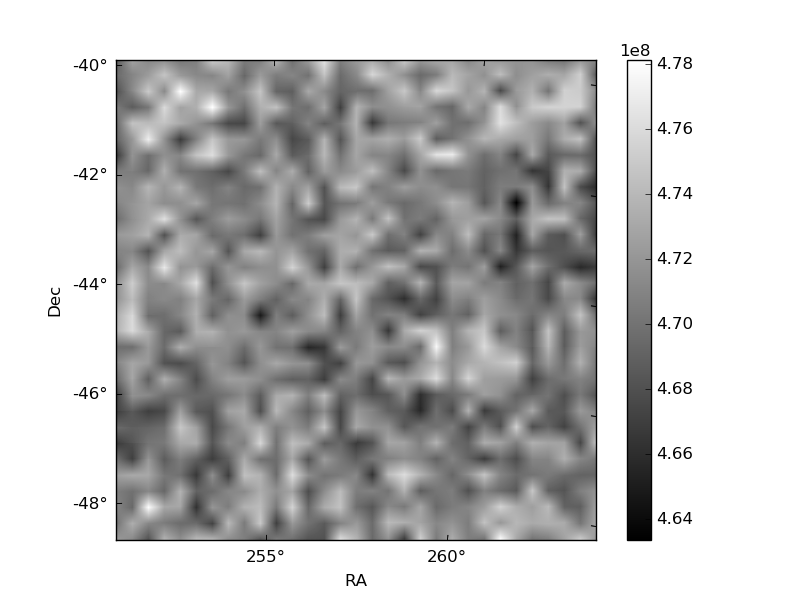
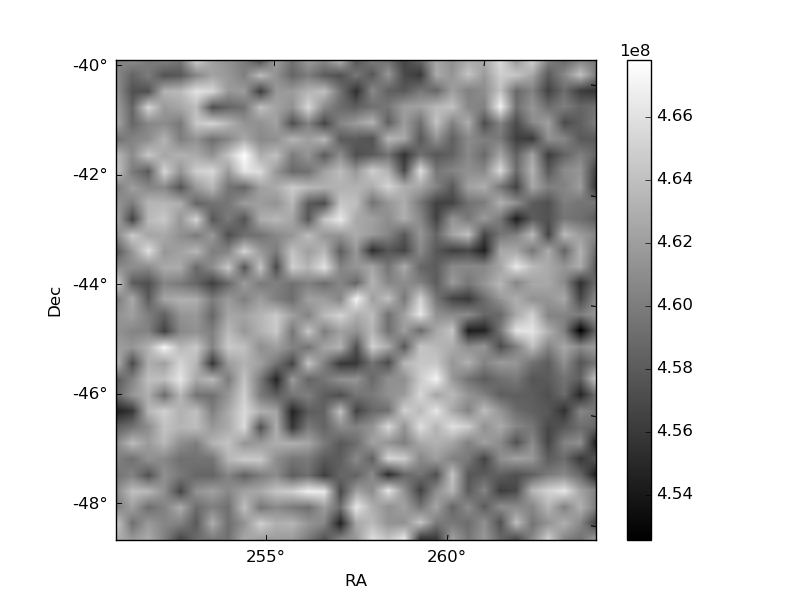
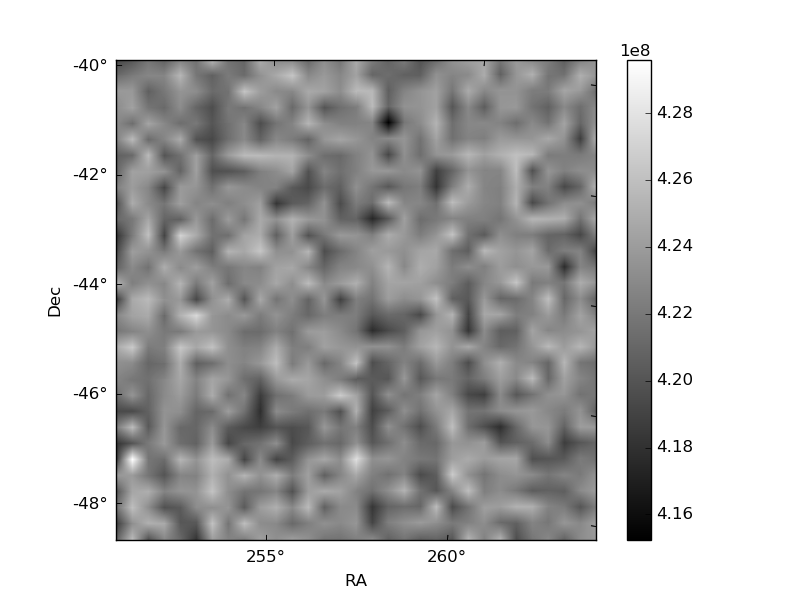
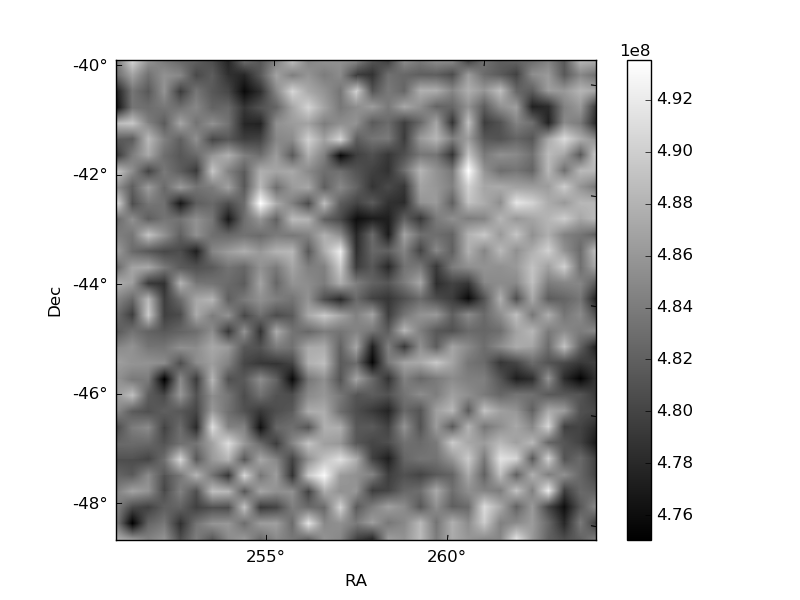
Histogram calculated using DETX and DETY for each event in the final _common_clean file
| Quadrant A | 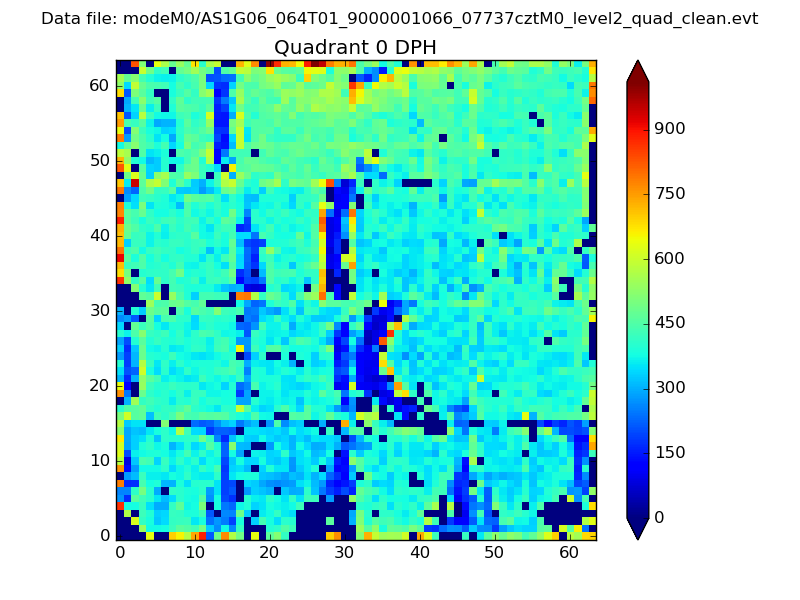 |
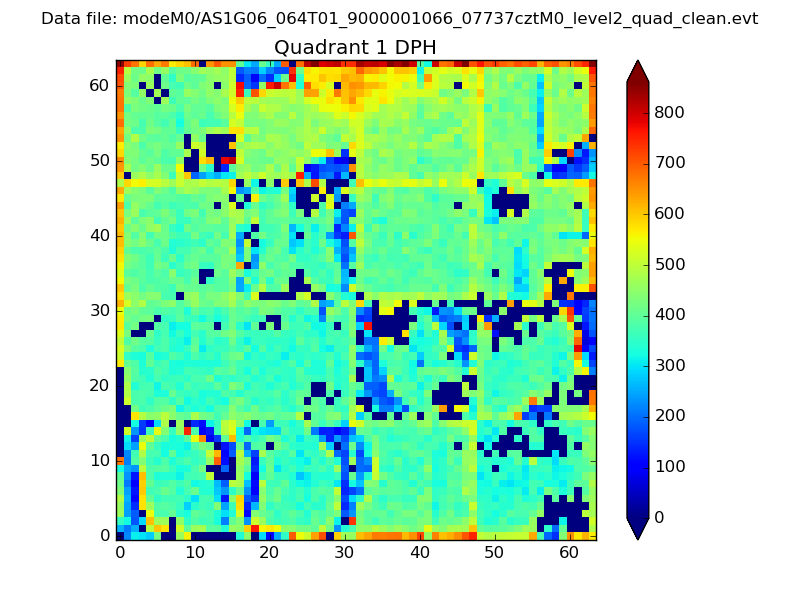 |
Quadrant B |
|---|---|---|---|
| Quadrant D | 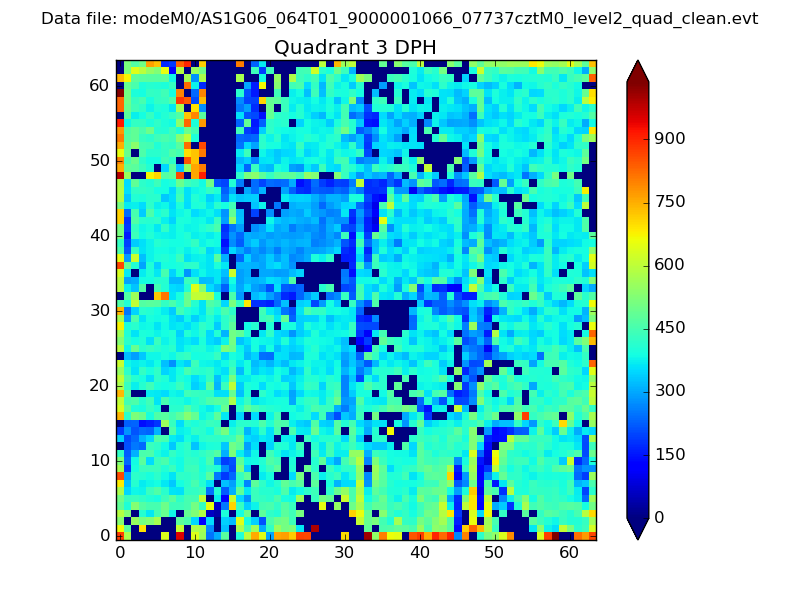 |
 |
Quadrant C |
| Plot type | Count rate plots | Images |
|---|---|---|
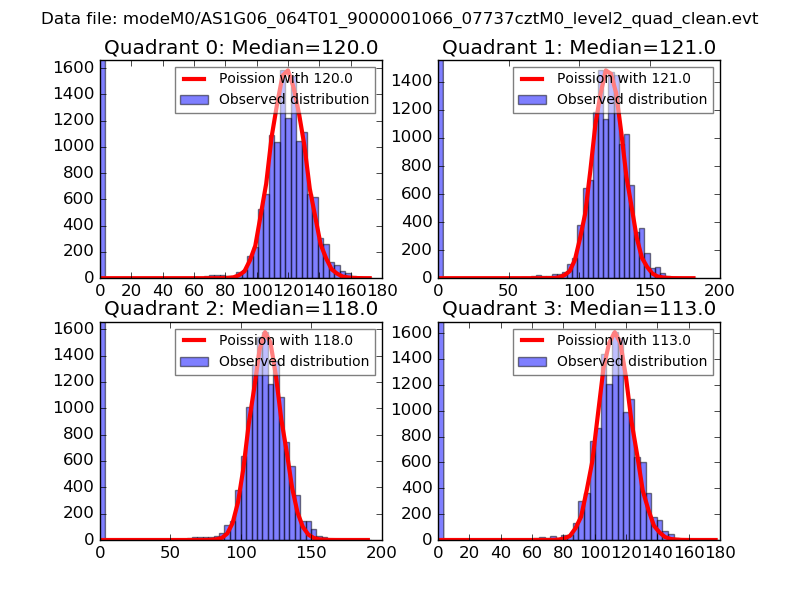
| Comparison with Poisson distribution Blue bars denote a histogram of data divided into 1 sec bins. Red curve is a Poisson curve with rate = median count rate of data. |
 |
 |
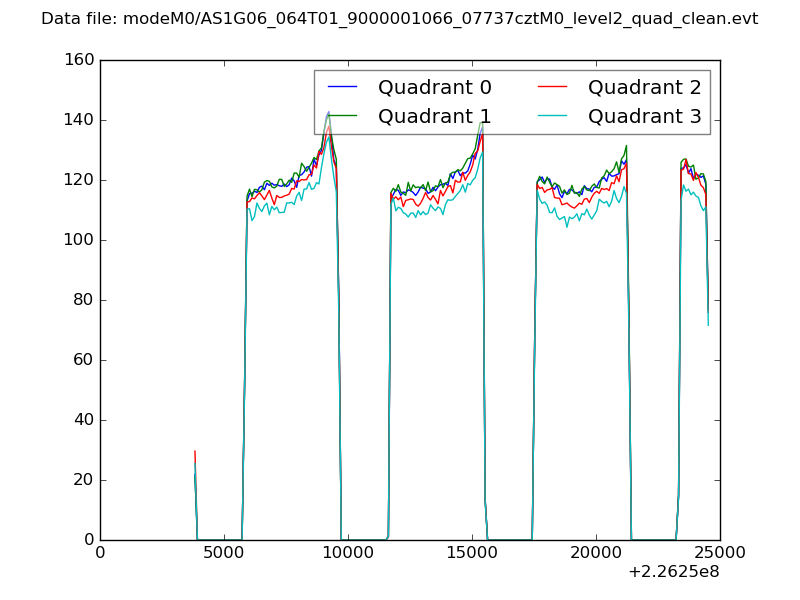
| Quadrant-wise count rates Data is divided into 100 sec bins |
 |
|
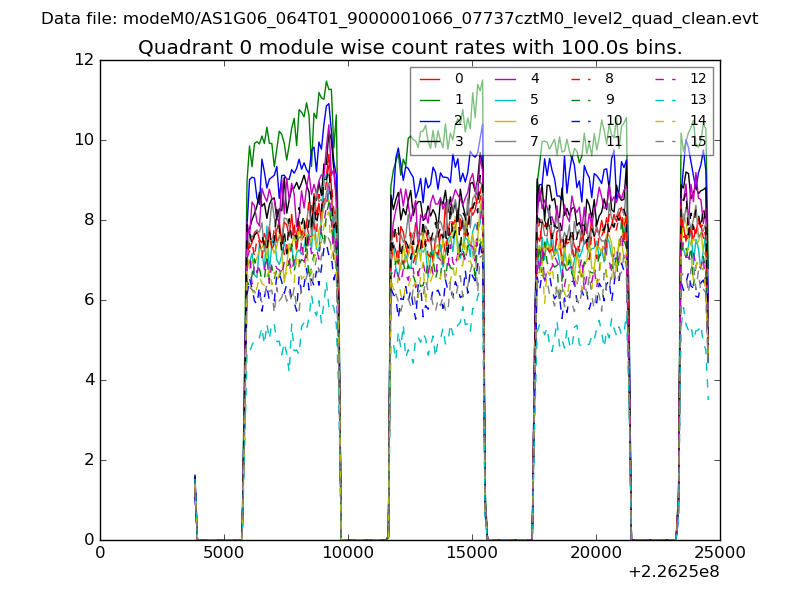
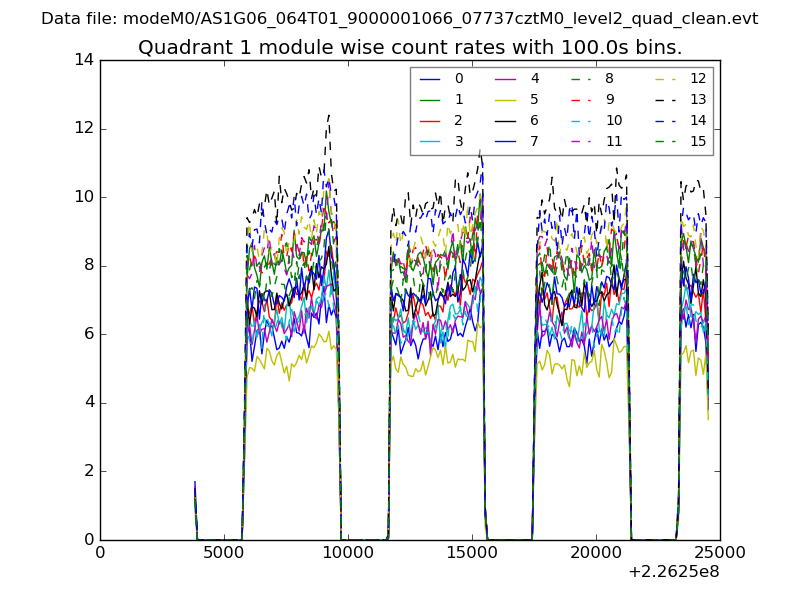
| Module-wise count rates for Quadrant A Data is divided into 100 sec bins |
 |
 |
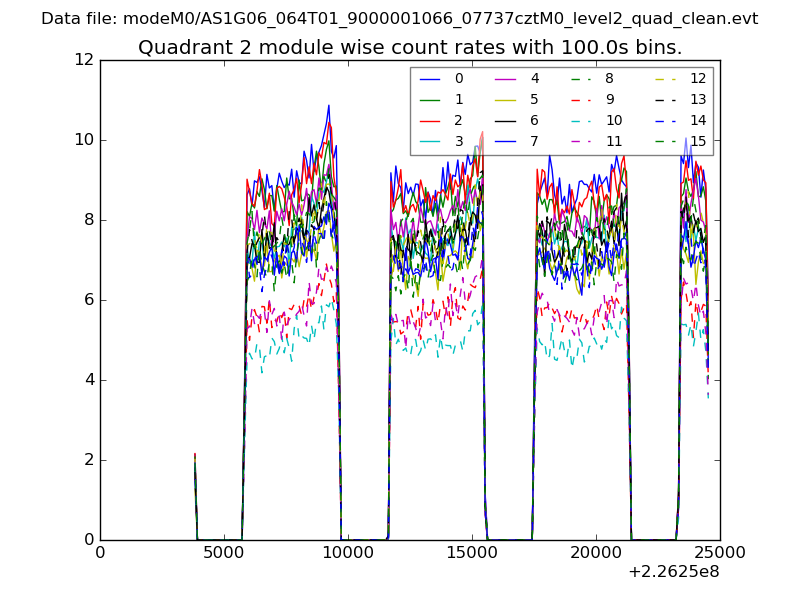
| Module-wise count rates for Quadrant B Data is divided into 100 sec bins |
 |
 |
| Module-wise count rates for Quadrant C Data is divided into 100 sec bins |
 |
 |
| Module-wise count rates for Quadrant D Data is divided into 100 sec bins |
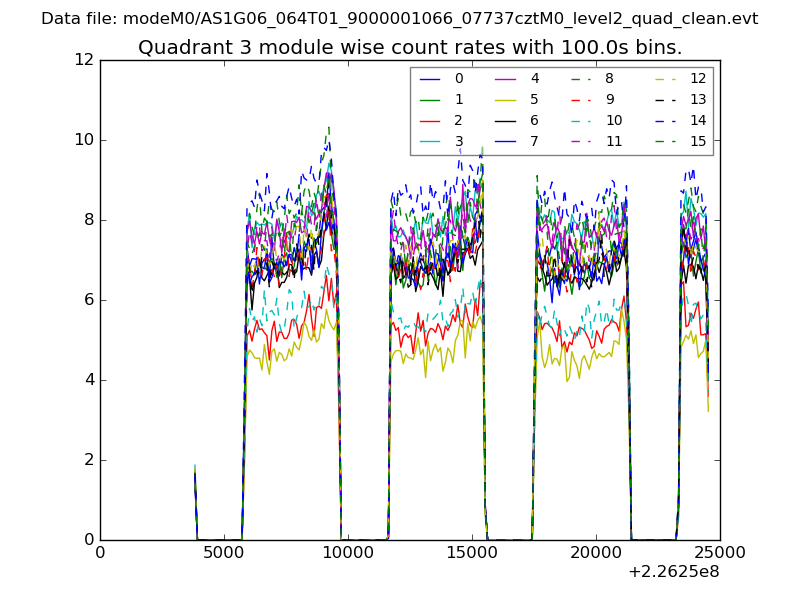 |
 |
| Parameter | Plot |
|---|---|
| CZT HV Monitor | 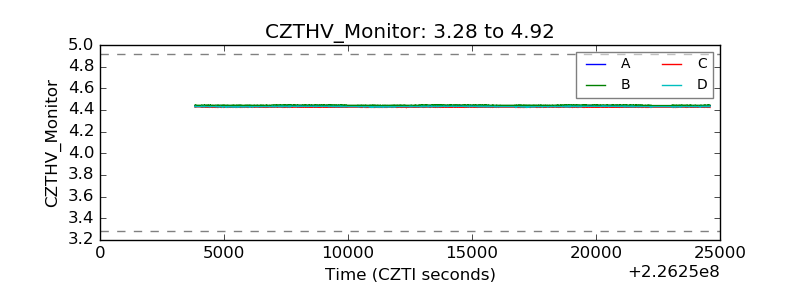 |
| D_VDD | 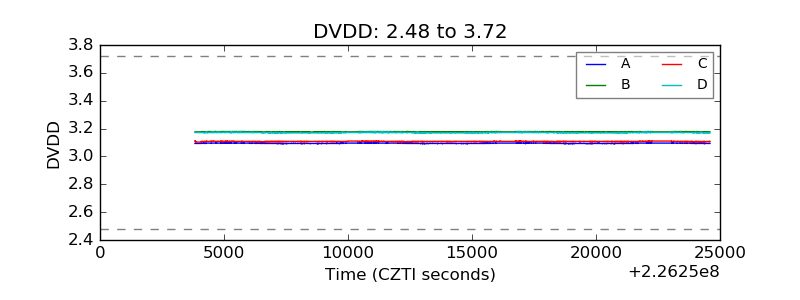 |
| Temperature 1 | 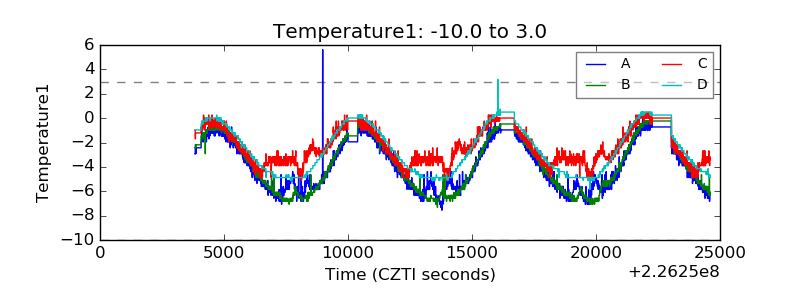 |
| Veto HV Monitor | 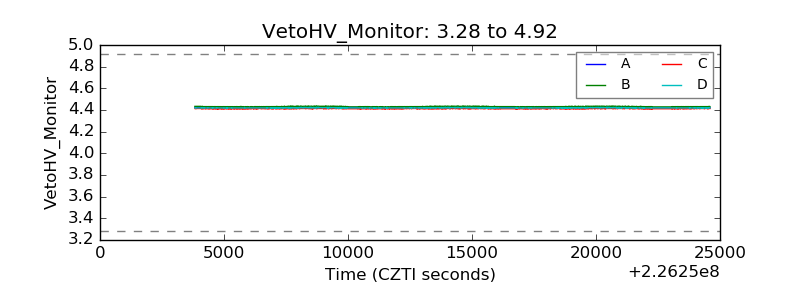 |
| Veto LLD | 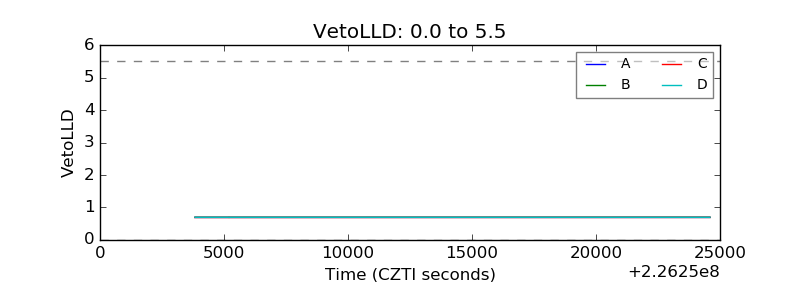 |
| Alpha Counter | 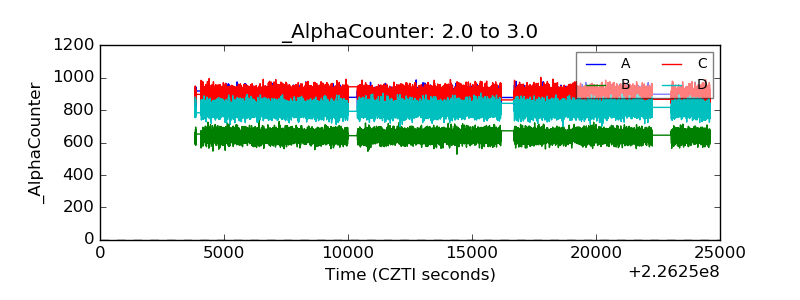 |
| _CPM_Rate | 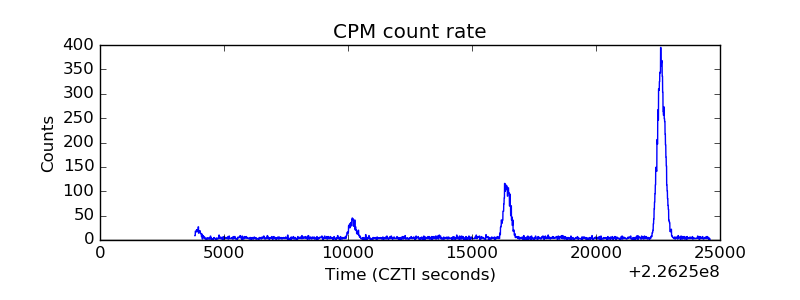 |
| CZT Counter | 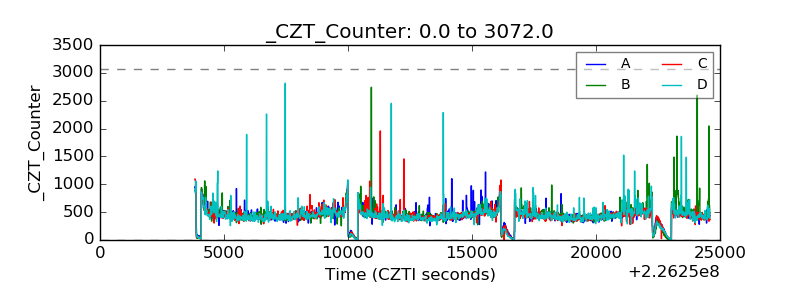 |
| +2.5 Volts monitor |  |
| +5 Volts monitor | 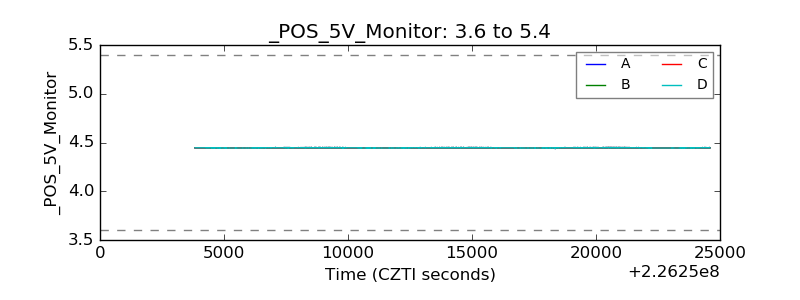 |
| _ROLL_ROT | 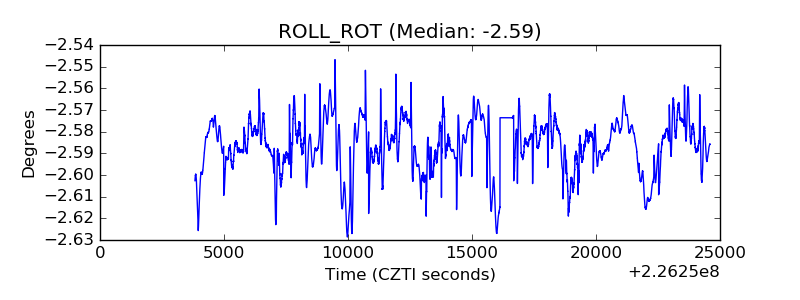 |
| _Roll_DEC | 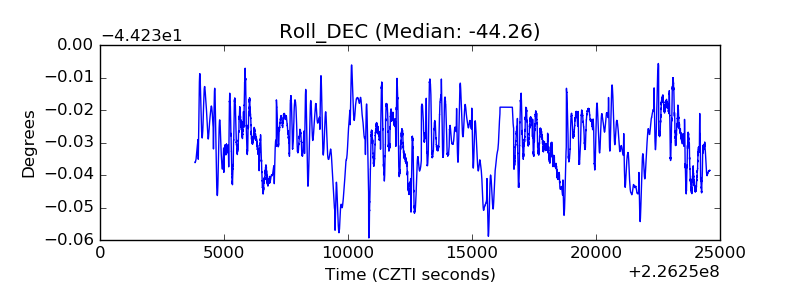 |
| _Roll_RA | 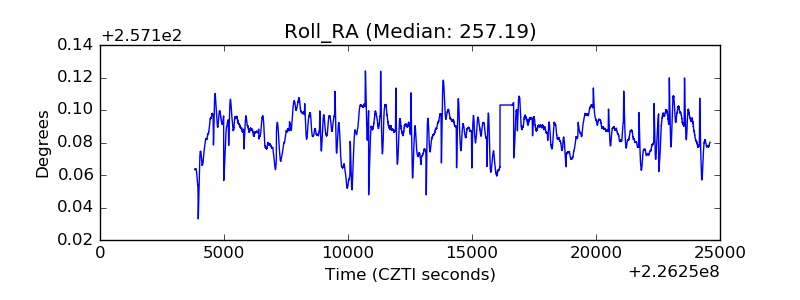 |
| Veto Counter | 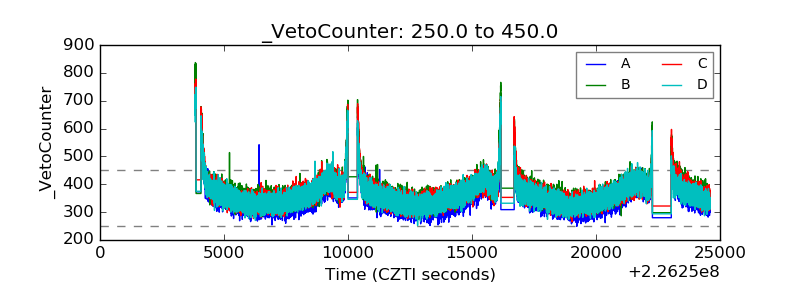 |