| Param | Original file | Final file |
|---|---|---|
| Filename | modeM0/AS1G06_064T01_9000001066_07738cztM0_level2.evt | modeM0/AS1G06_064T01_9000001066_07738cztM0_level2_quad_clean.evt |
| Size (bytes) | 460,025,280 | 98,380,800 |
| Size | 438.7 MB | 93.8 MB |
| Events in quadrant A | 3,170,162 | 634,282 |
| Events in quadrant B | 3,645,982 | 642,594 |
| Events in quadrant C | 3,181,162 | 625,182 |
| Events in quadrant D | 3,463,611 | 594,542 |
| Mode SS | |||
|---|---|---|---|
| Quadrant | BADHDUFLAG | Total packets | Discarded packets |
| A | 0 | 142 | 0 |
| B | 0 | 142 | 0 |
| C | 0 | 142 | 0 |
| D | 0 | 142 | 0 |
| Mode M0 | |||
|---|---|---|---|
| Quadrant | BADHDUFLAG | Total packets | Discarded packets |
| A | 0 | 14171 | 3 |
| B | 0 | 15462 | 2 |
| C | 0 | 14138 | 2 |
| D | 0 | 15149 | 2 |
| Mode M9 | |||
|---|---|---|---|
| Quadrant | BADHDUFLAG | Total packets | Discarded packets |
| A | 0 | 17 | 0 |
| B | 0 | 17 | 0 |
| C | 0 | 17 | 0 |
| D | 0 | 17 | 0 |
| Quadrant | Total seconds | Saturated seconds | Saturation percentage |
|---|---|---|---|
| A | 6932 | 45 | 0.649163% |
| B | 6932 | 88 | 1.269475% |
| C | 6932 | 31 | 0.447201% |
| D | 6932 | 95 | 1.370456% |
Noise dominated data is calculated using 1-second bins in cleaned event files. If a bin has >2000 counts, and if more than 50% of those come from <1% of pixels, then it is considered to be noise-dominated and hence unusable.
| Quadrant | # 1 sec bins | Bins with >0 counts | Bins with >2000 counts | High rate bins dominated by noise | Noise dominated (total time) | Noise dominated (detector-on time) | Marked lightcurve |
|---|---|---|---|---|---|---|---|
| A | 8587 | 6933 | 2 | 2 | 0.02% | 0.03% | 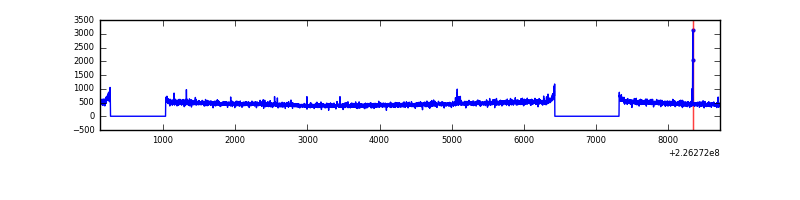 |
| B | 8587 | 6934 | 15 | 15 | 0.17% | 0.22% | 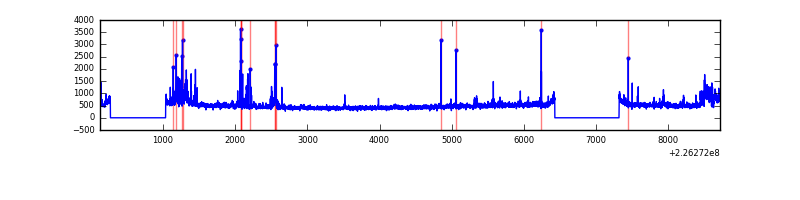 |
| C | 8587 | 6934 | 2 | 2 | 0.02% | 0.03% | 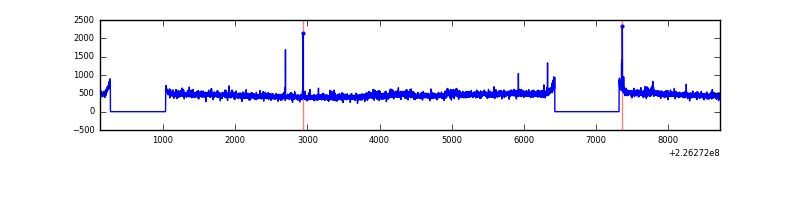 |
| D | 8587 | 6934 | 42 | 42 | 0.49% | 0.61% | 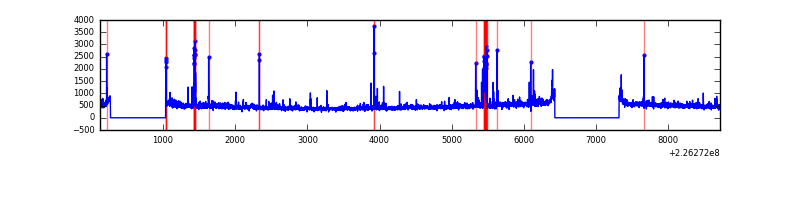 |
Top three noisy pixels from each quadrant. If the there are fewer than three noisy pixels in the level2.evt file, extra rows are filled as -1
| Pixel properties | Quadrant properties | ||||||
|---|---|---|---|---|---|---|---|
| Quadrant | DetID | PixID | Counts | Sigma | Mean | Median | Sigma |
| A | 13 | 170 | 11872 | 66.12 | 814 | 795 | 167.5 |
| A | 15 | 234 | 11222 | 62.24 | 814 | 795 | 167.5 |
| A | 8 | 15 | 8852 | 48.1 | 814 | 795 | 167.5 |
| B | 4 | 173 | 141132 | 886.16 | 824 | 804 | 158.4 |
| B | 0 | 229 | 120157 | 753.71 | 824 | 804 | 158.4 |
| B | 4 | 239 | 45730 | 283.71 | 824 | 804 | 158.4 |
| C | 9 | 68 | 63760 | 339.14 | 793 | 797 | 185.7 |
| C | 12 | 4 | 8708 | 42.61 | 793 | 797 | 185.7 |
| C | 8 | 222 | 7064 | 33.76 | 793 | 797 | 185.7 |
| D | 7 | 203 | 137773 | 707.75 | 786 | 761 | 193.6 |
| D | 12 | 221 | 135120 | 694.05 | 786 | 761 | 193.6 |
| D | 7 | 55 | 44727 | 227.11 | 786 | 761 | 193.6 |
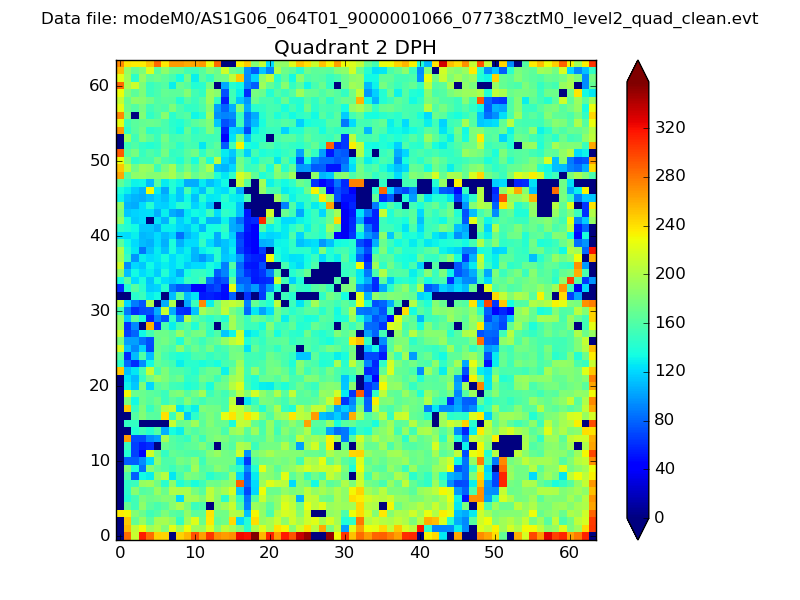
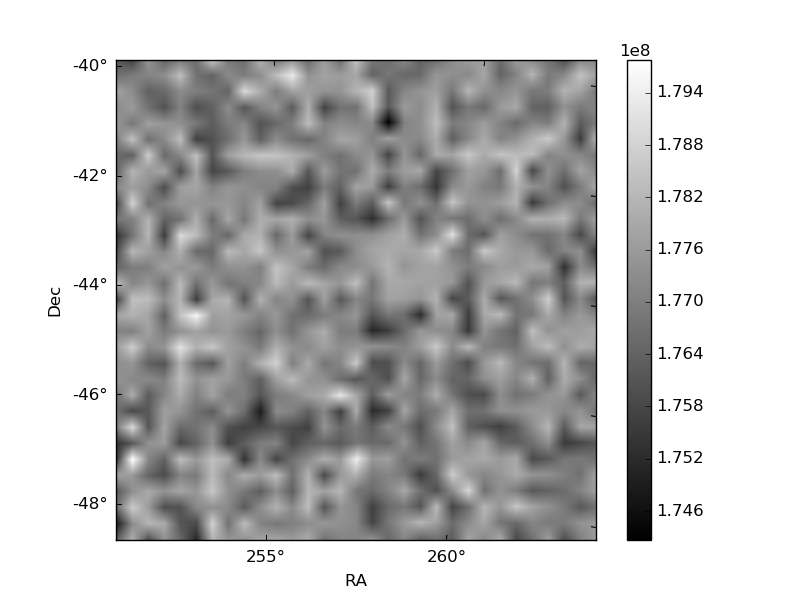
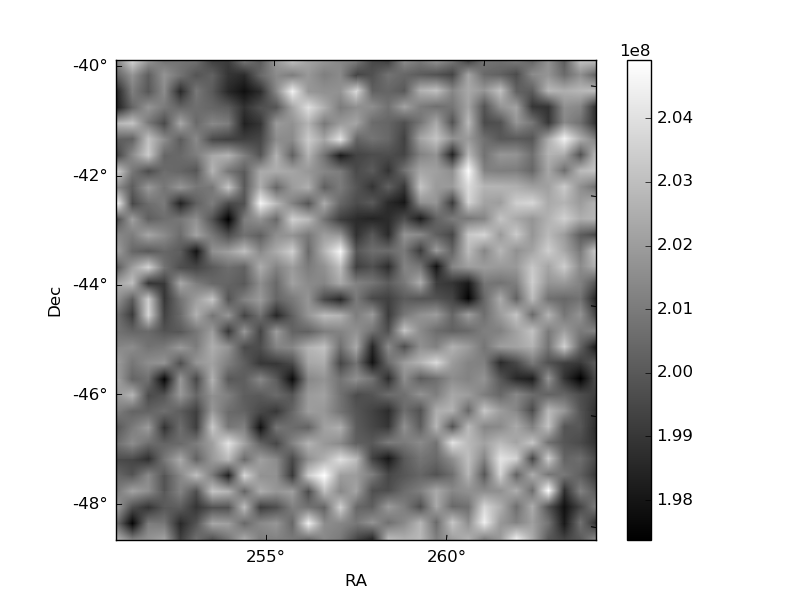
Histogram calculated using DETX and DETY for each event in the final _common_clean file
| Quadrant A | 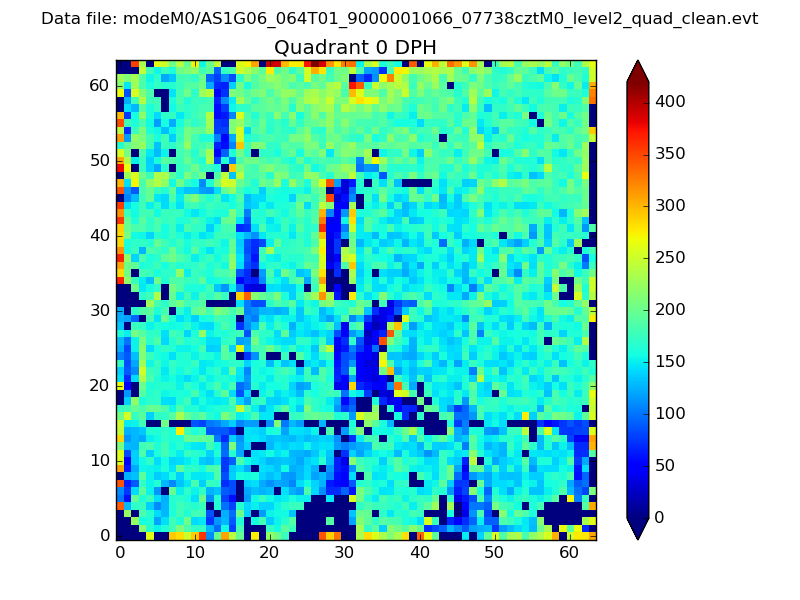 |
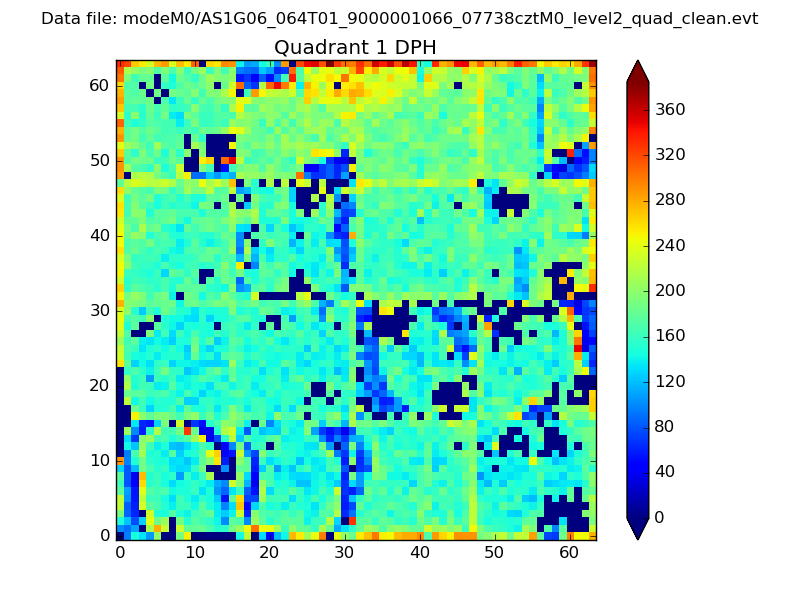 |
Quadrant B |
|---|---|---|---|
| Quadrant D | 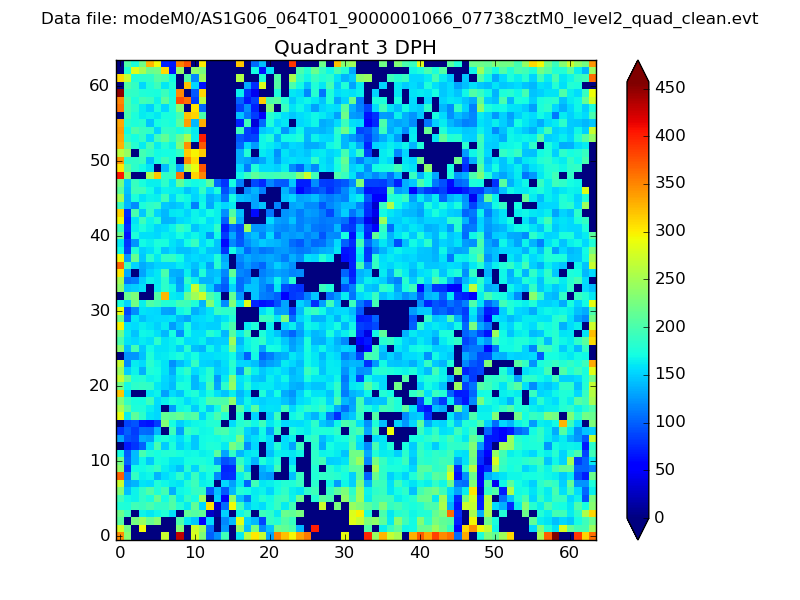 |
 |
Quadrant C |
| Plot type | Count rate plots | Images |
|---|---|---|
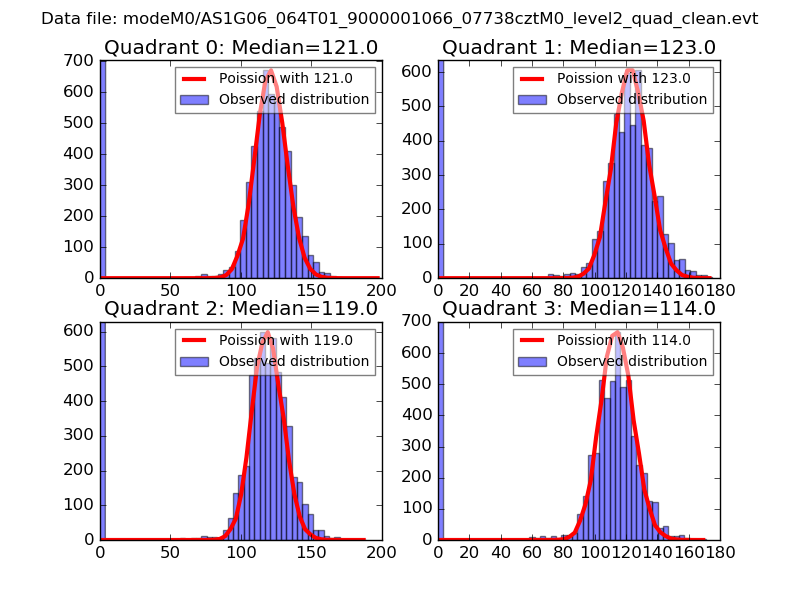
| Comparison with Poisson distribution Blue bars denote a histogram of data divided into 1 sec bins. Red curve is a Poisson curve with rate = median count rate of data. |
 |
 |
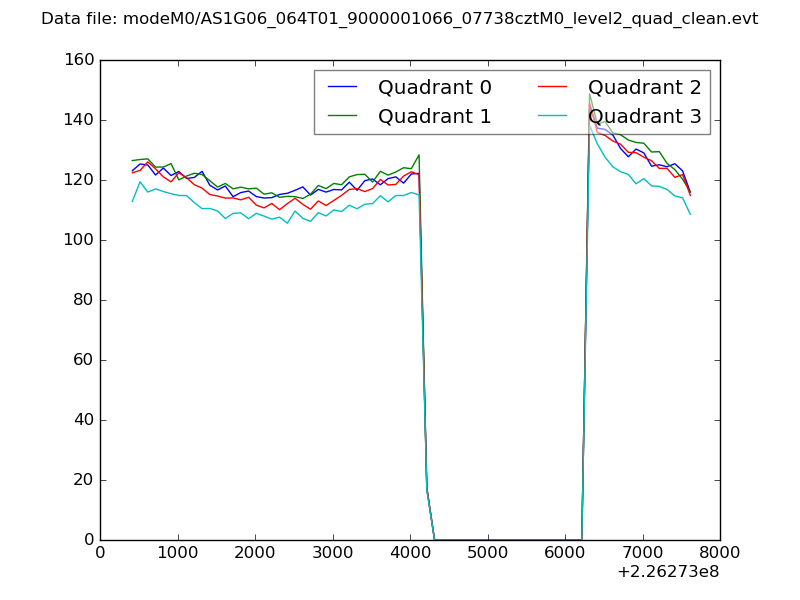
| Quadrant-wise count rates Data is divided into 100 sec bins |
 |
|
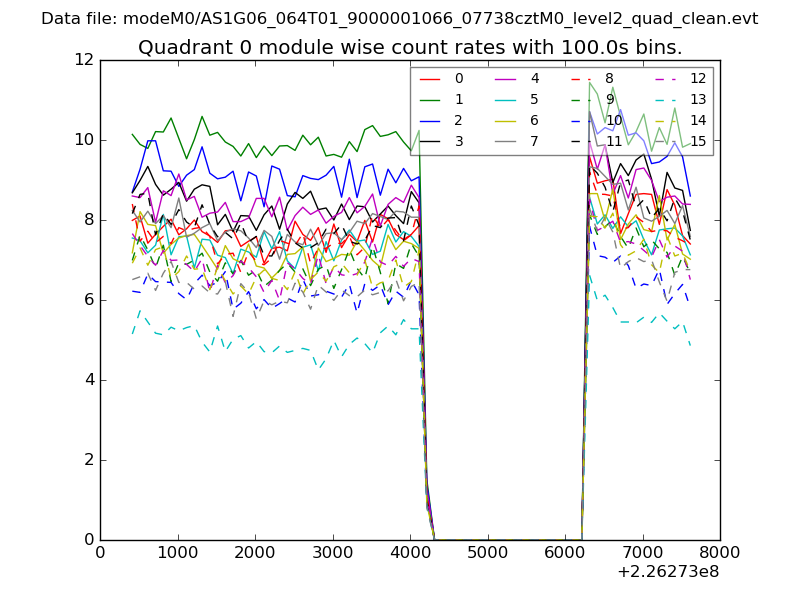
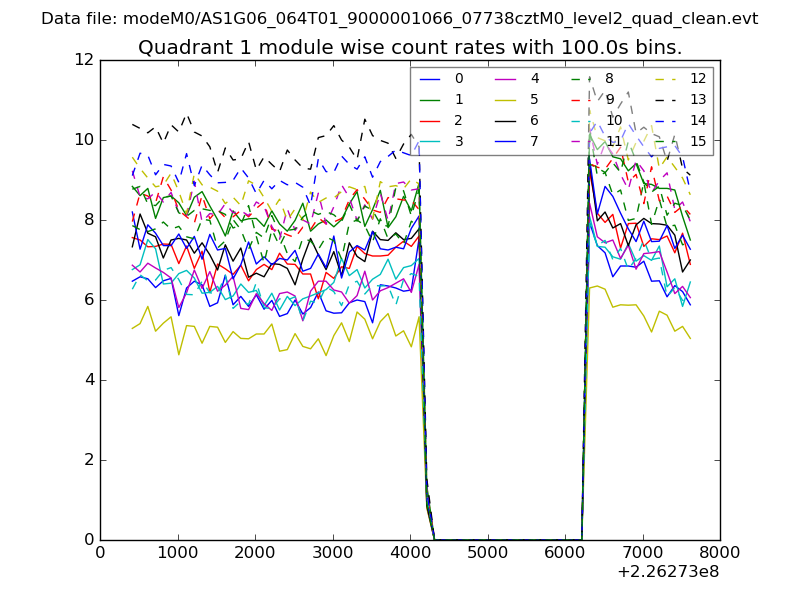
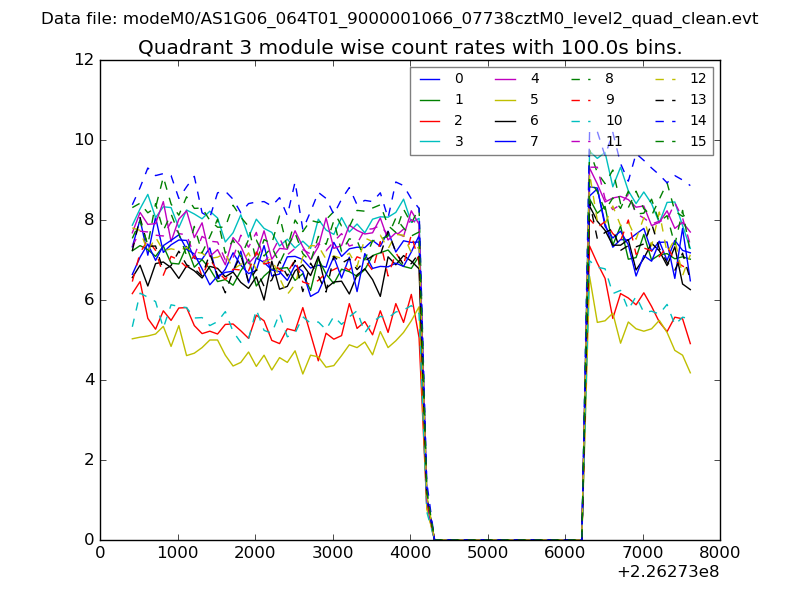
| Module-wise count rates for Quadrant A Data is divided into 100 sec bins |
 |
 |
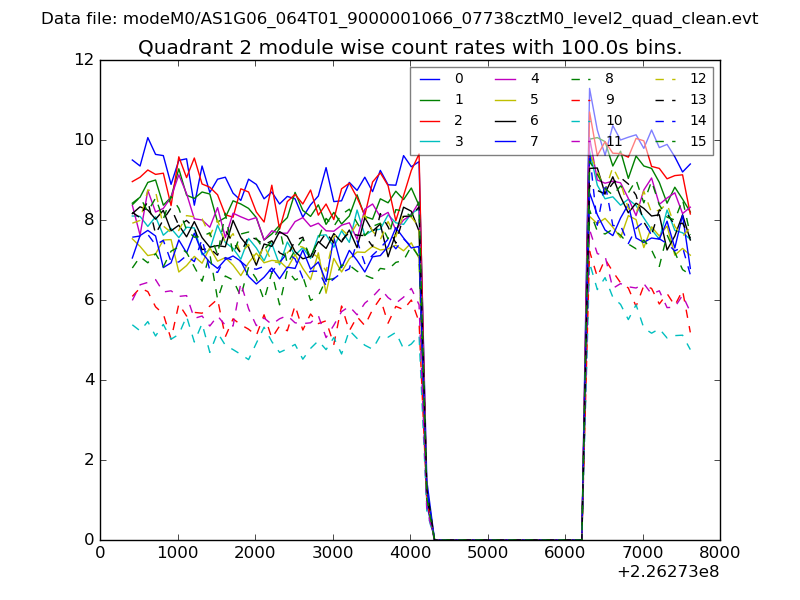
| Module-wise count rates for Quadrant B Data is divided into 100 sec bins |
 |
 |
| Module-wise count rates for Quadrant C Data is divided into 100 sec bins |
 |
 |
| Module-wise count rates for Quadrant D Data is divided into 100 sec bins |
 |
 |
| Parameter | Plot |
|---|---|
| CZT HV Monitor | 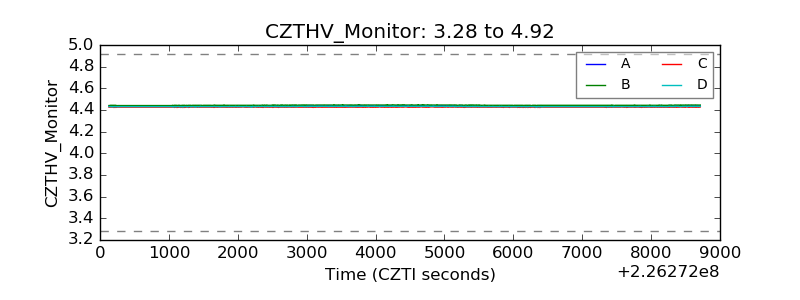 |
| D_VDD | 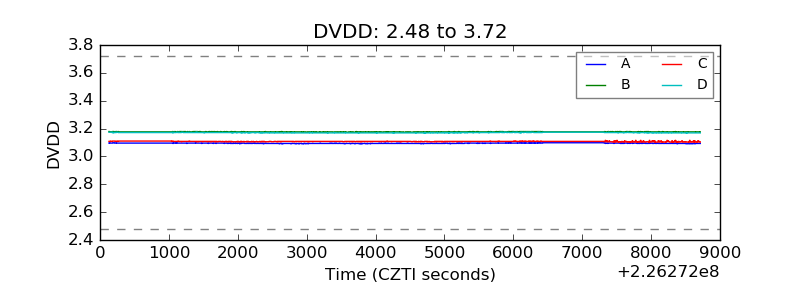 |
| Temperature 1 | 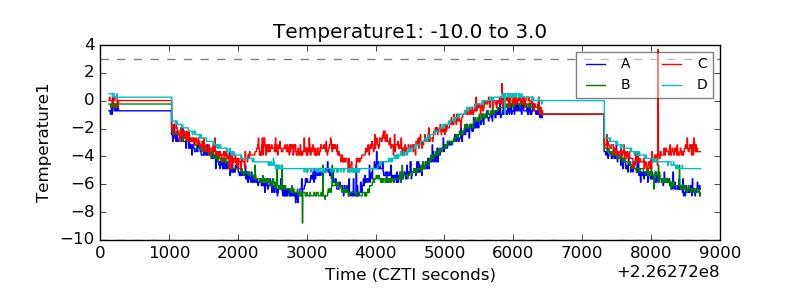 |
| Veto HV Monitor | 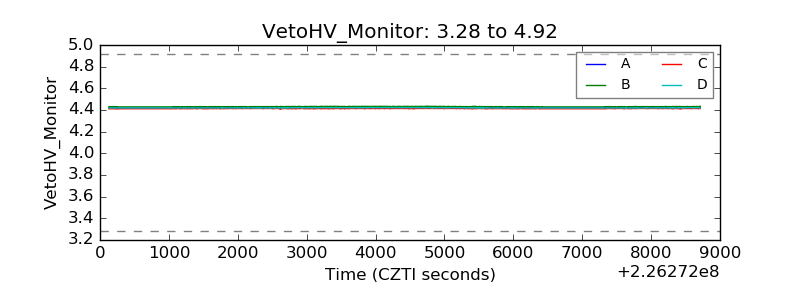 |
| Veto LLD |  |
| Alpha Counter | 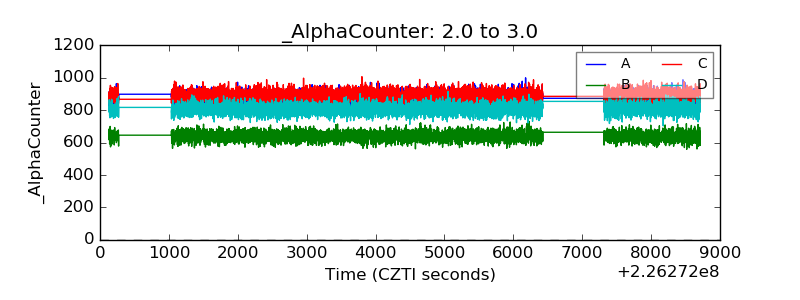 |
| _CPM_Rate | 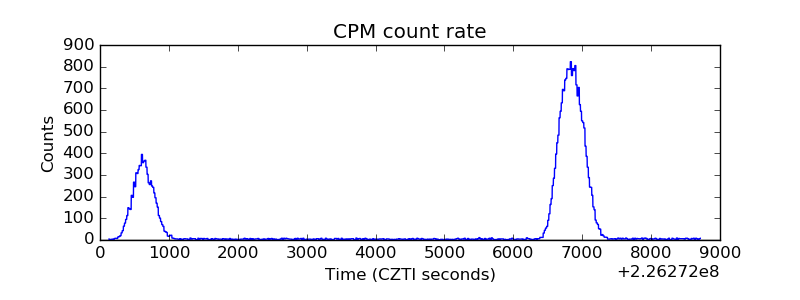 |
| CZT Counter | 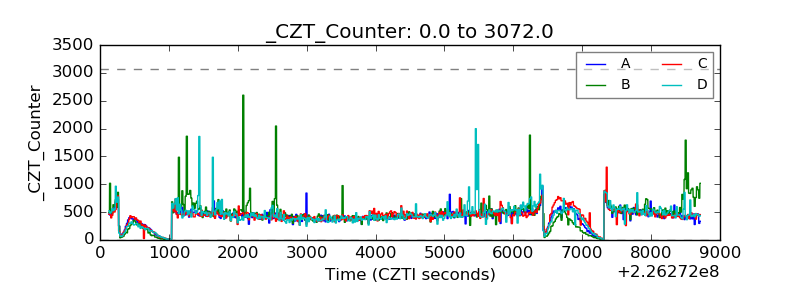 |
| +2.5 Volts monitor |  |
| +5 Volts monitor | 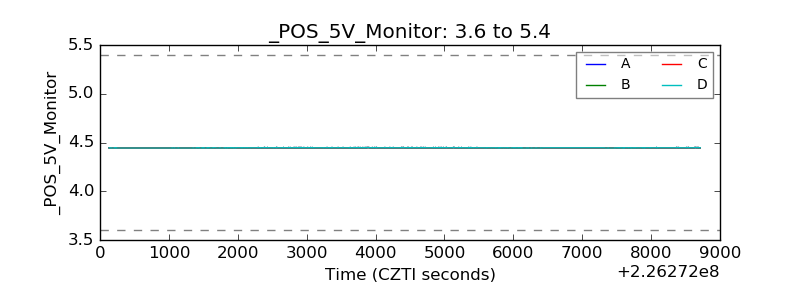 |
| _ROLL_ROT | 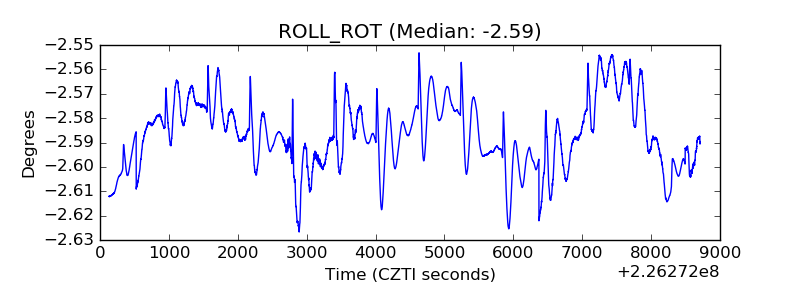 |
| _Roll_DEC | 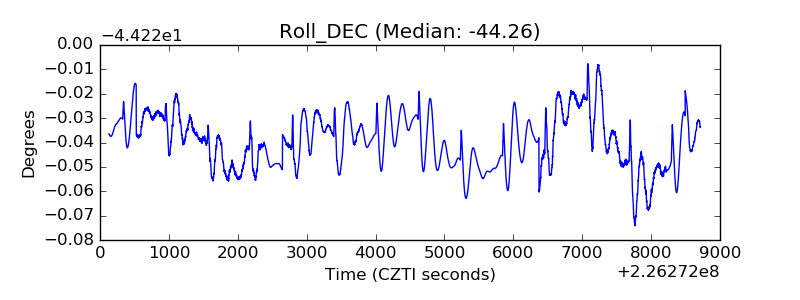 |
| _Roll_RA | 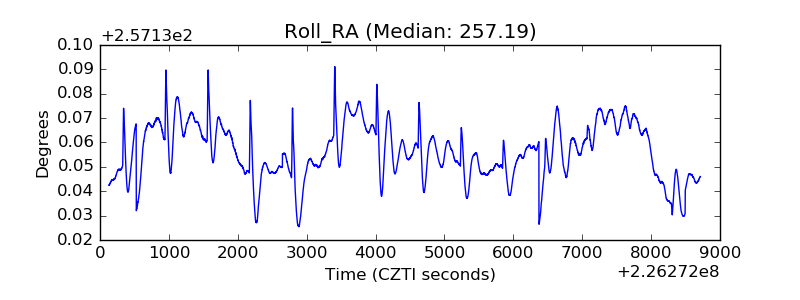 |
| Veto Counter | 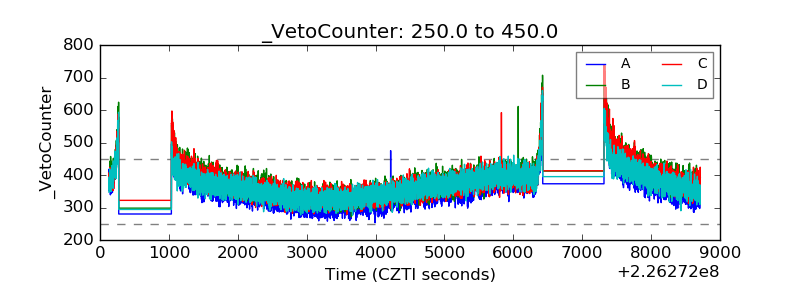 |