| Param | Original file | Final file |
|---|---|---|
| Filename | modeM0/AS1G06_064T01_9000001066_07740cztM0_level2.evt | modeM0/AS1G06_064T01_9000001066_07740cztM0_level2_quad_clean.evt |
| Size (bytes) | 420,704,640 | 97,004,160 |
| Size | 401.2 MB | 92.5 MB |
| Events in quadrant A | 2,944,619 | 627,798 |
| Events in quadrant B | 3,224,345 | 641,253 |
| Events in quadrant C | 2,974,839 | 624,405 |
| Events in quadrant D | 3,155,390 | 591,233 |
| Mode SS | |||
|---|---|---|---|
| Quadrant | BADHDUFLAG | Total packets | Discarded packets |
| A | 0 | 130 | 0 |
| B | 0 | 130 | 0 |
| C | 0 | 130 | 0 |
| D | 0 | 130 | 0 |
| Mode M0 | |||
|---|---|---|---|
| Quadrant | BADHDUFLAG | Total packets | Discarded packets |
| A | 0 | 13210 | 2 |
| B | 0 | 13922 | 1 |
| C | 0 | 13214 | 1 |
| D | 0 | 13609 | 1 |
| Mode M9 | |||
|---|---|---|---|
| Quadrant | BADHDUFLAG | Total packets | Discarded packets |
| A | 0 | 11 | 0 |
| B | 0 | 11 | 0 |
| C | 0 | 11 | 0 |
| D | 0 | 11 | 0 |
| Quadrant | Total seconds | Saturated seconds | Saturation percentage |
|---|---|---|---|
| A | 6502 | 17 | 0.261458% |
| B | 6502 | 27 | 0.415257% |
| C | 6502 | 17 | 0.261458% |
| D | 6502 | 28 | 0.430637% |
Noise dominated data is calculated using 1-second bins in cleaned event files. If a bin has >2000 counts, and if more than 50% of those come from <1% of pixels, then it is considered to be noise-dominated and hence unusable.
| Quadrant | # 1 sec bins | Bins with >0 counts | Bins with >2000 counts | High rate bins dominated by noise | Noise dominated (total time) | Noise dominated (detector-on time) | Marked lightcurve |
|---|---|---|---|---|---|---|---|
| A | 7562 | 6503 | 2 | 2 | 0.03% | 0.03% | 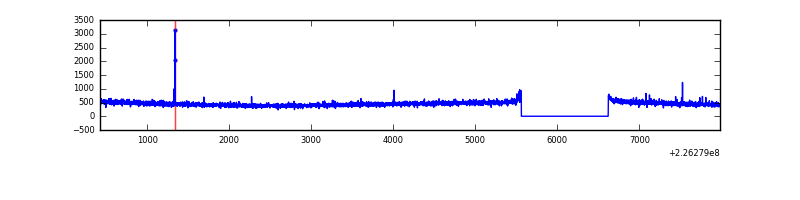 |
| B | 7562 | 6503 | 2 | 2 | 0.03% | 0.03% | 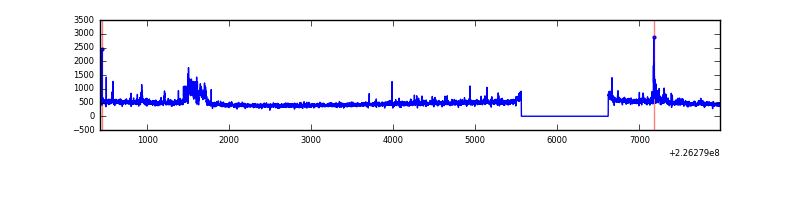 |
| C | 7562 | 6503 | 1 | 1 | 0.01% | 0.02% | 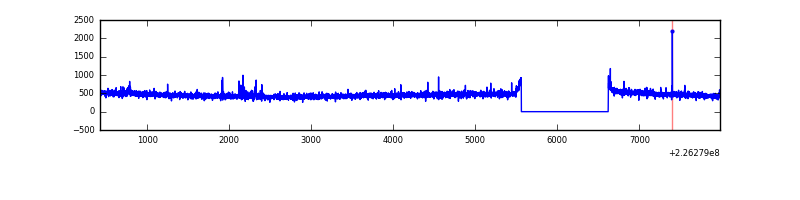 |
| D | 7562 | 6503 | 16 | 16 | 0.21% | 0.25% | 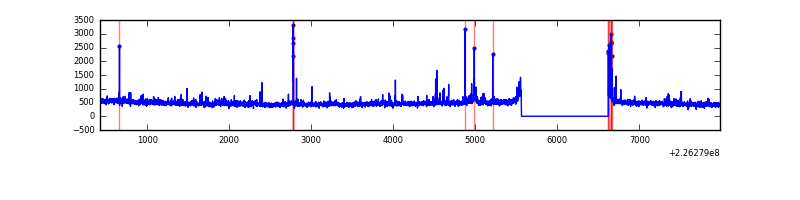 |
Top three noisy pixels from each quadrant. If the there are fewer than three noisy pixels in the level2.evt file, extra rows are filled as -1
| Pixel properties | Quadrant properties | ||||||
|---|---|---|---|---|---|---|---|
| Quadrant | DetID | PixID | Counts | Sigma | Mean | Median | Sigma |
| A | 13 | 170 | 9622 | 56.92 | 760 | 741 | 156.0 |
| A | 0 | 226 | 7096 | 40.73 | 760 | 741 | 156.0 |
| A | 12 | 194 | 6691 | 38.13 | 760 | 741 | 156.0 |
| B | 4 | 173 | 157243 | 1062.99 | 771 | 752 | 147.2 |
| B | 4 | 239 | 33309 | 221.15 | 771 | 752 | 147.2 |
| B | 0 | 214 | 22249 | 146.02 | 771 | 752 | 147.2 |
| C | 9 | 68 | 19982 | 110.09 | 748 | 752 | 174.7 |
| C | 9 | 243 | 12673 | 68.25 | 748 | 752 | 174.7 |
| C | 8 | 128 | 10447 | 55.5 | 748 | 752 | 174.7 |
| D | 7 | 203 | 153817 | 836.92 | 740 | 715 | 182.9 |
| D | 2 | 136 | 40963 | 220.01 | 740 | 715 | 182.9 |
| D | 2 | 152 | 40219 | 215.95 | 740 | 715 | 182.9 |
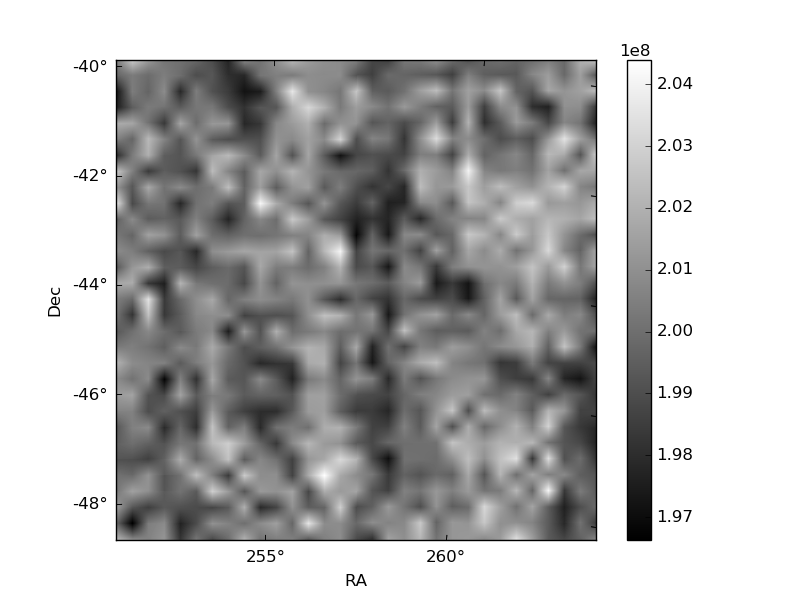
Histogram calculated using DETX and DETY for each event in the final _common_clean file
| Quadrant A |  |
 |
Quadrant B |
|---|---|---|---|
| Quadrant D |  |
 |
Quadrant C |
| Plot type | Count rate plots | Images |
|---|---|---|
| Comparison with Poisson distribution Blue bars denote a histogram of data divided into 1 sec bins. Red curve is a Poisson curve with rate = median count rate of data. |
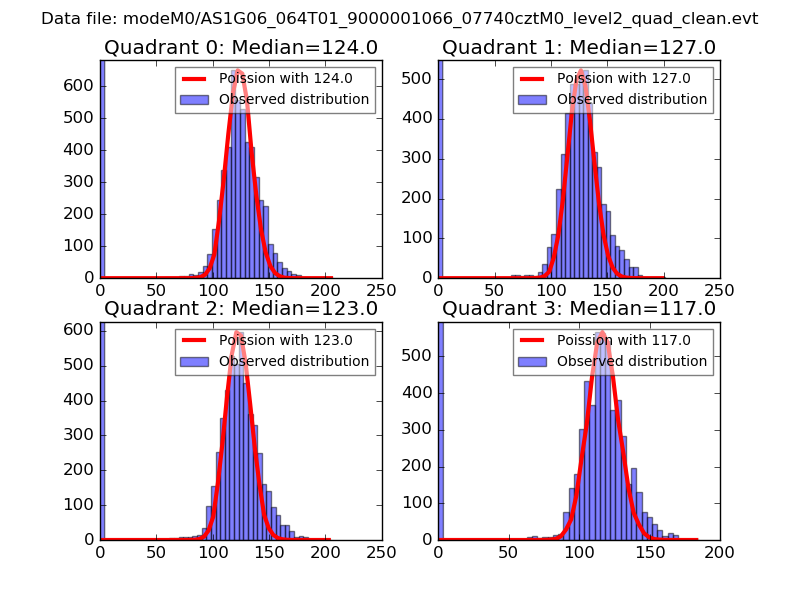 |
 |
| Quadrant-wise count rates Data is divided into 100 sec bins |
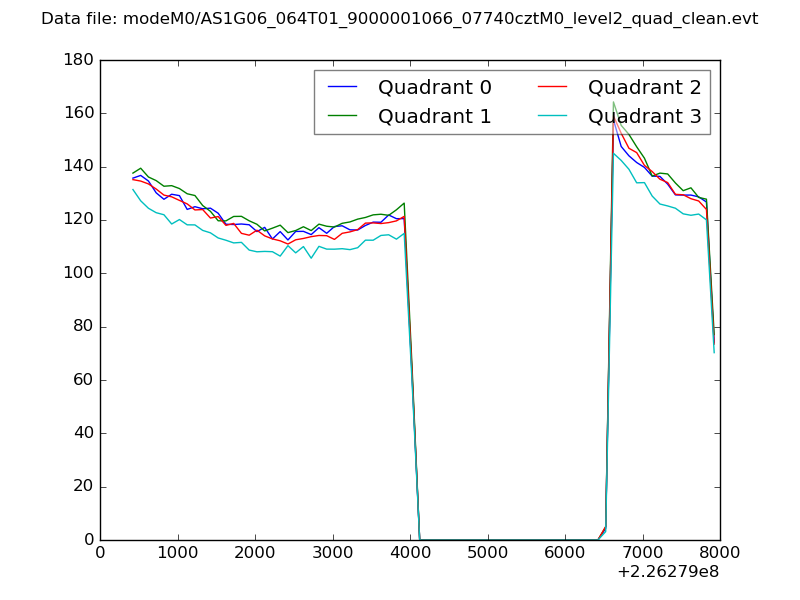 |
|
| Module-wise count rates for Quadrant A Data is divided into 100 sec bins |
 |
 |
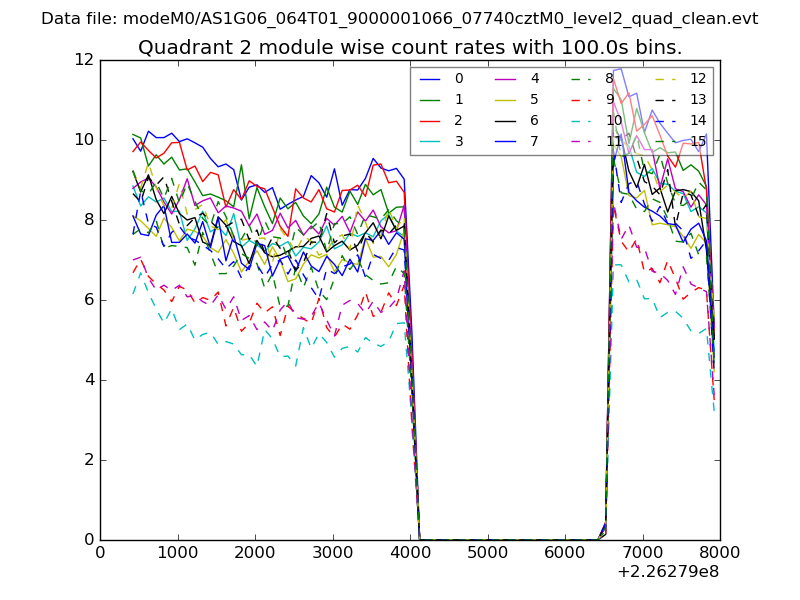
| Module-wise count rates for Quadrant B Data is divided into 100 sec bins |
 |
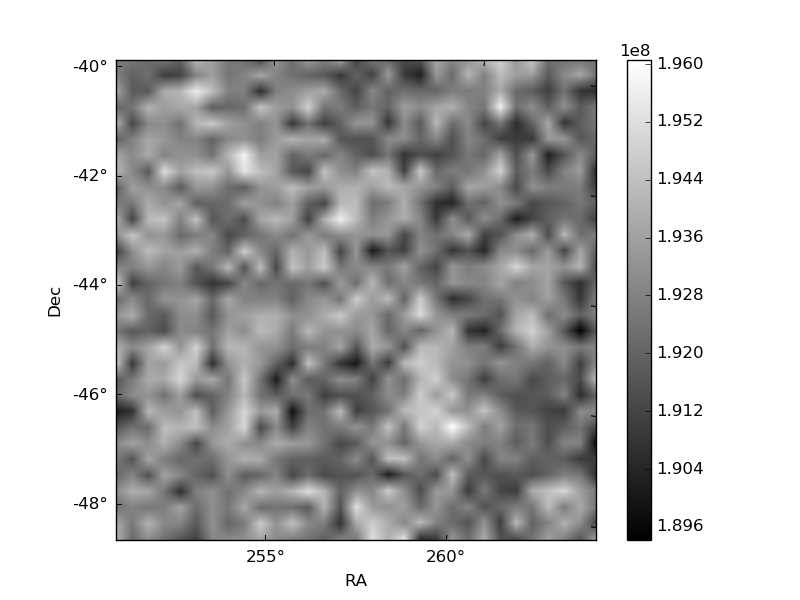 |
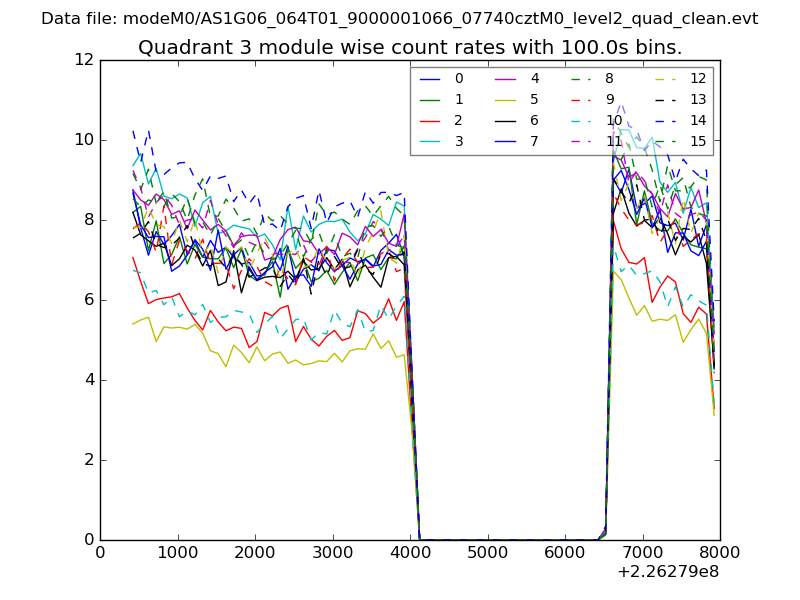
| Module-wise count rates for Quadrant C Data is divided into 100 sec bins |
 |
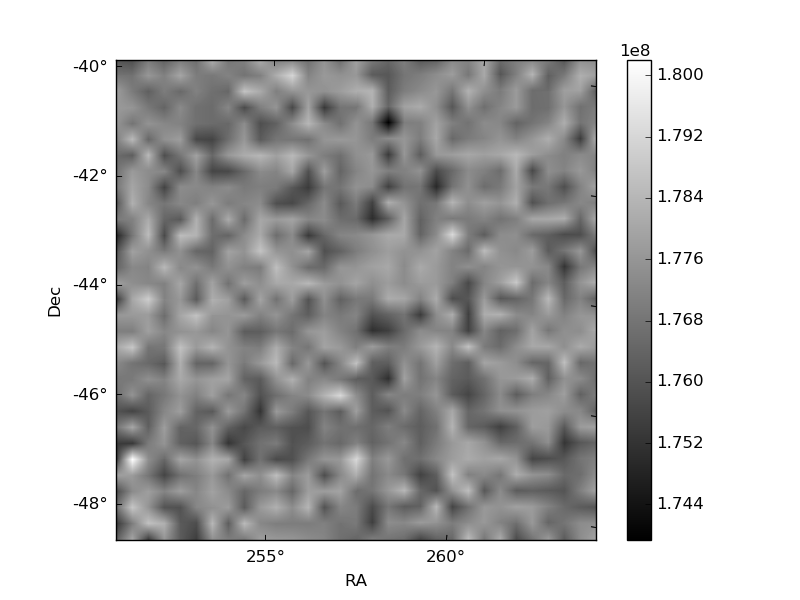 |
| Module-wise count rates for Quadrant D Data is divided into 100 sec bins |
 |
 |
| Parameter | Plot |
|---|---|
| CZT HV Monitor | 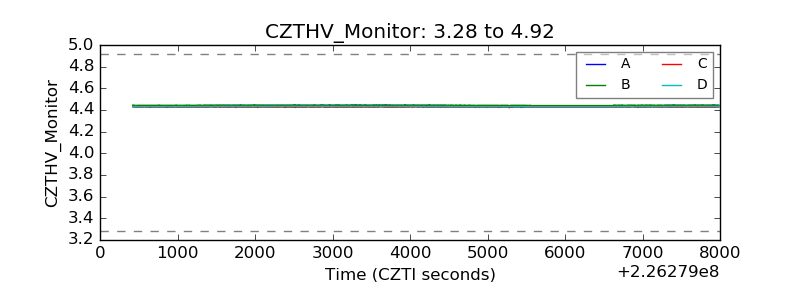 |
| D_VDD | 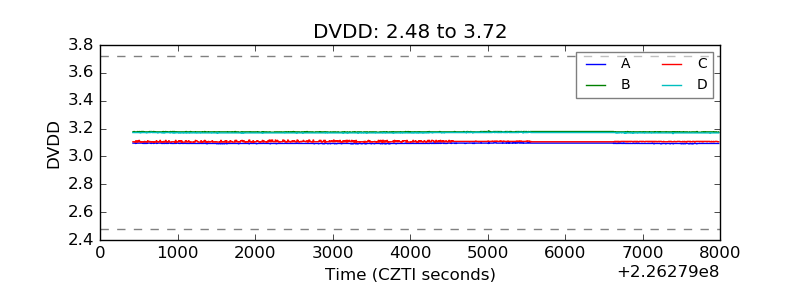 |
| Temperature 1 | 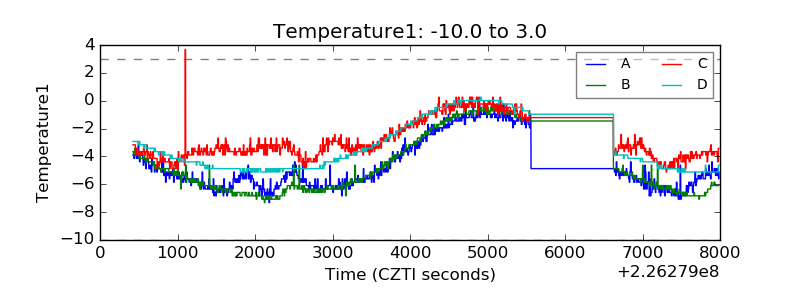 |
| Veto HV Monitor | 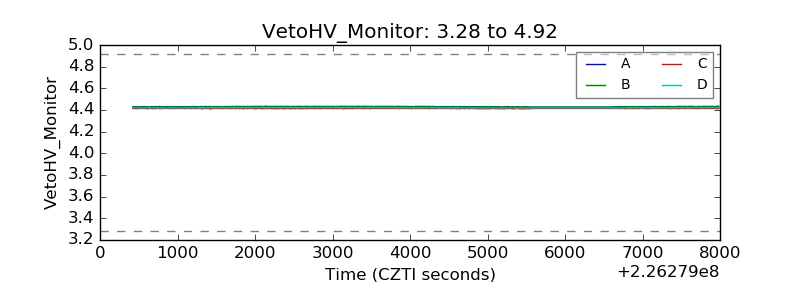 |
| Veto LLD | 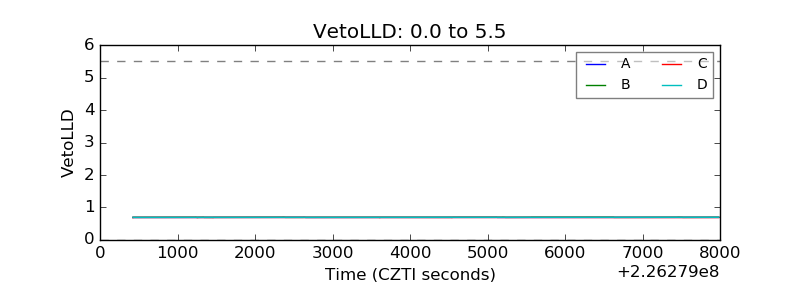 |
| Alpha Counter | 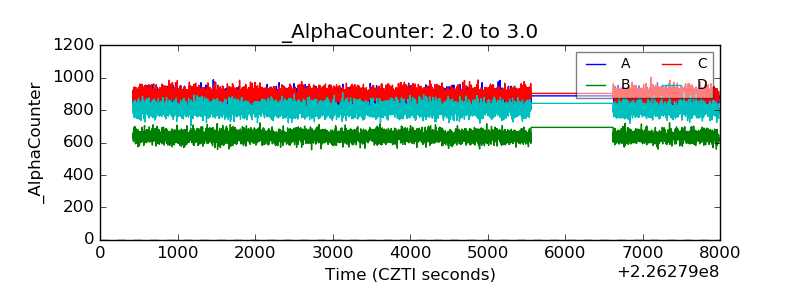 |
| _CPM_Rate | 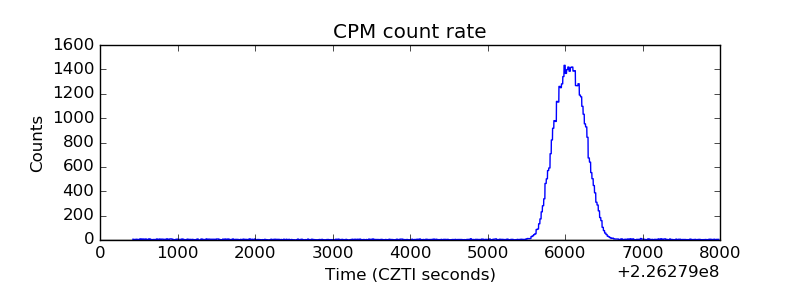 |
| CZT Counter | 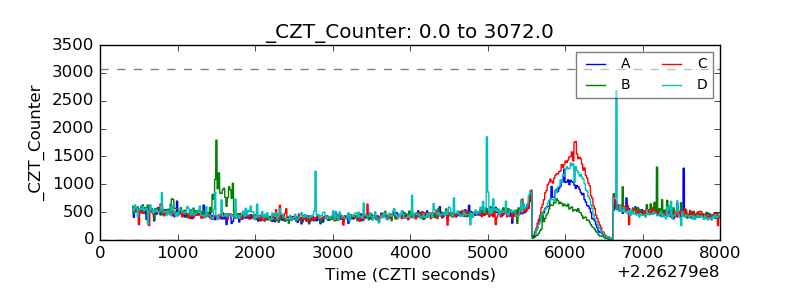 |
| +2.5 Volts monitor |  |
| +5 Volts monitor |  |
| _ROLL_ROT | 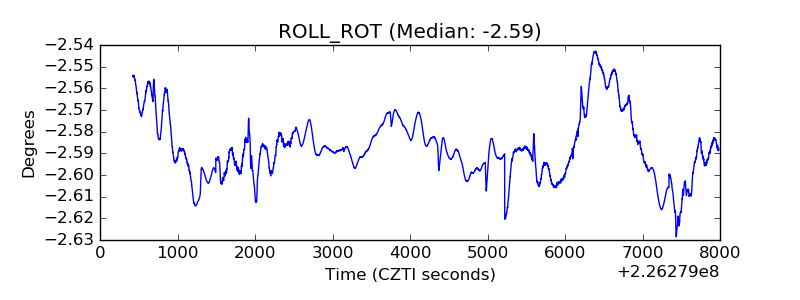 |
| _Roll_DEC | 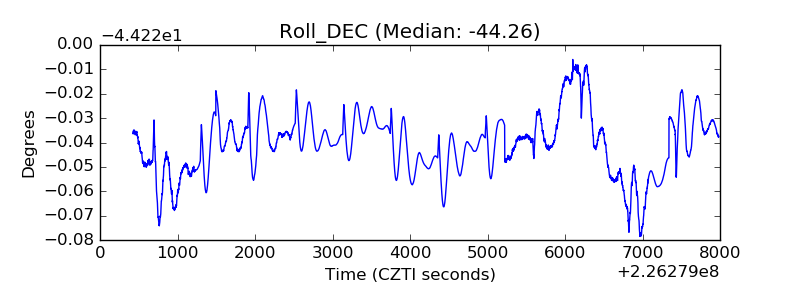 |
| _Roll_RA | 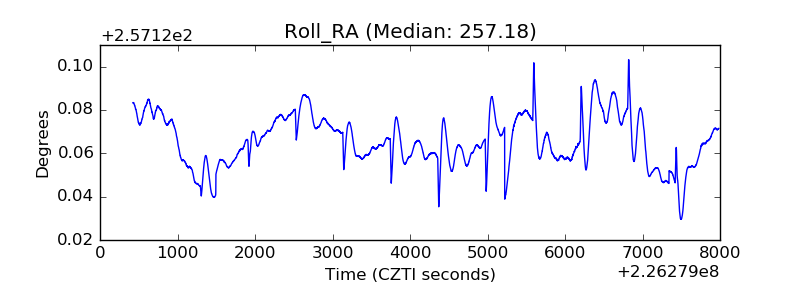 |
| Veto Counter | 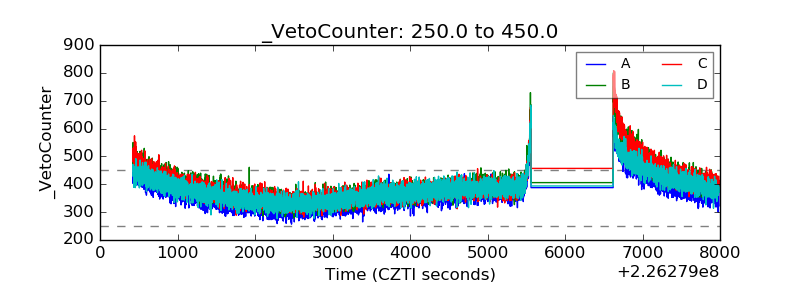 |