| Param | Original file | Final file |
|---|---|---|
| Filename | modeM0/AS1G06_064T01_9000001066_07742cztM0_level2.evt | modeM0/AS1G06_064T01_9000001066_07742cztM0_level2_quad_clean.evt |
| Size (bytes) | 351,725,760 | 73,206,720 |
| Size | 335.4 MB | 69.8 MB |
| Events in quadrant A | 2,529,241 | 460,180 |
| Events in quadrant B | 2,649,950 | 473,384 |
| Events in quadrant C | 2,589,837 | 464,736 |
| Events in quadrant D | 2,515,308 | 440,661 |
| Mode SS | |||
|---|---|---|---|
| Quadrant | BADHDUFLAG | Total packets | Discarded packets |
| A | 0 | 110 | 0 |
| B | 0 | 110 | 0 |
| C | 0 | 110 | 0 |
| D | 0 | 110 | 0 |
| Mode M0 | |||
|---|---|---|---|
| Quadrant | BADHDUFLAG | Total packets | Discarded packets |
| A | 0 | 11058 | 2 |
| B | 0 | 11327 | 1 |
| C | 0 | 11135 | 1 |
| D | 0 | 11189 | 1 |
| Mode M9 | |||
|---|---|---|---|
| Quadrant | BADHDUFLAG | Total packets | Discarded packets |
| A | 0 | 13 | 0 |
| B | 0 | 13 | 0 |
| C | 0 | 13 | 0 |
| D | 0 | 13 | 0 |
| Quadrant | Total seconds | Saturated seconds | Saturation percentage |
|---|---|---|---|
| A | 5395 | 14 | 0.259500% |
| B | 5395 | 29 | 0.537535% |
| C | 5395 | 4 | 0.074143% |
| D | 5395 | 7 | 0.129750% |
Noise dominated data is calculated using 1-second bins in cleaned event files. If a bin has >2000 counts, and if more than 50% of those come from <1% of pixels, then it is considered to be noise-dominated and hence unusable.
| Quadrant | # 1 sec bins | Bins with >0 counts | Bins with >2000 counts | High rate bins dominated by noise | Noise dominated (total time) | Noise dominated (detector-on time) | Marked lightcurve |
|---|---|---|---|---|---|---|---|
| A | 6665 | 5396 | 2 | 2 | 0.03% | 0.04% | 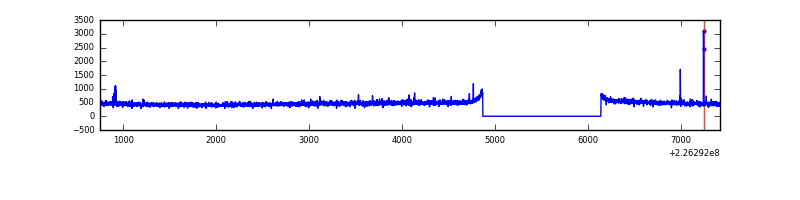 |
| B | 6665 | 5396 | 9 | 9 | 0.14% | 0.17% | 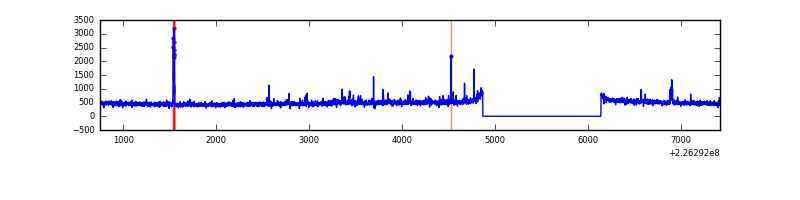 |
| C | 6665 | 5396 | 0 | 0 | 0.00% | 0.00% | 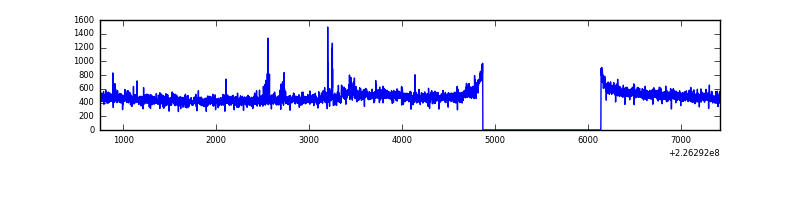 |
| D | 6665 | 5396 | 6 | 6 | 0.09% | 0.11% | 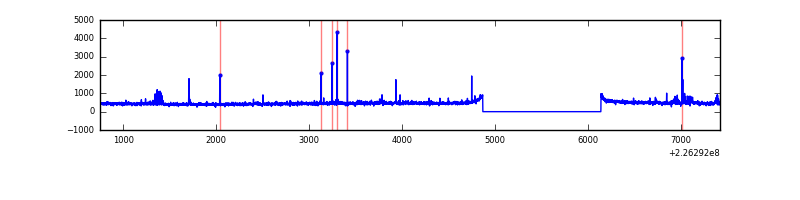 |
Top three noisy pixels from each quadrant. If the there are fewer than three noisy pixels in the level2.evt file, extra rows are filled as -1
| Pixel properties | Quadrant properties | ||||||
|---|---|---|---|---|---|---|---|
| Quadrant | DetID | PixID | Counts | Sigma | Mean | Median | Sigma |
| A | 15 | 234 | 10233 | 72.52 | 651 | 637 | 132.3 |
| A | 0 | 52 | 6825 | 46.76 | 651 | 637 | 132.3 |
| A | 0 | 226 | 6636 | 45.33 | 651 | 637 | 132.3 |
| B | 4 | 81 | 46848 | 372.42 | 656 | 641 | 124.1 |
| B | 15 | 204 | 26416 | 207.74 | 656 | 641 | 124.1 |
| B | 4 | 239 | 17080 | 132.5 | 656 | 641 | 124.1 |
| C | 9 | 68 | 41323 | 273.08 | 646 | 651 | 148.9 |
| C | 9 | 243 | 22908 | 149.44 | 646 | 651 | 148.9 |
| C | 13 | 61 | 4983 | 29.09 | 646 | 651 | 148.9 |
| D | 13 | 104 | 42940 | 269.76 | 642 | 623 | 156.9 |
| D | 2 | 152 | 24415 | 151.67 | 642 | 623 | 156.9 |
| D | 2 | 14 | 17952 | 110.47 | 642 | 623 | 156.9 |
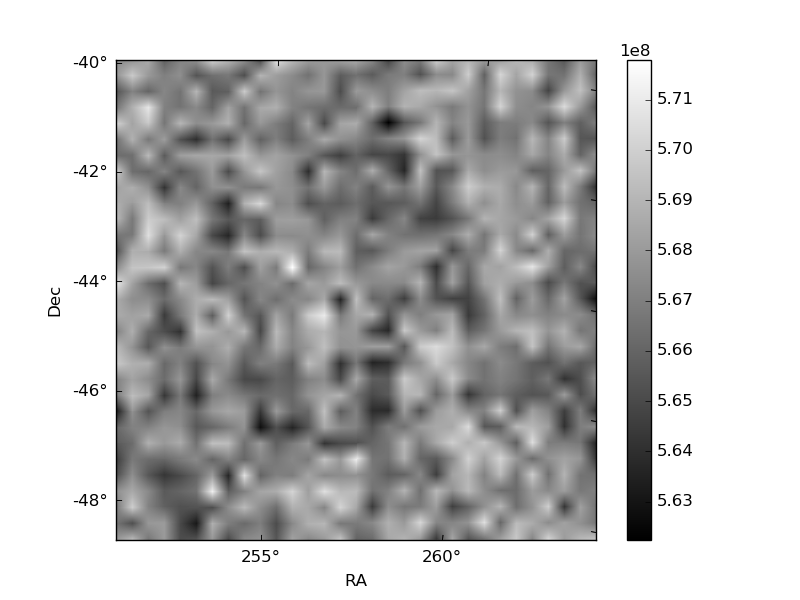
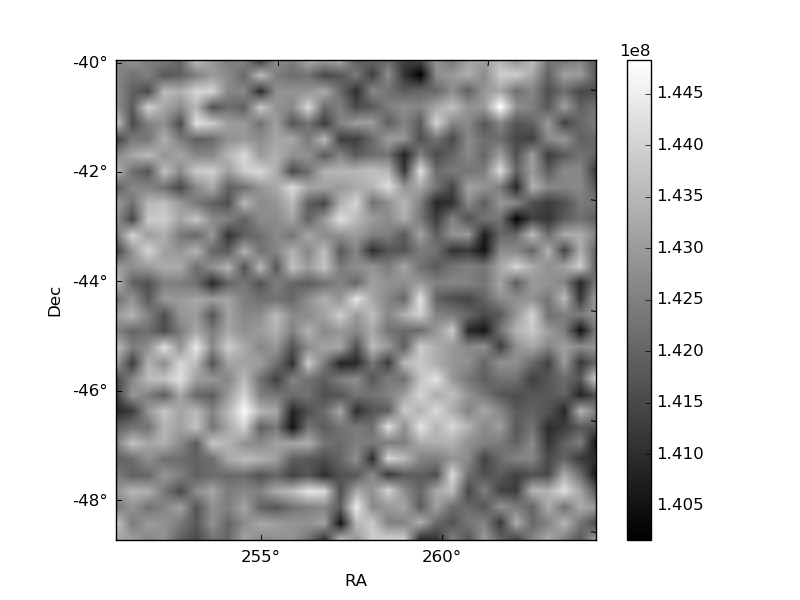
Histogram calculated using DETX and DETY for each event in the final _common_clean file
| Quadrant A | 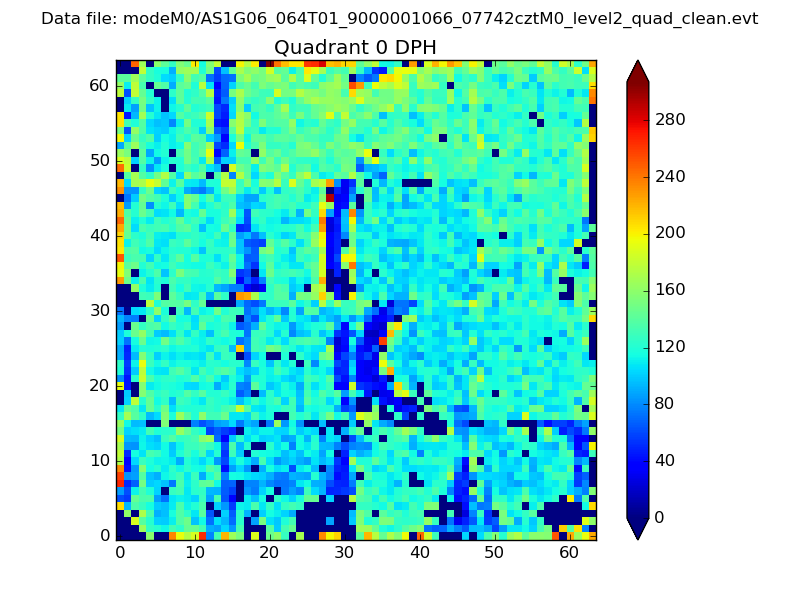 |
 |
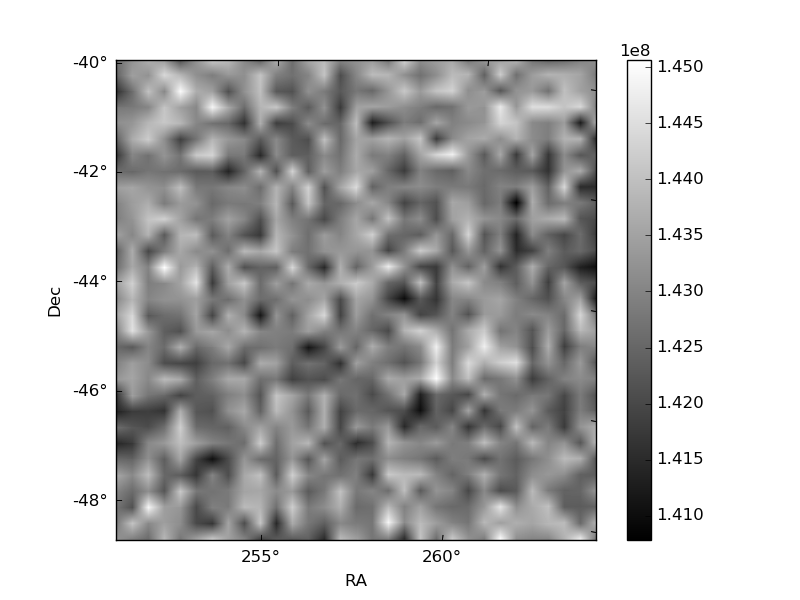
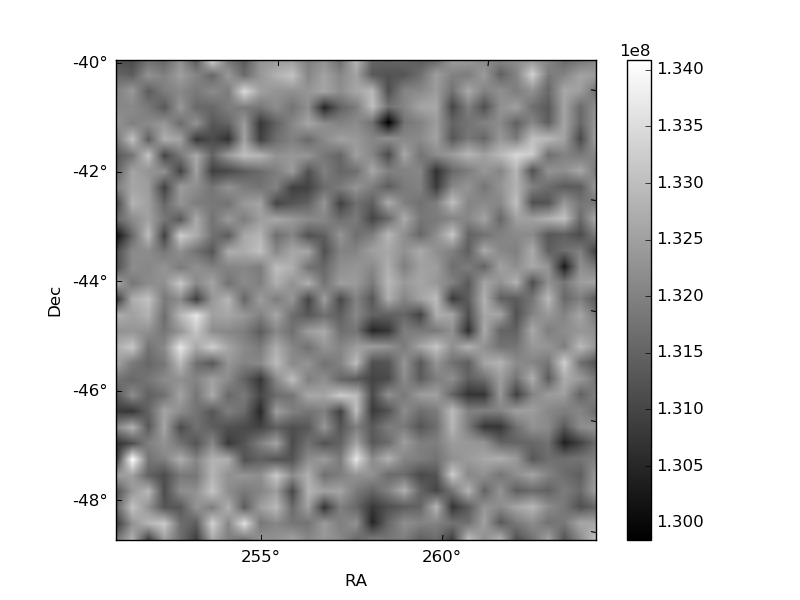
Quadrant B |
|---|---|---|---|
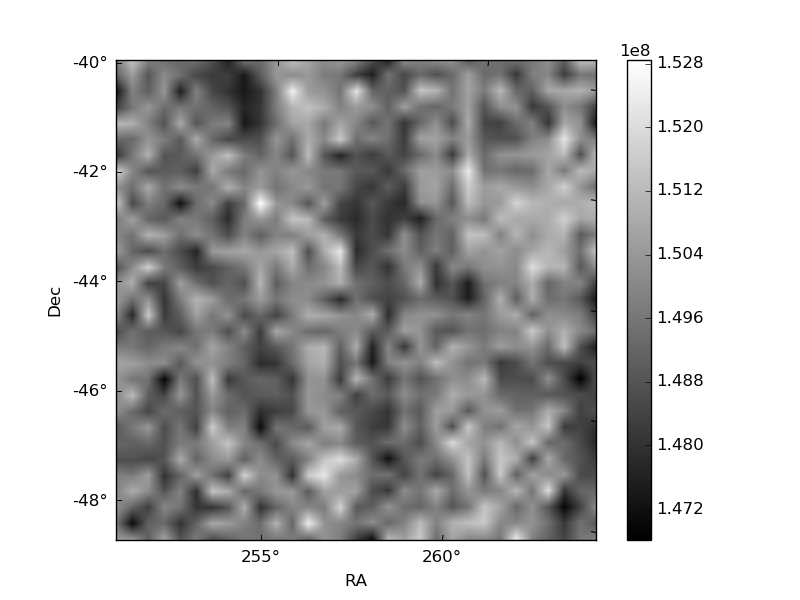
| Quadrant D | 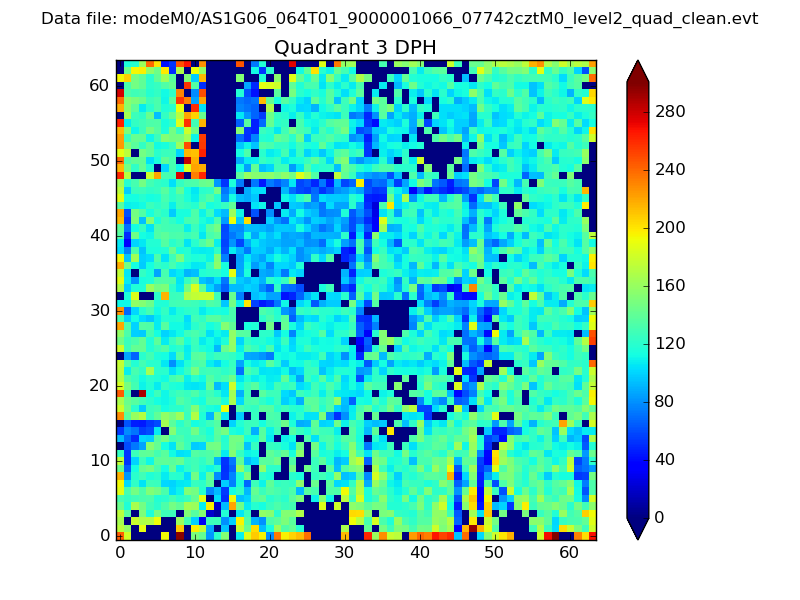 |
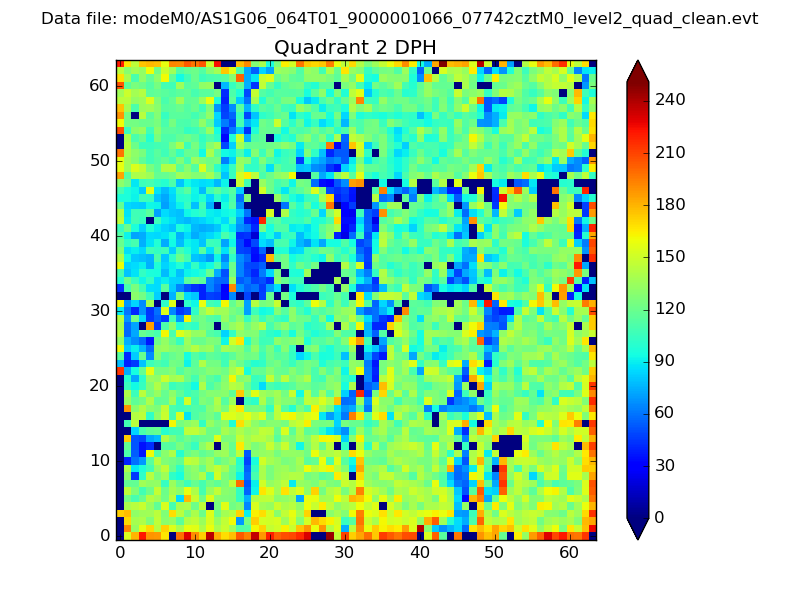 |
Quadrant C |
| Plot type | Count rate plots | Images |
|---|---|---|
| Comparison with Poisson distribution Blue bars denote a histogram of data divided into 1 sec bins. Red curve is a Poisson curve with rate = median count rate of data. |
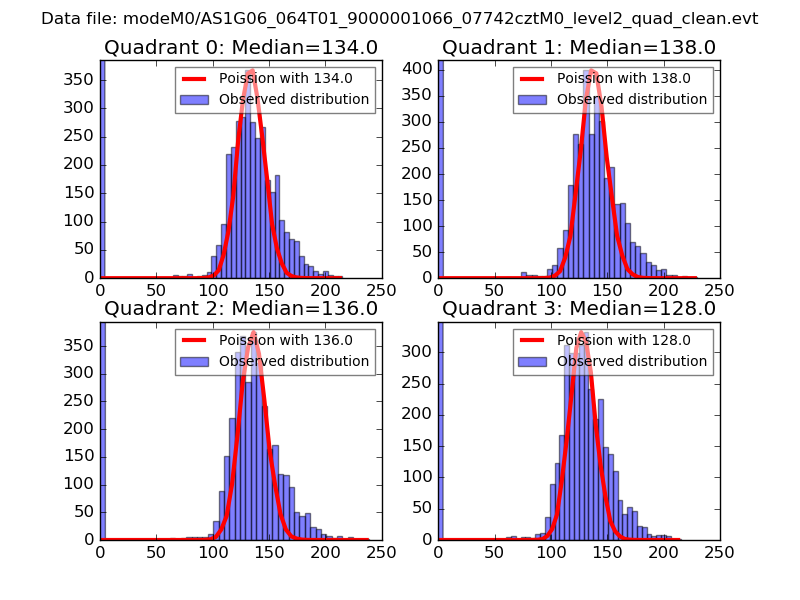 |
 |
| Quadrant-wise count rates Data is divided into 100 sec bins |
 |
|
| Module-wise count rates for Quadrant A Data is divided into 100 sec bins |
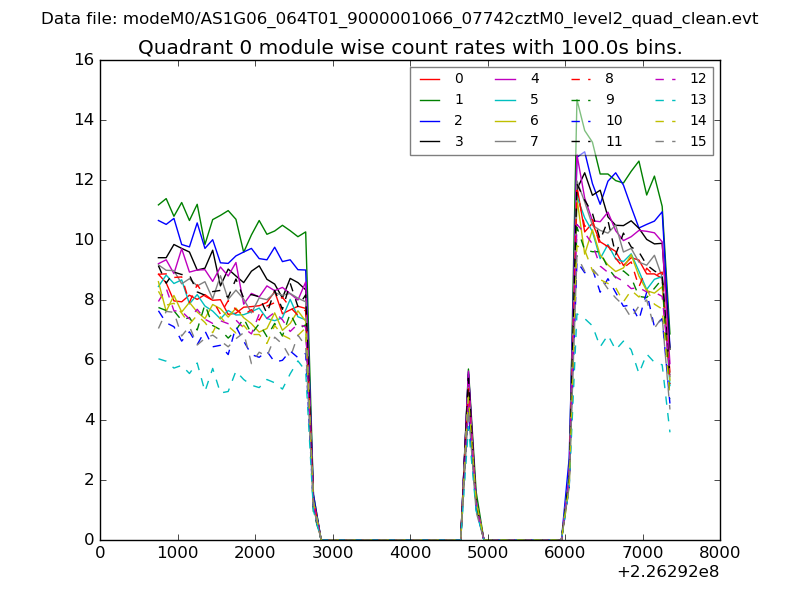 |
 |
| Module-wise count rates for Quadrant B Data is divided into 100 sec bins |
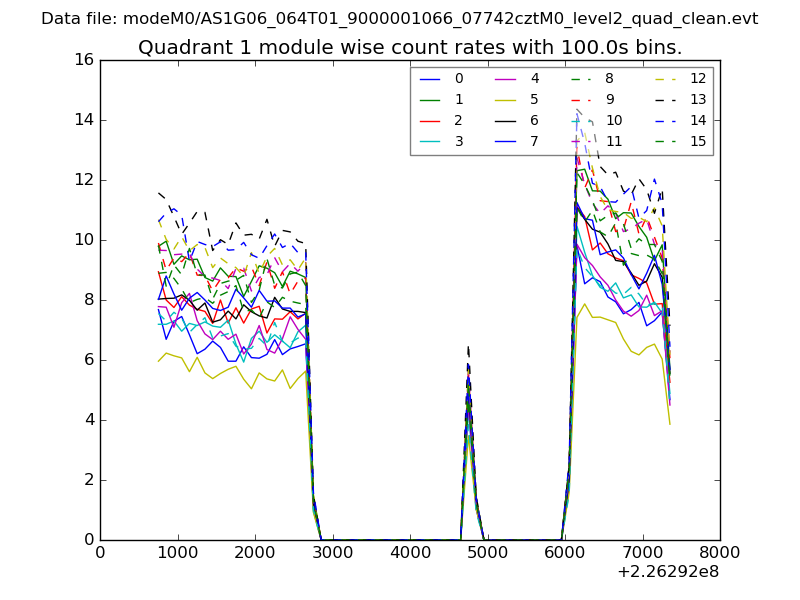 |
 |
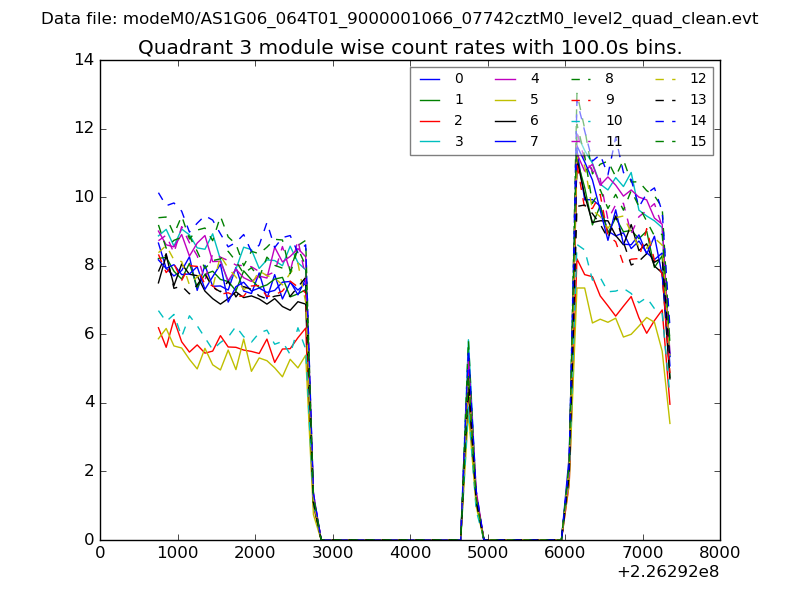
| Module-wise count rates for Quadrant C Data is divided into 100 sec bins |
 |
 |
| Module-wise count rates for Quadrant D Data is divided into 100 sec bins |
 |
 |
| Parameter | Plot |
|---|---|
| CZT HV Monitor | 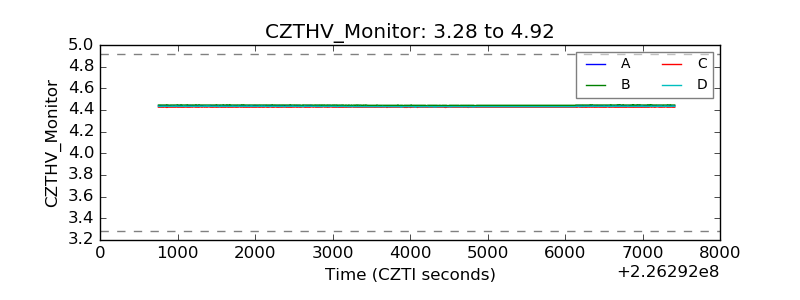 |
| D_VDD | 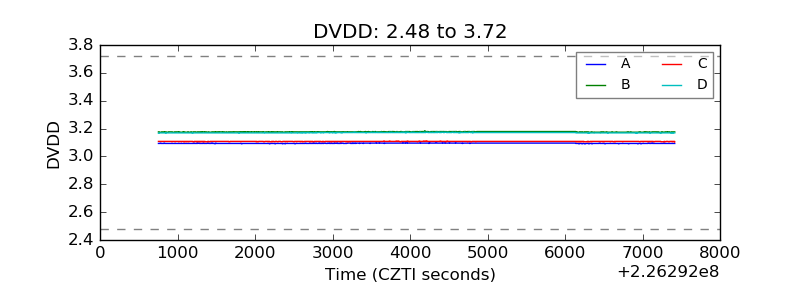 |
| Temperature 1 | 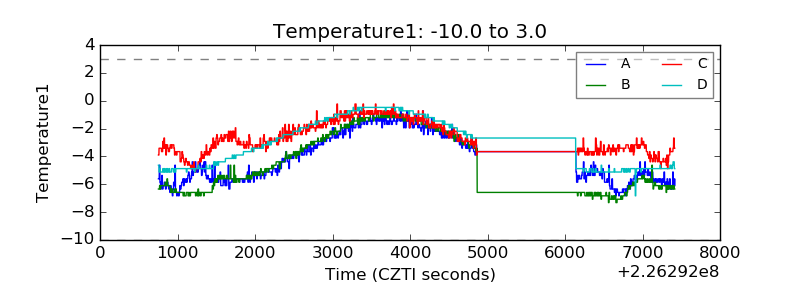 |
| Veto HV Monitor | 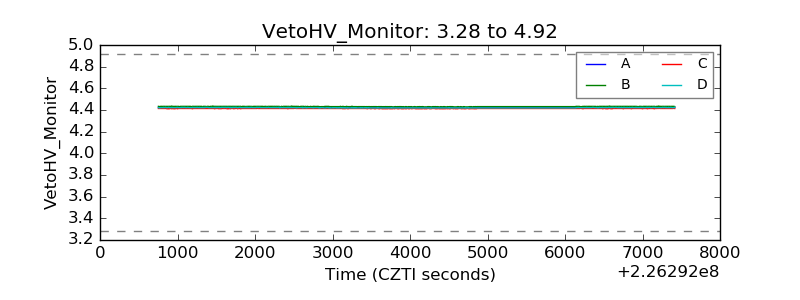 |
| Veto LLD | 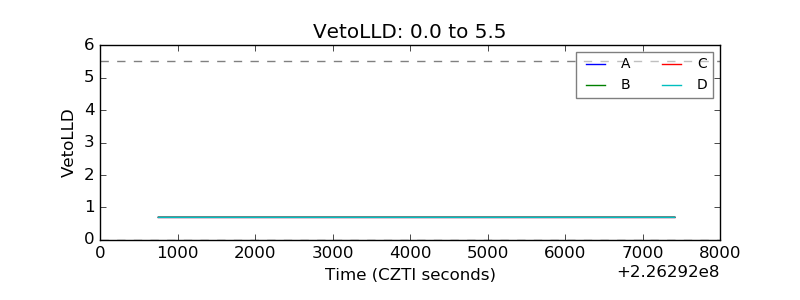 |
| Alpha Counter | 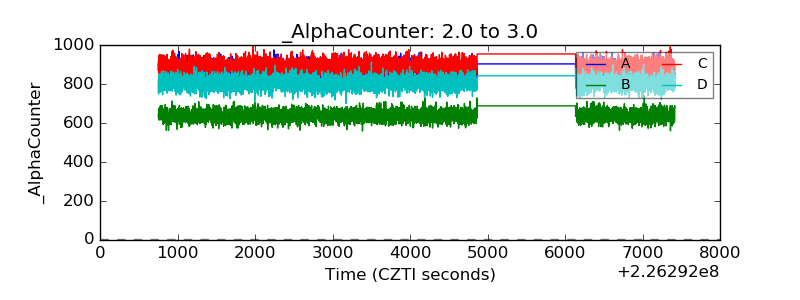 |
| _CPM_Rate | 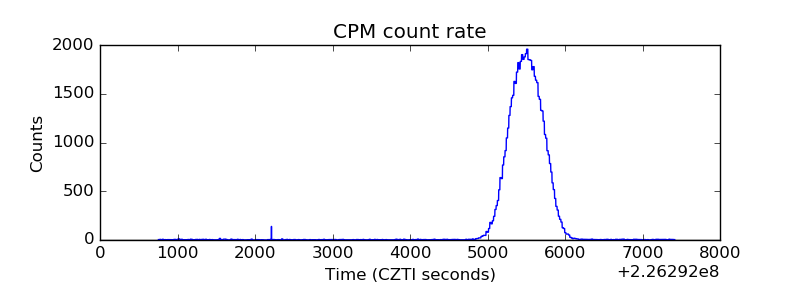 |
| CZT Counter | 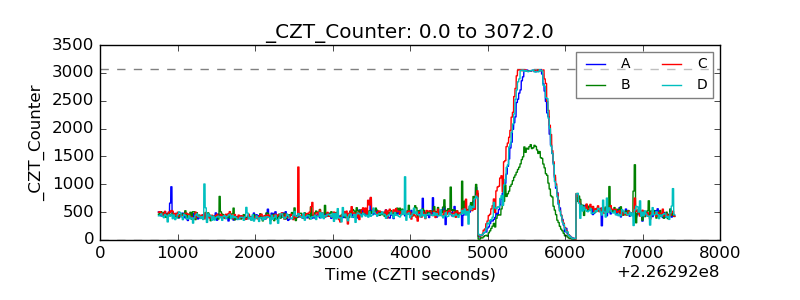 |
| +2.5 Volts monitor |  |
| +5 Volts monitor |  |
| _ROLL_ROT | 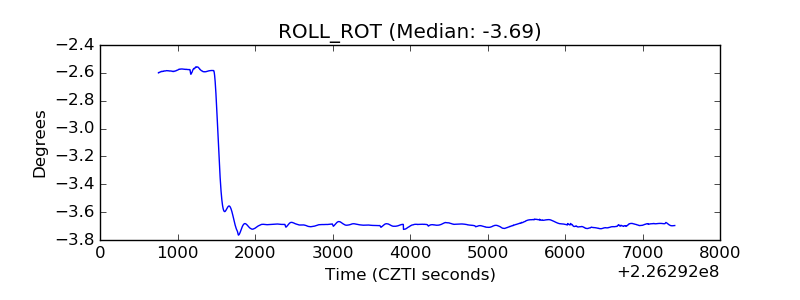 |
| _Roll_DEC | 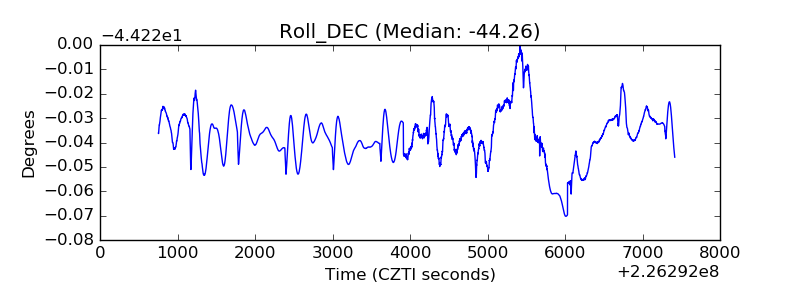 |
| _Roll_RA | 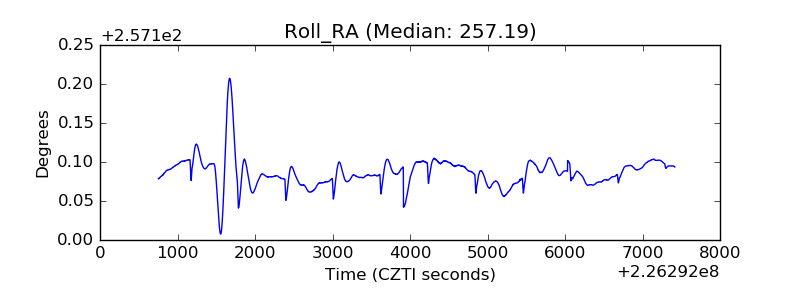 |
| Veto Counter |  |