| Param | Original file | Final file |
|---|---|---|
| Filename | modeM0/AS1G06_064T01_9000001066_07743cztM0_level2.evt | modeM0/AS1G06_064T01_9000001066_07743cztM0_level2_quad_clean.evt |
| Size (bytes) | 381,225,600 | 81,017,280 |
| Size | 363.6 MB | 77.3 MB |
| Events in quadrant A | 2,738,734 | 515,460 |
| Events in quadrant B | 2,899,854 | 530,715 |
| Events in quadrant C | 2,735,464 | 518,212 |
| Events in quadrant D | 2,784,360 | 491,394 |
| Mode SS | |||
|---|---|---|---|
| Quadrant | BADHDUFLAG | Total packets | Discarded packets |
| A | 0 | 116 | 0 |
| B | 0 | 116 | 0 |
| C | 0 | 116 | 0 |
| D | 0 | 116 | 0 |
| Mode M0 | |||
|---|---|---|---|
| Quadrant | BADHDUFLAG | Total packets | Discarded packets |
| A | 0 | 11721 | 2 |
| B | 0 | 12123 | 1 |
| C | 0 | 11705 | 1 |
| D | 0 | 11970 | 1 |
| Mode M9 | |||
|---|---|---|---|
| Quadrant | BADHDUFLAG | Total packets | Discarded packets |
| A | 0 | 13 | 0 |
| B | 0 | 13 | 0 |
| C | 0 | 13 | 0 |
| D | 0 | 13 | 0 |
| Quadrant | Total seconds | Saturated seconds | Saturation percentage |
|---|---|---|---|
| A | 5684 | 26 | 0.457424% |
| B | 5684 | 30 | 0.527797% |
| C | 5684 | 21 | 0.369458% |
| D | 5684 | 24 | 0.422238% |
Noise dominated data is calculated using 1-second bins in cleaned event files. If a bin has >2000 counts, and if more than 50% of those come from <1% of pixels, then it is considered to be noise-dominated and hence unusable.
| Quadrant | # 1 sec bins | Bins with >0 counts | Bins with >2000 counts | High rate bins dominated by noise | Noise dominated (total time) | Noise dominated (detector-on time) | Marked lightcurve |
|---|---|---|---|---|---|---|---|
| A | 6969 | 5685 | 4 | 4 | 0.06% | 0.07% | 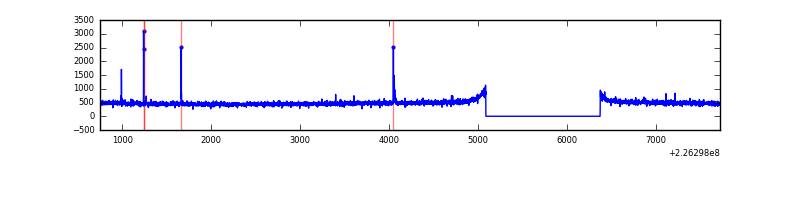 |
| B | 6969 | 5685 | 1 | 1 | 0.01% | 0.02% | 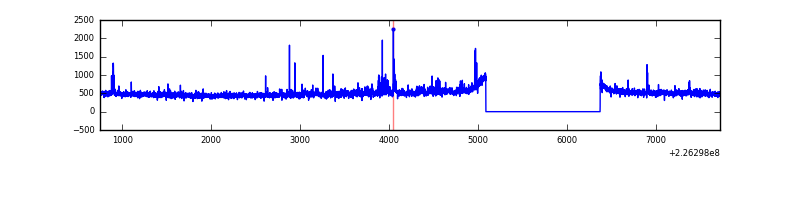 |
| C | 6969 | 5685 | 1 | 1 | 0.01% | 0.02% | 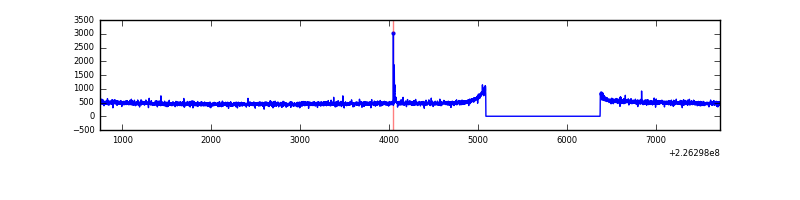 |
| D | 6969 | 5685 | 8 | 8 | 0.11% | 0.14% | 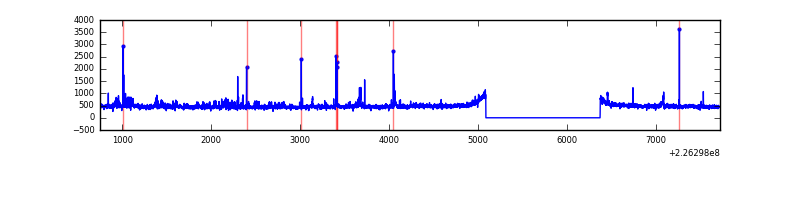 |
Top three noisy pixels from each quadrant. If the there are fewer than three noisy pixels in the level2.evt file, extra rows are filled as -1
| Pixel properties | Quadrant properties | ||||||
|---|---|---|---|---|---|---|---|
| Quadrant | DetID | PixID | Counts | Sigma | Mean | Median | Sigma |
| A | 15 | 234 | 13066 | 86.69 | 705 | 689 | 142.8 |
| A | 8 | 15 | 7208 | 45.66 | 705 | 689 | 142.8 |
| A | 0 | 226 | 6835 | 43.05 | 705 | 689 | 142.8 |
| B | 0 | 219 | 79768 | 590.33 | 708 | 690 | 134.0 |
| B | 4 | 239 | 19854 | 143.06 | 708 | 690 | 134.0 |
| B | 4 | 170 | 19474 | 140.23 | 708 | 690 | 134.0 |
| C | 13 | 61 | 5380 | 29.06 | 700 | 704 | 160.9 |
| C | 8 | 222 | 2525 | 11.32 | 700 | 704 | 160.9 |
| C | 12 | 4 | 2091 | 8.62 | 700 | 704 | 160.9 |
| D | 2 | 152 | 106134 | 626.87 | 695 | 676 | 168.2 |
| D | 13 | 104 | 22577 | 130.19 | 695 | 676 | 168.2 |
| D | 2 | 14 | 15961 | 90.86 | 695 | 676 | 168.2 |
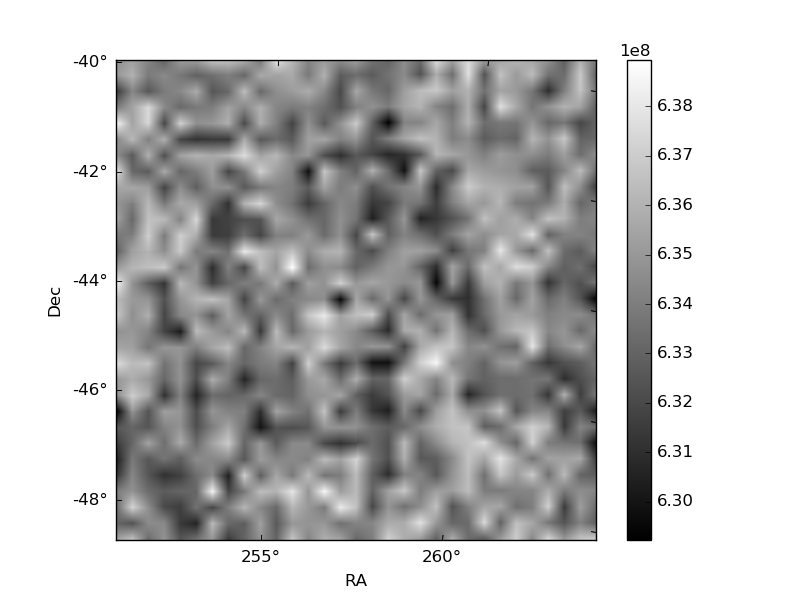
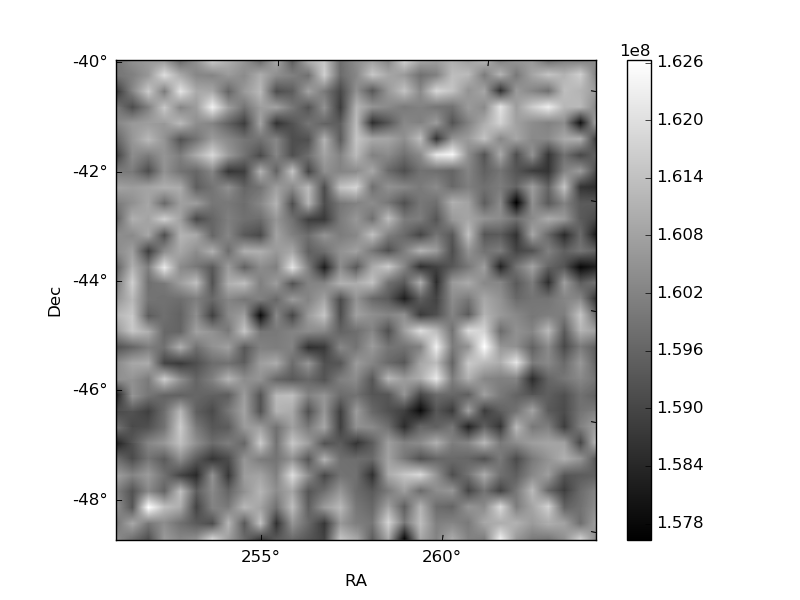
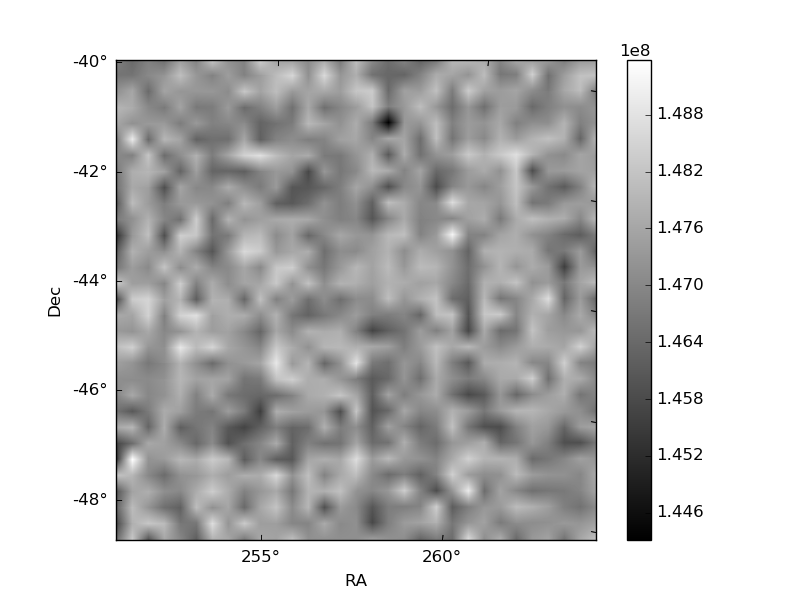
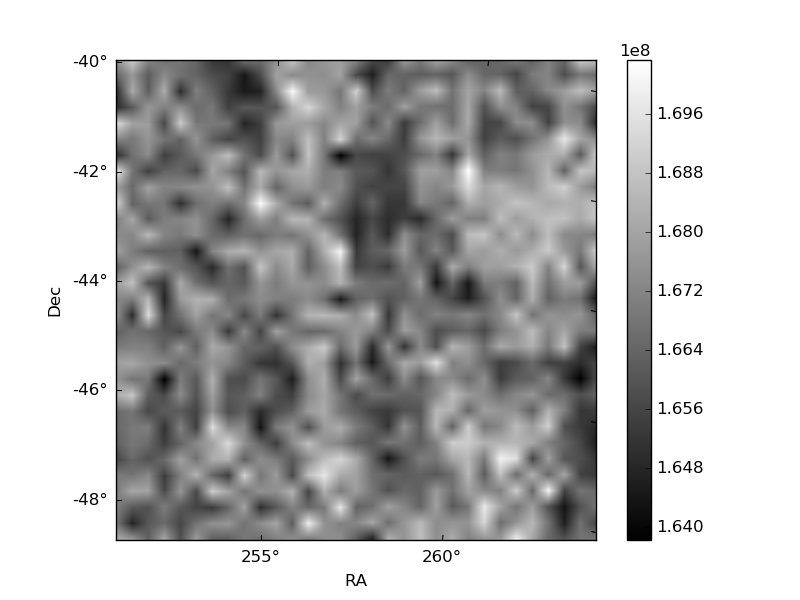
Histogram calculated using DETX and DETY for each event in the final _common_clean file
| Quadrant A | 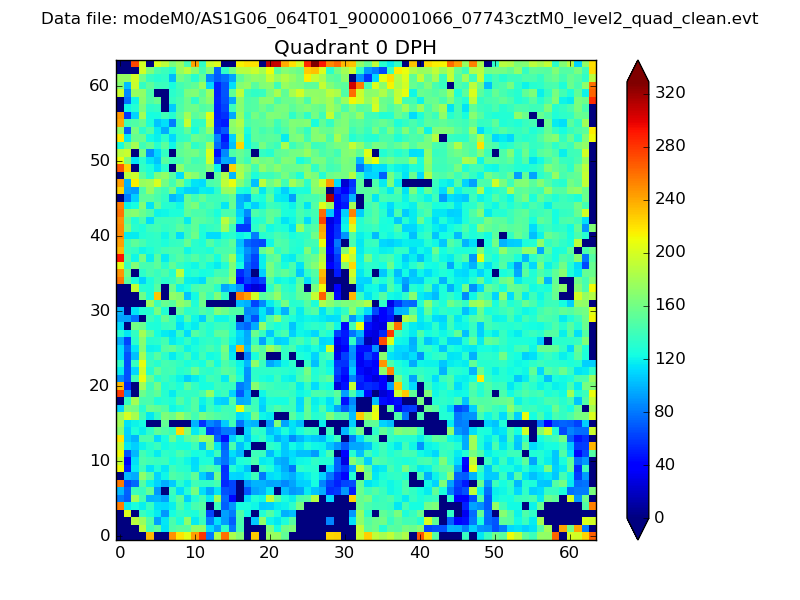 |
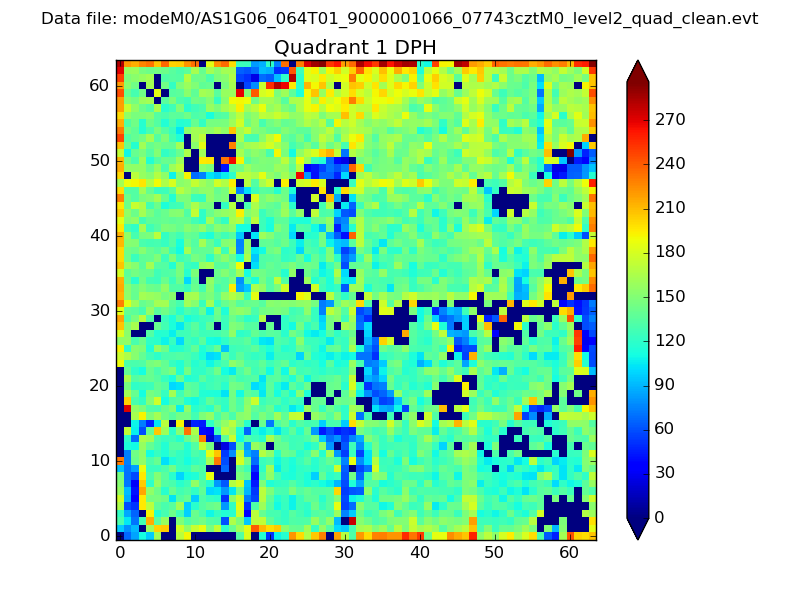 |
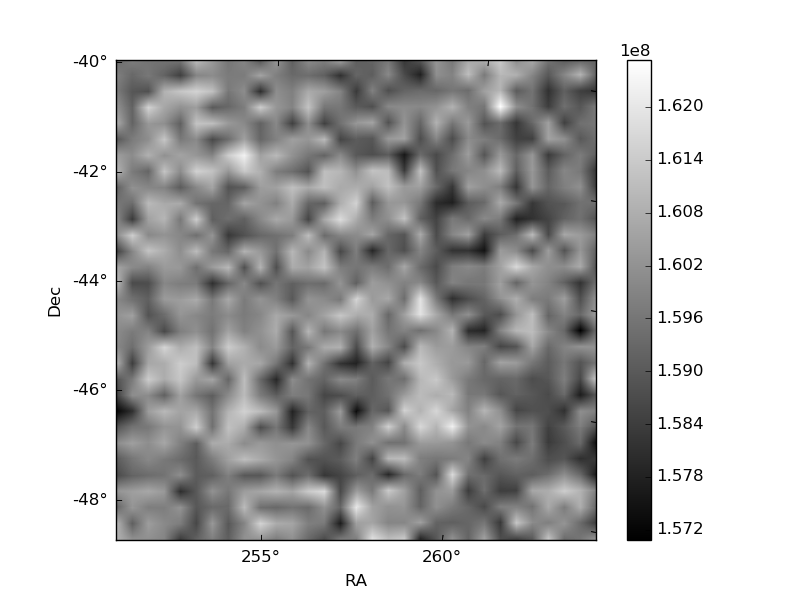
Quadrant B |
|---|---|---|---|
| Quadrant D | 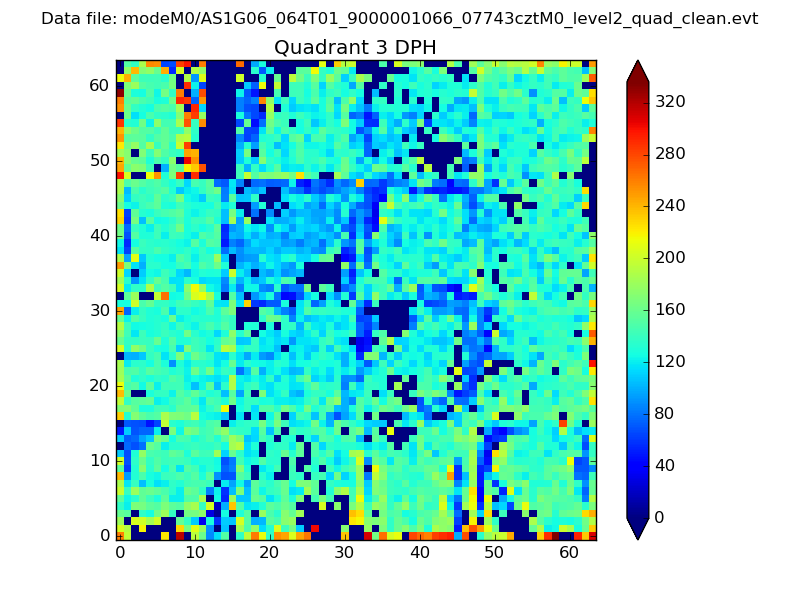 |
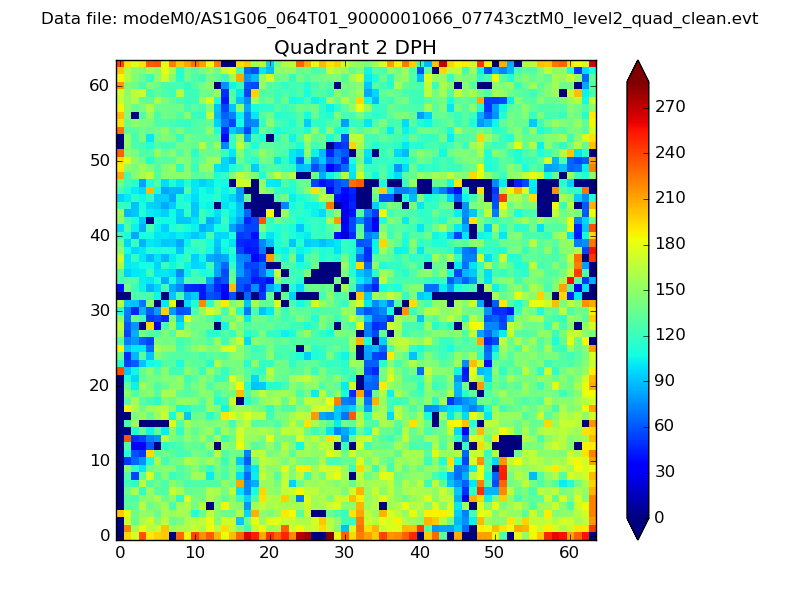 |
Quadrant C |
| Plot type | Count rate plots | Images |
|---|---|---|
| Comparison with Poisson distribution Blue bars denote a histogram of data divided into 1 sec bins. Red curve is a Poisson curve with rate = median count rate of data. |
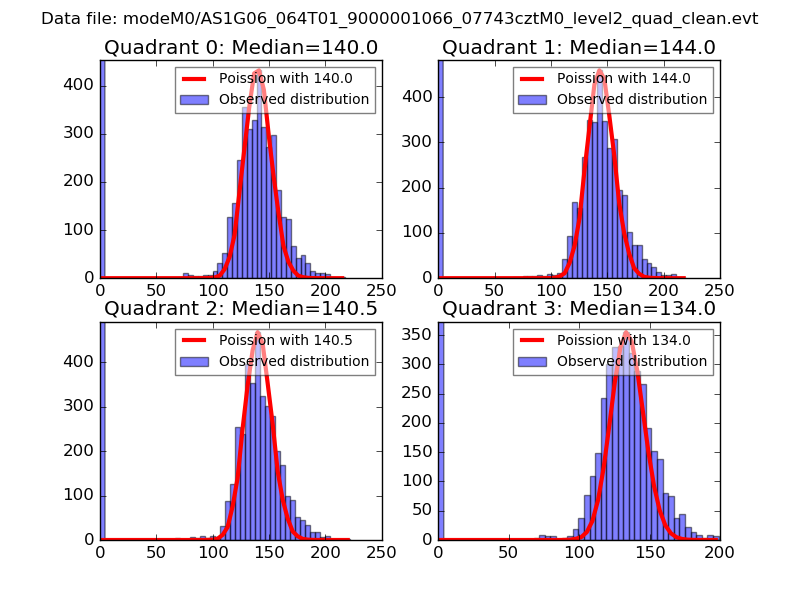 |
 |
| Quadrant-wise count rates Data is divided into 100 sec bins |
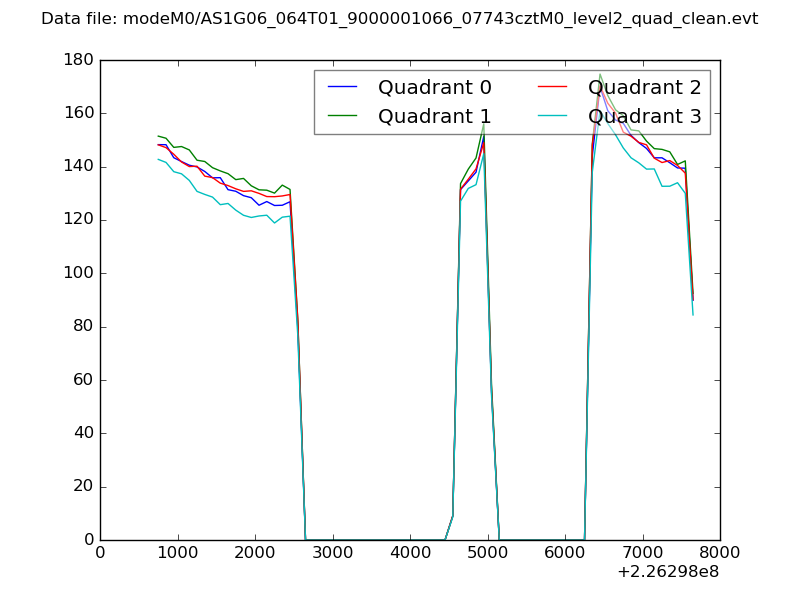 |
|
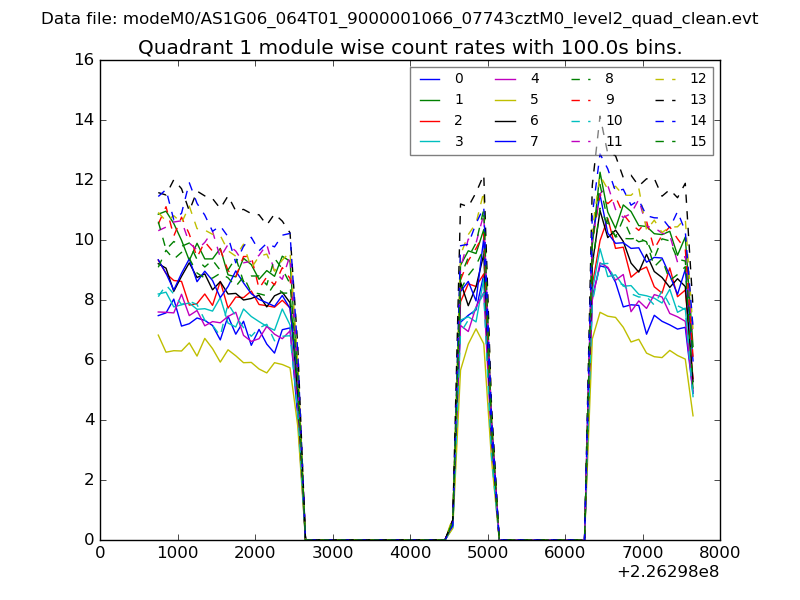
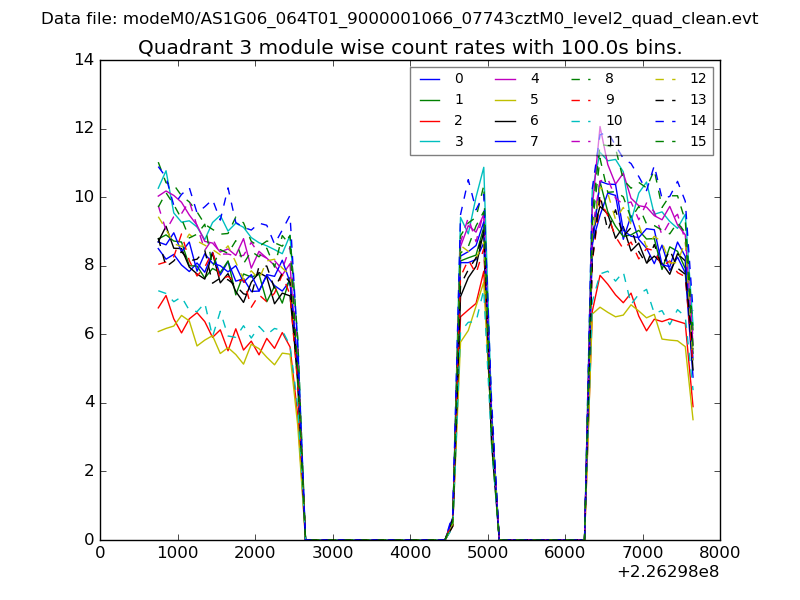
| Module-wise count rates for Quadrant A Data is divided into 100 sec bins |
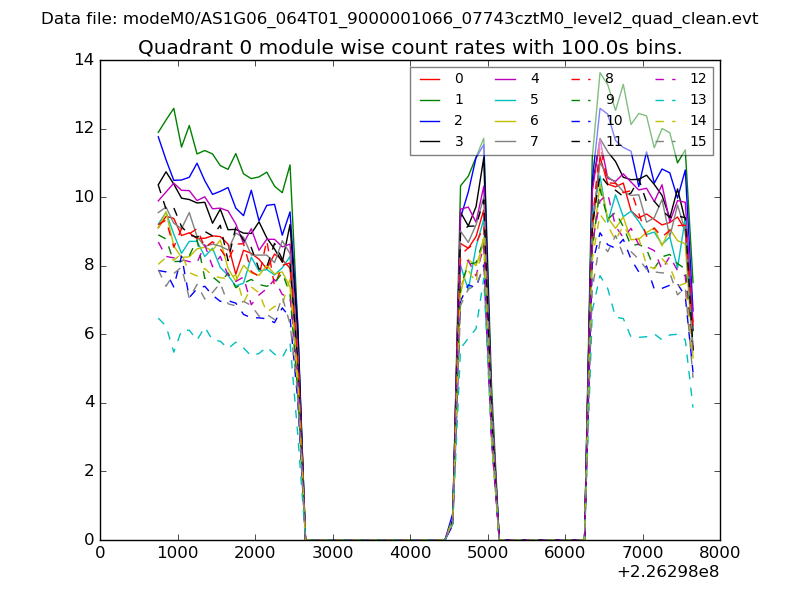 |
 |
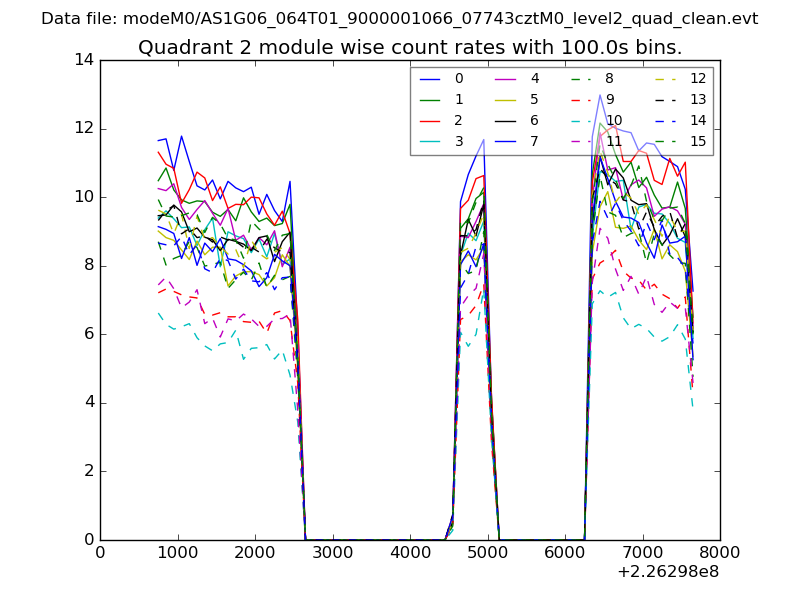
| Module-wise count rates for Quadrant B Data is divided into 100 sec bins |
 |
 |
| Module-wise count rates for Quadrant C Data is divided into 100 sec bins |
 |
 |
| Module-wise count rates for Quadrant D Data is divided into 100 sec bins |
 |
 |
| Parameter | Plot |
|---|---|
| CZT HV Monitor | 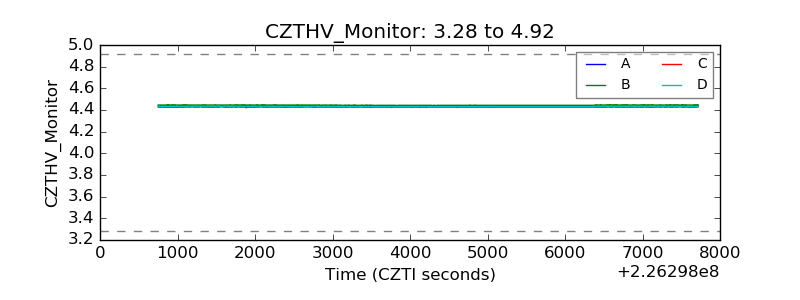 |
| D_VDD | 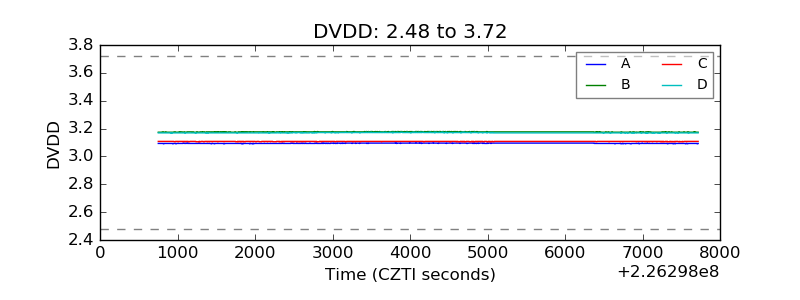 |
| Temperature 1 | 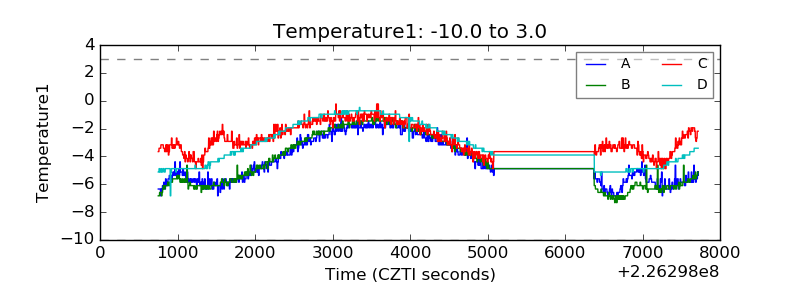 |
| Veto HV Monitor | 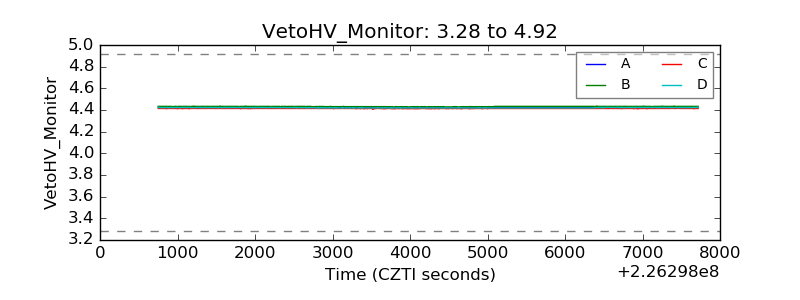 |
| Veto LLD | 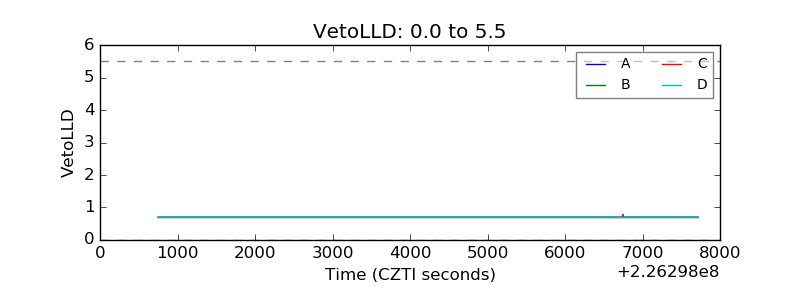 |
| Alpha Counter | 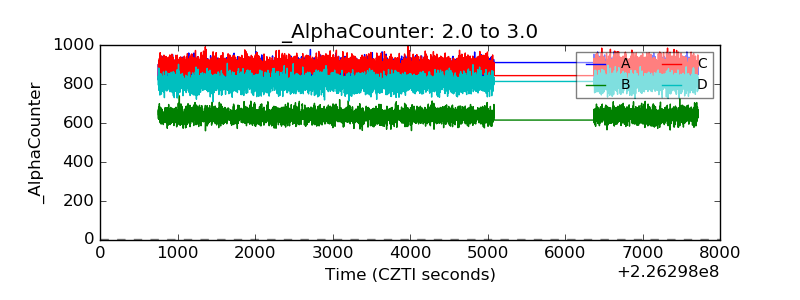 |
| _CPM_Rate | 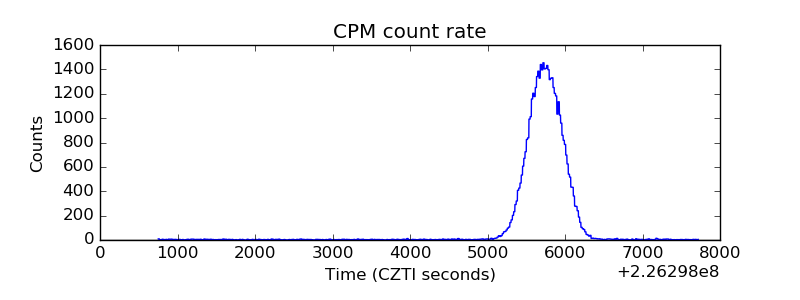 |
| CZT Counter | 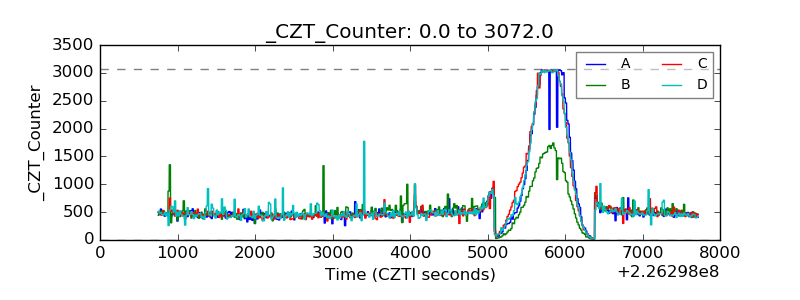 |
| +2.5 Volts monitor |  |
| +5 Volts monitor |  |
| _ROLL_ROT | 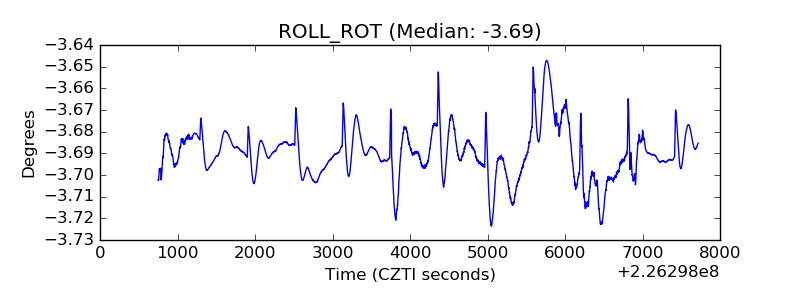 |
| _Roll_DEC | 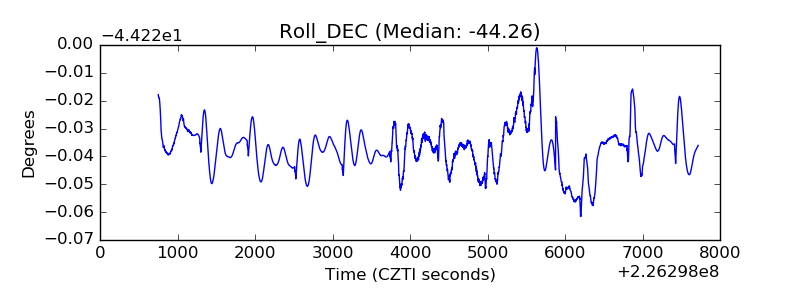 |
| _Roll_RA | 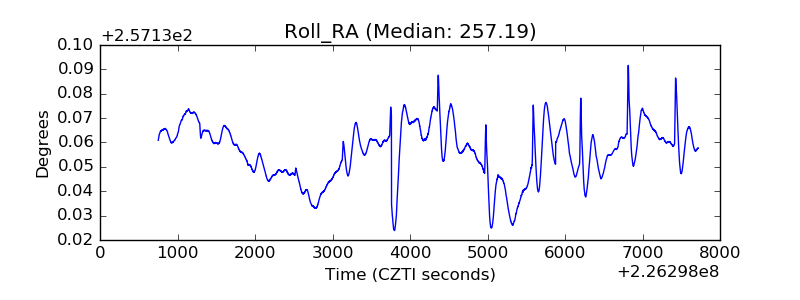 |
| Veto Counter | 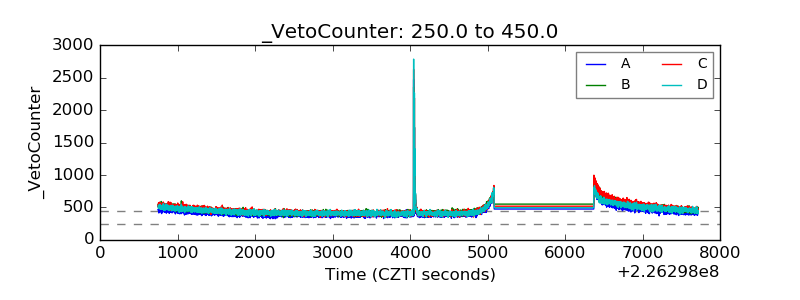 |