| Param | Original file | Final file |
|---|---|---|
| Filename | modeM0/AS1G06_064T01_9000001066_07748cztM0_level2.evt | modeM0/AS1G06_064T01_9000001066_07748cztM0_level2_quad_clean.evt |
| Size (bytes) | 518,264,640 | 85,858,560 |
| Size | 494.3 MB | 81.9 MB |
| Events in quadrant A | 3,745,269 | 520,972 |
| Events in quadrant B | 4,103,928 | 526,738 |
| Events in quadrant C | 3,582,102 | 516,795 |
| Events in quadrant D | 3,735,572 | 494,130 |
| Mode SS | |||
|---|---|---|---|
| Quadrant | BADHDUFLAG | Total packets | Discarded packets |
| A | 0 | 158 | 0 |
| B | 0 | 158 | 0 |
| C | 0 | 158 | 0 |
| D | 0 | 158 | 0 |
| Mode M0 | |||
|---|---|---|---|
| Quadrant | BADHDUFLAG | Total packets | Discarded packets |
| A | 0 | 16544 | 2 |
| B | 0 | 17355 | 1 |
| C | 0 | 16185 | 1 |
| D | 0 | 16481 | 1 |
| Mode M9 | |||
|---|---|---|---|
| Quadrant | BADHDUFLAG | Total packets | Discarded packets |
| A | 0 | 1 | 0 |
| B | 0 | 1 | 0 |
| C | 0 | 1 | 0 |
| D | 0 | 1 | 0 |
| Quadrant | Total seconds | Saturated seconds | Saturation percentage |
|---|---|---|---|
| A | 7779 | 228 | 2.930968% |
| B | 7779 | 291 | 3.740841% |
| C | 7779 | 141 | 1.812572% |
| D | 7779 | 141 | 1.812572% |
Noise dominated data is calculated using 1-second bins in cleaned event files. If a bin has >2000 counts, and if more than 50% of those come from <1% of pixels, then it is considered to be noise-dominated and hence unusable.
| Quadrant | # 1 sec bins | Bins with >0 counts | Bins with >2000 counts | High rate bins dominated by noise | Noise dominated (total time) | Noise dominated (detector-on time) | Marked lightcurve |
|---|---|---|---|---|---|---|---|
| A | 7894 | 7779 | 9 | 9 | 0.11% | 0.12% | 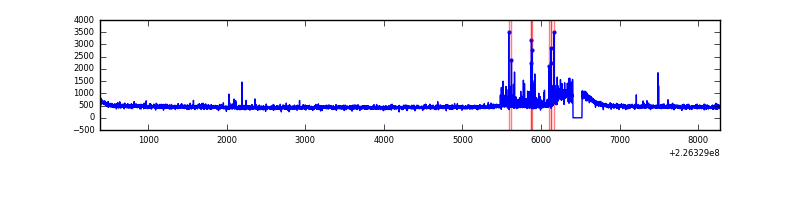 |
| B | 7894 | 7779 | 52 | 52 | 0.66% | 0.67% | 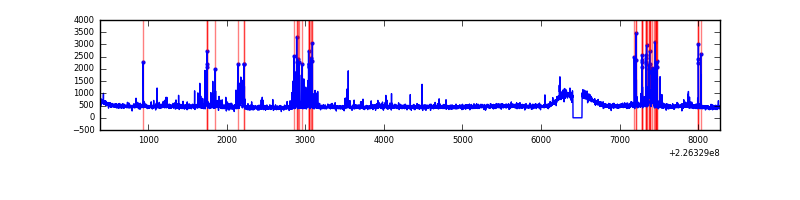 |
| C | 7894 | 7780 | 0 | 0 | 0.00% | 0.00% | 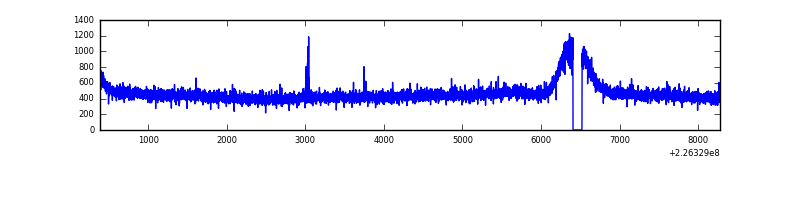 |
| D | 7894 | 7780 | 8 | 8 | 0.10% | 0.10% | 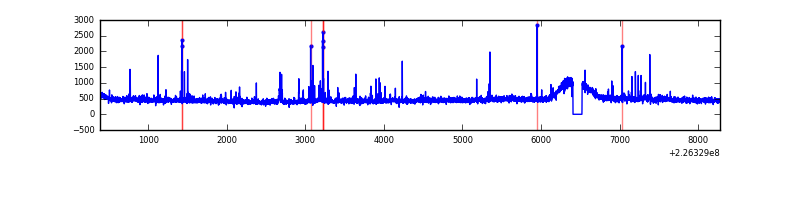 |
Top three noisy pixels from each quadrant. If the there are fewer than three noisy pixels in the level2.evt file, extra rows are filled as -1
| Pixel properties | Quadrant properties | ||||||
|---|---|---|---|---|---|---|---|
| Quadrant | DetID | PixID | Counts | Sigma | Mean | Median | Sigma |
| A | 0 | 23 | 109585 | 559.01 | 936 | 913 | 194.4 |
| A | 0 | 128 | 18947 | 92.77 | 936 | 913 | 194.4 |
| A | 0 | 226 | 16356 | 79.44 | 936 | 913 | 194.4 |
| B | 4 | 239 | 362200 | 1976.35 | 937 | 913 | 182.8 |
| B | 0 | 214 | 34514 | 183.81 | 937 | 913 | 182.8 |
| B | 15 | 204 | 21042 | 110.11 | 937 | 913 | 182.8 |
| C | 12 | 4 | 8607 | 36.0 | 914 | 919 | 213.6 |
| C | 13 | 61 | 7243 | 29.61 | 914 | 919 | 213.6 |
| C | 8 | 128 | 4559 | 17.04 | 914 | 919 | 213.6 |
| D | 8 | 195 | 97491 | 425.57 | 917 | 888 | 227.0 |
| D | 2 | 14 | 38073 | 163.81 | 917 | 888 | 227.0 |
| D | 13 | 104 | 36841 | 158.39 | 917 | 888 | 227.0 |
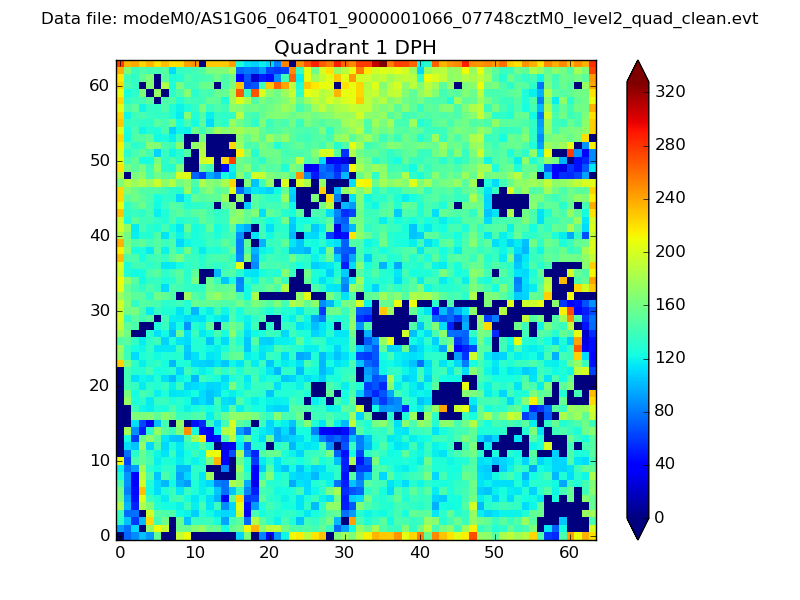
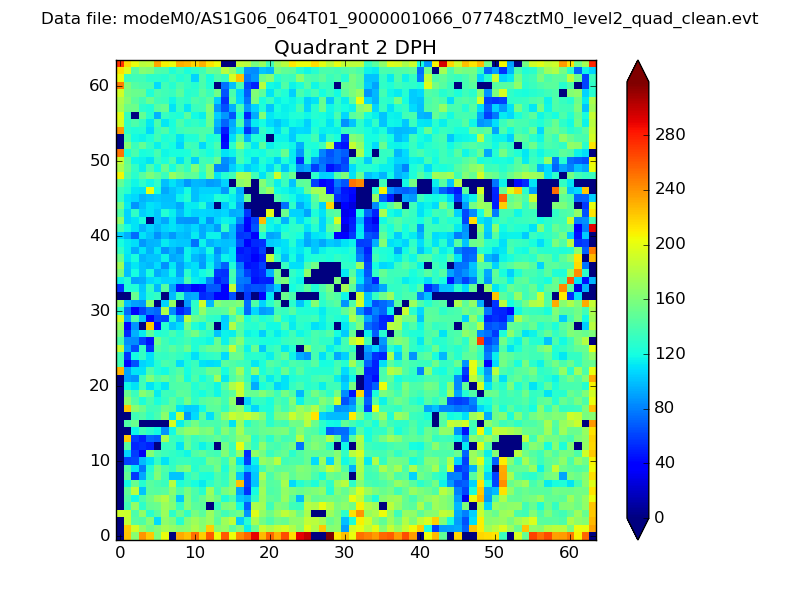
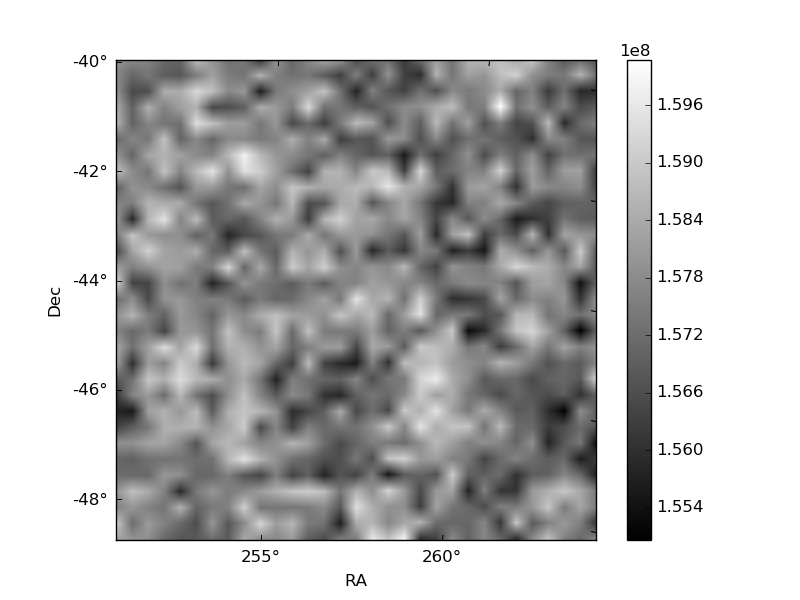
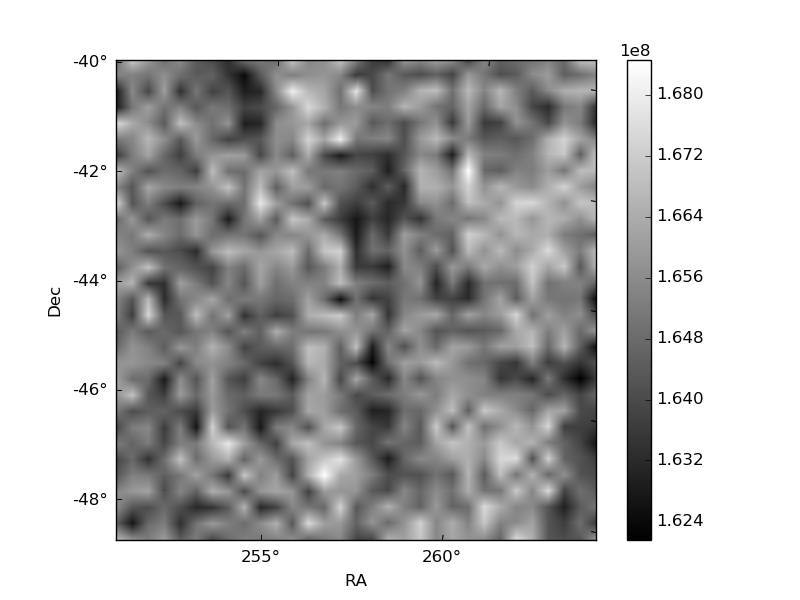
Histogram calculated using DETX and DETY for each event in the final _common_clean file
| Quadrant A |  |
 |
Quadrant B |
|---|---|---|---|
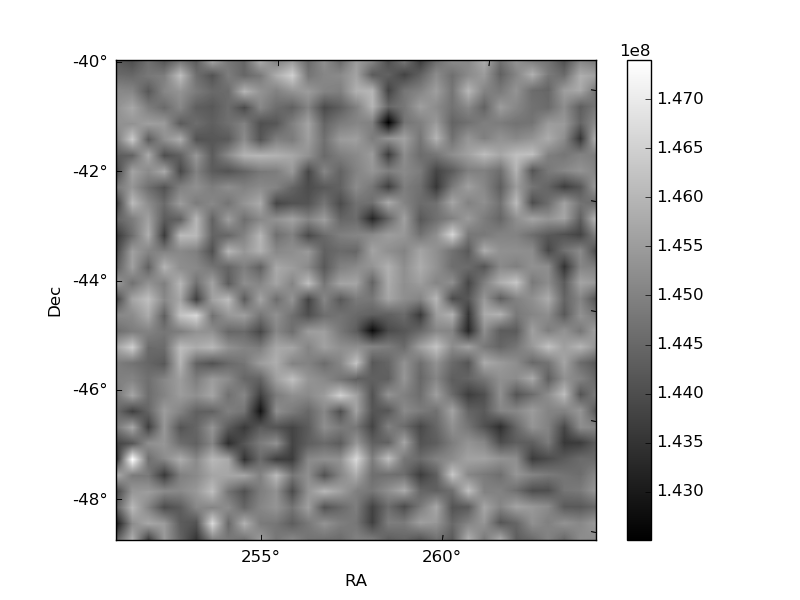
| Quadrant D |  |
 |
Quadrant C |
| Plot type | Count rate plots | Images |
|---|---|---|
| Comparison with Poisson distribution Blue bars denote a histogram of data divided into 1 sec bins. Red curve is a Poisson curve with rate = median count rate of data. |
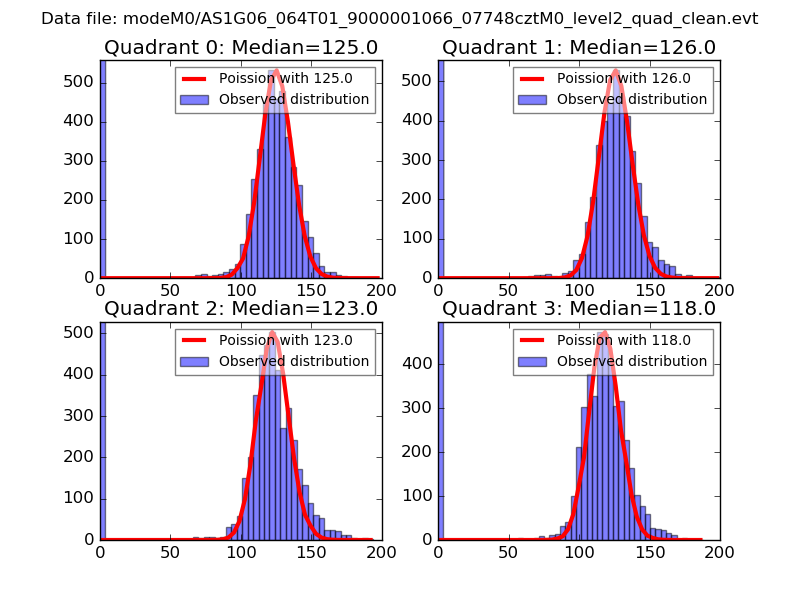 |
 |
| Quadrant-wise count rates Data is divided into 100 sec bins |
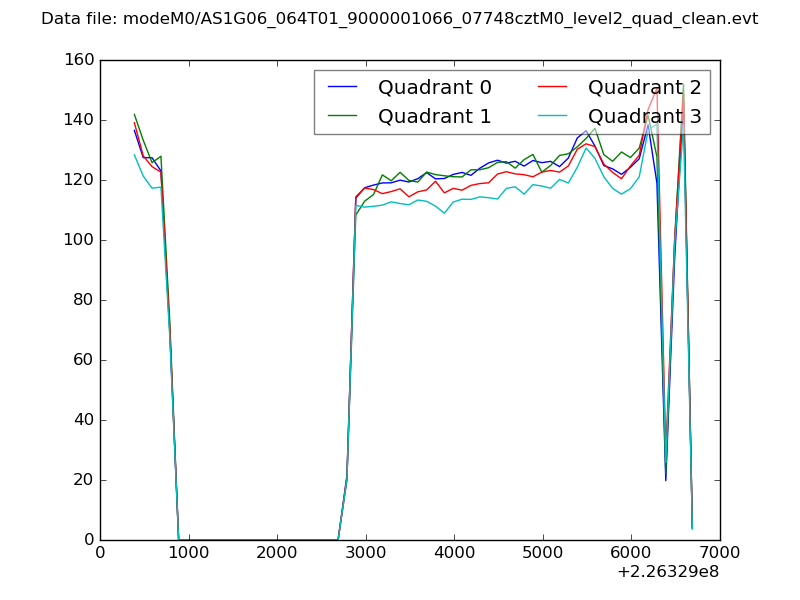 |
|
| Module-wise count rates for Quadrant A Data is divided into 100 sec bins |
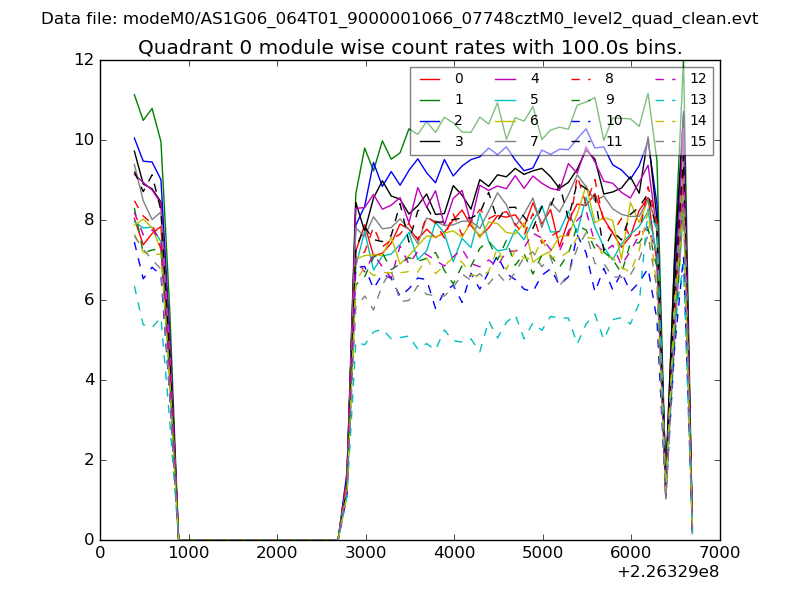 |
 |
| Module-wise count rates for Quadrant B Data is divided into 100 sec bins |
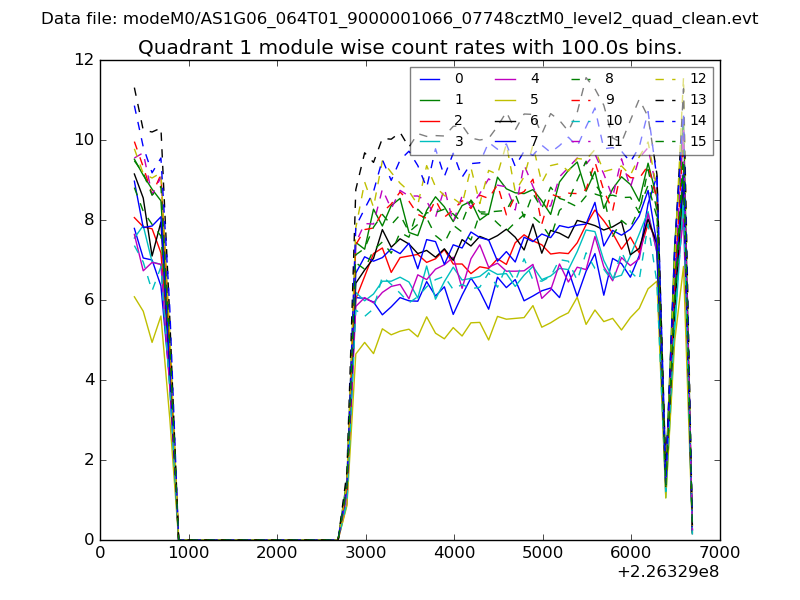 |
 |
| Module-wise count rates for Quadrant C Data is divided into 100 sec bins |
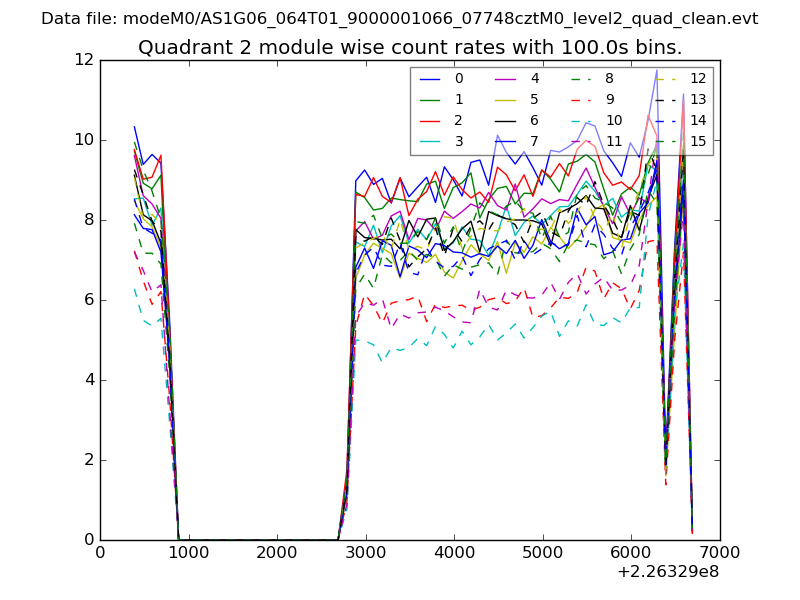 |
 |
| Module-wise count rates for Quadrant D Data is divided into 100 sec bins |
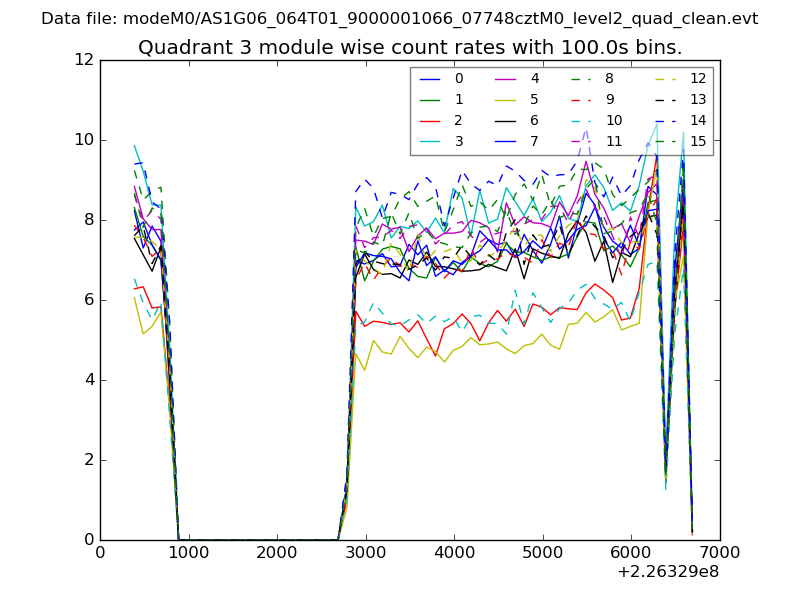 |
 |
| Parameter | Plot |
|---|---|
| CZT HV Monitor | 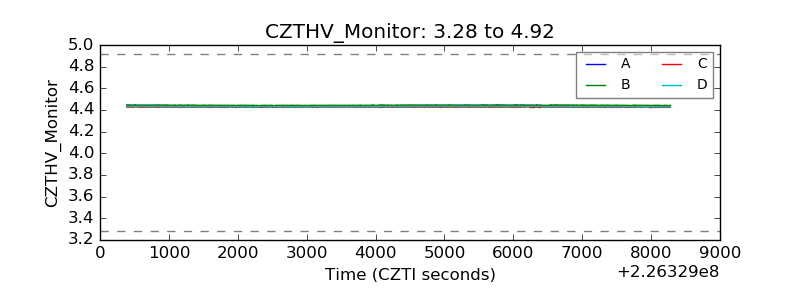 |
| D_VDD | 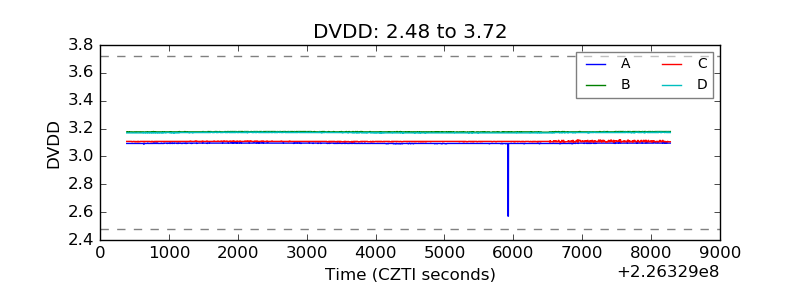 |
| Temperature 1 | 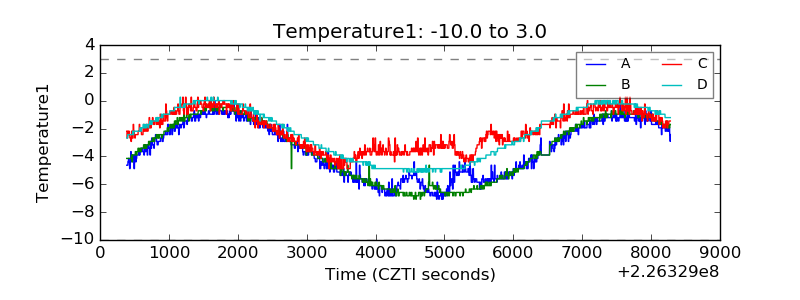 |
| Veto HV Monitor | 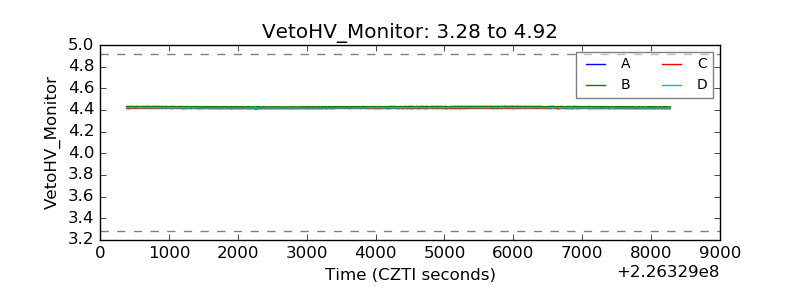 |
| Veto LLD | 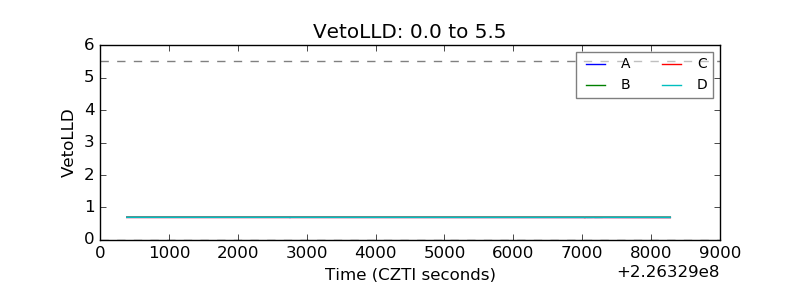 |
| Alpha Counter | 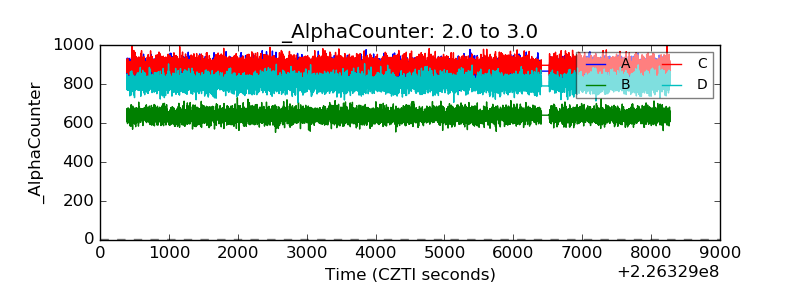 |
| _CPM_Rate | 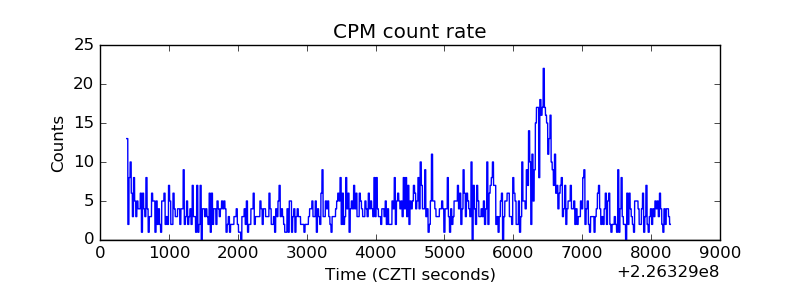 |
| CZT Counter | 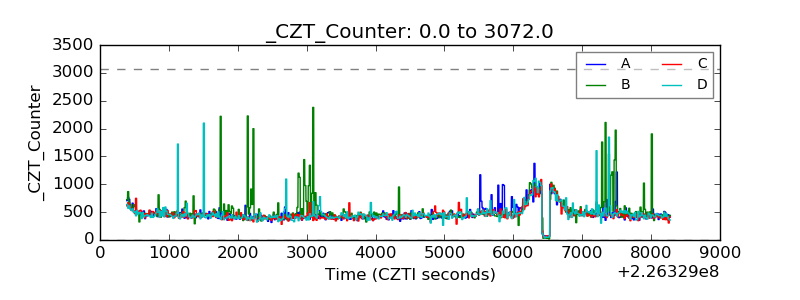 |
| +2.5 Volts monitor |  |
| +5 Volts monitor |  |
| _ROLL_ROT | 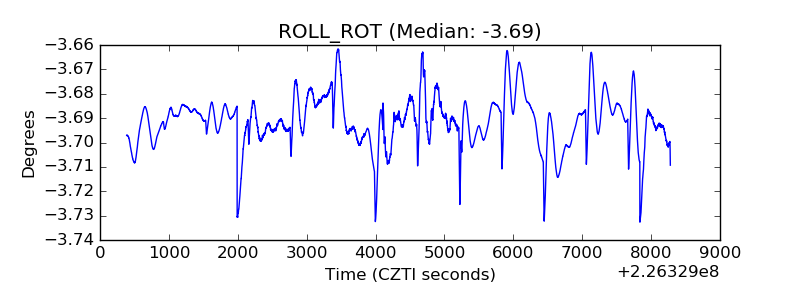 |
| _Roll_DEC | 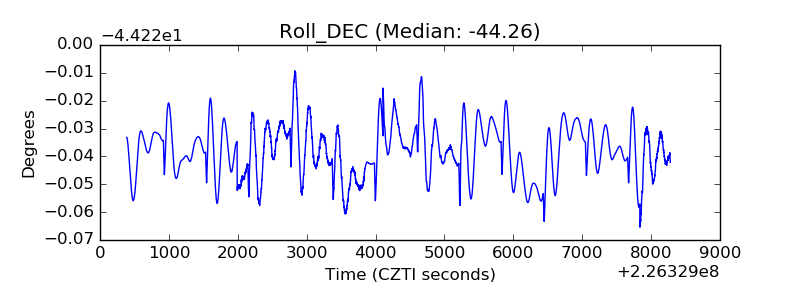 |
| _Roll_RA | 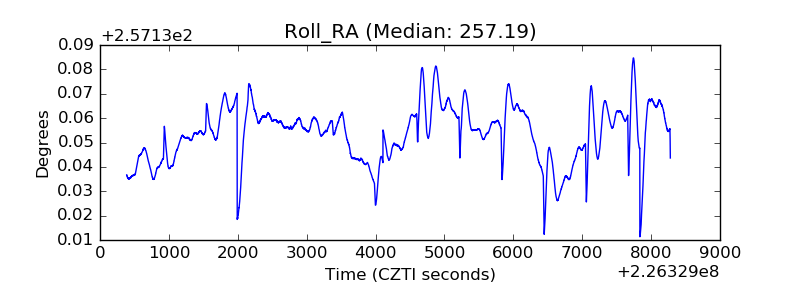 |
| Veto Counter | 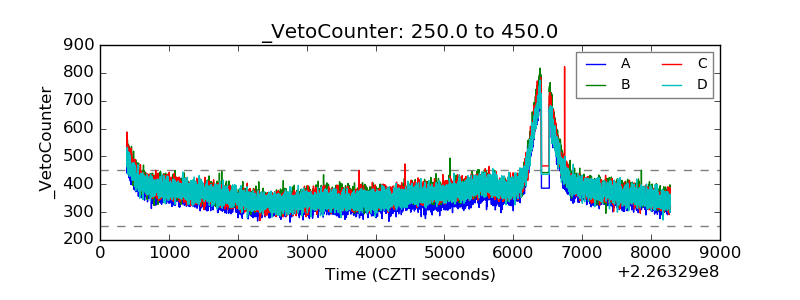 |