| Param | Original file | Final file |
|---|---|---|
| Filename | modeM0/AS1G06_064T01_9000001066_07751cztM0_level2.evt | modeM0/AS1G06_064T01_9000001066_07751cztM0_level2_quad_clean.evt |
| Size (bytes) | 405,236,160 | 74,318,400 |
| Size | 386.5 MB | 70.9 MB |
| Events in quadrant A | 2,988,711 | 460,941 |
| Events in quadrant B | 3,099,470 | 464,272 |
| Events in quadrant C | 2,797,330 | 452,125 |
| Events in quadrant D | 2,960,565 | 435,629 |
| Mode SS | |||
|---|---|---|---|
| Quadrant | BADHDUFLAG | Total packets | Discarded packets |
| A | 0 | 130 | 2 |
| B | 0 | 130 | 2 |
| C | 0 | 130 | 2 |
| D | 0 | 130 | 2 |
| Mode M0 | |||
|---|---|---|---|
| Quadrant | BADHDUFLAG | Total packets | Discarded packets |
| A | 0 | 13394 | 152 |
| B | 0 | 13573 | 160 |
| C | 0 | 12886 | 152 |
| D | 0 | 13367 | 170 |
| Mode M9 | |||
|---|---|---|---|
| Quadrant | BADHDUFLAG | Total packets | Discarded packets |
| A | 0 | 5 | 0 |
| B | 0 | 5 | 0 |
| C | 0 | 5 | 0 |
| D | 0 | 5 | 0 |
| Quadrant | Total seconds | Saturated seconds | Saturation percentage |
|---|---|---|---|
| A | 6268 | 79 | 1.260370% |
| B | 6266 | 83 | 1.324609% |
| C | 6263 | 28 | 0.447070% |
| D | 6262 | 42 | 0.670712% |
Noise dominated data is calculated using 1-second bins in cleaned event files. If a bin has >2000 counts, and if more than 50% of those come from <1% of pixels, then it is considered to be noise-dominated and hence unusable.
| Quadrant | # 1 sec bins | Bins with >0 counts | Bins with >2000 counts | High rate bins dominated by noise | Noise dominated (total time) | Noise dominated (detector-on time) | Marked lightcurve |
|---|---|---|---|---|---|---|---|
| A | 6864 | 6278 | 10 | 10 | 0.15% | 0.16% | 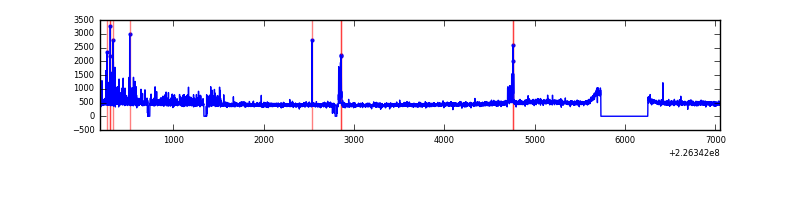 |
| B | 6864 | 6276 | 13 | 13 | 0.19% | 0.21% | 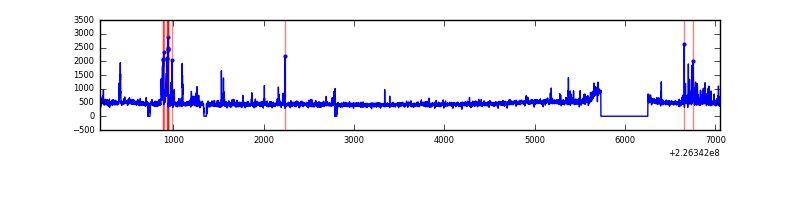 |
| C | 6864 | 6275 | 0 | 0 | 0.00% | 0.00% | 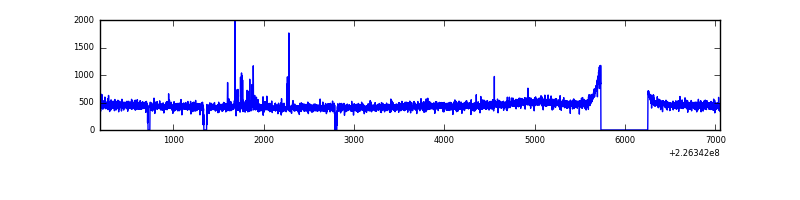 |
| D | 6864 | 6271 | 8 | 8 | 0.12% | 0.13% | 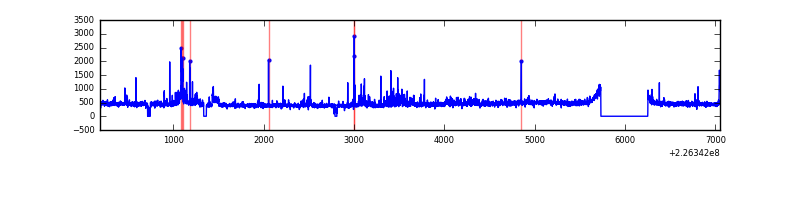 |
Top three noisy pixels from each quadrant. If the there are fewer than three noisy pixels in the level2.evt file, extra rows are filled as -1
| Pixel properties | Quadrant properties | ||||||
|---|---|---|---|---|---|---|---|
| Quadrant | DetID | PixID | Counts | Sigma | Mean | Median | Sigma |
| A | 0 | 23 | 104045 | 678.16 | 729 | 711 | 152.4 |
| A | 0 | 128 | 37050 | 238.49 | 729 | 711 | 152.4 |
| A | 13 | 248 | 31923 | 204.84 | 729 | 711 | 152.4 |
| B | 4 | 239 | 120956 | 857.99 | 732 | 713 | 140.1 |
| B | 0 | 230 | 66828 | 471.76 | 732 | 713 | 140.1 |
| B | 15 | 85 | 23604 | 163.34 | 732 | 713 | 140.1 |
| C | 12 | 4 | 31621 | 186.83 | 708 | 711 | 165.4 |
| C | 13 | 61 | 5510 | 29.01 | 708 | 711 | 165.4 |
| C | 8 | 222 | 3064 | 14.22 | 708 | 711 | 165.4 |
| D | 2 | 152 | 156311 | 894.84 | 706 | 683 | 173.9 |
| D | 13 | 137 | 45700 | 258.84 | 706 | 683 | 173.9 |
| D | 13 | 104 | 29915 | 168.08 | 706 | 683 | 173.9 |
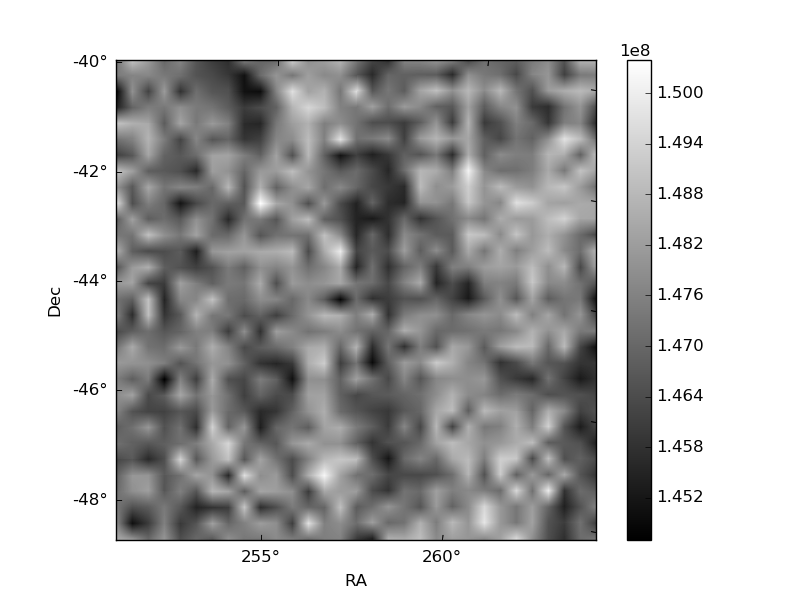
Histogram calculated using DETX and DETY for each event in the final _common_clean file
| Quadrant A |  |
 |
Quadrant B |
|---|---|---|---|
| Quadrant D |  |
 |
Quadrant C |
| Plot type | Count rate plots | Images |
|---|---|---|
| Comparison with Poisson distribution Blue bars denote a histogram of data divided into 1 sec bins. Red curve is a Poisson curve with rate = median count rate of data. |
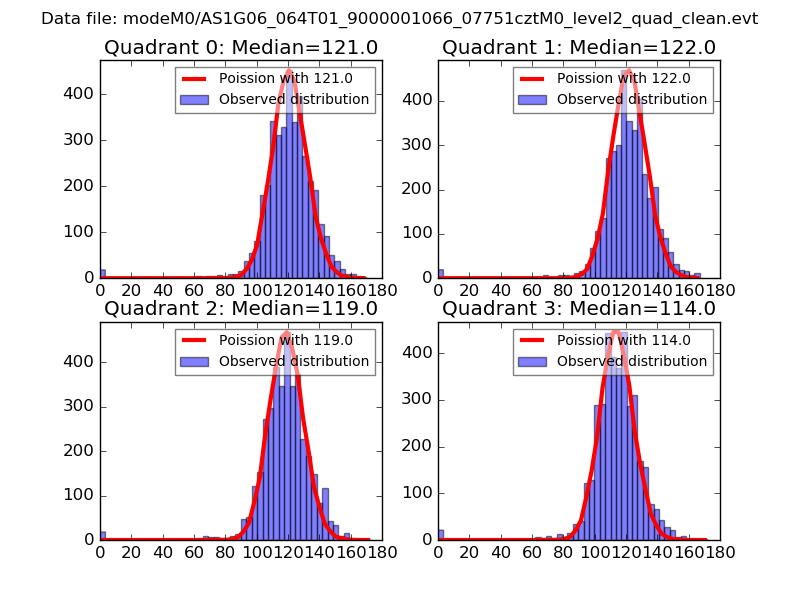 |
 |
| Quadrant-wise count rates Data is divided into 100 sec bins |
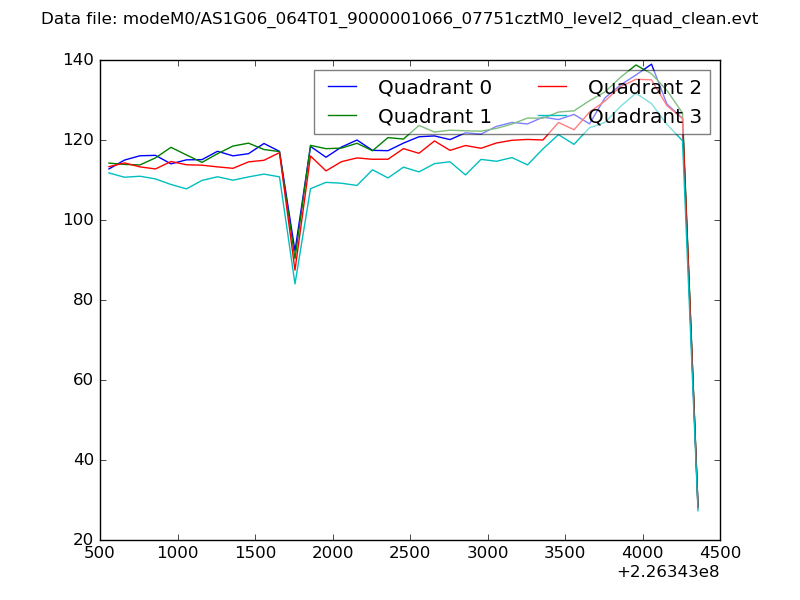 |
|
| Module-wise count rates for Quadrant A Data is divided into 100 sec bins |
 |
 |
| Module-wise count rates for Quadrant B Data is divided into 100 sec bins |
 |
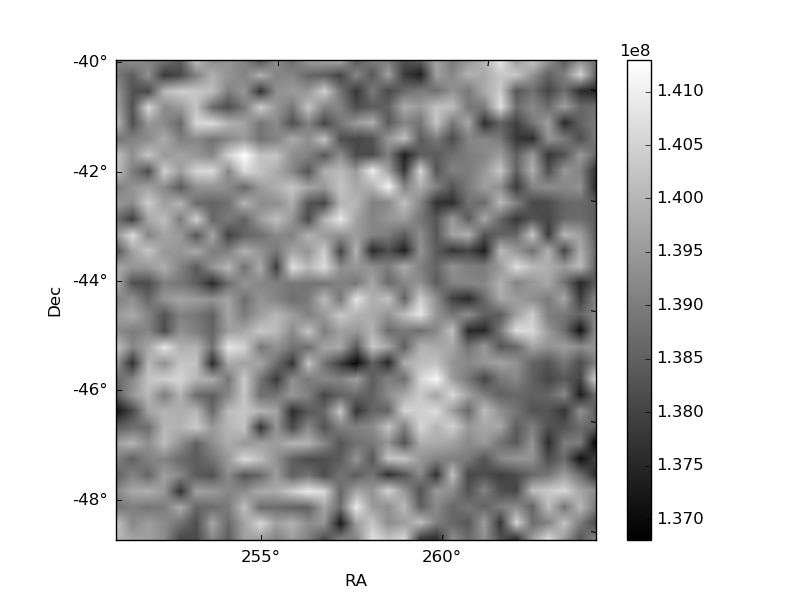 |
| Module-wise count rates for Quadrant C Data is divided into 100 sec bins |
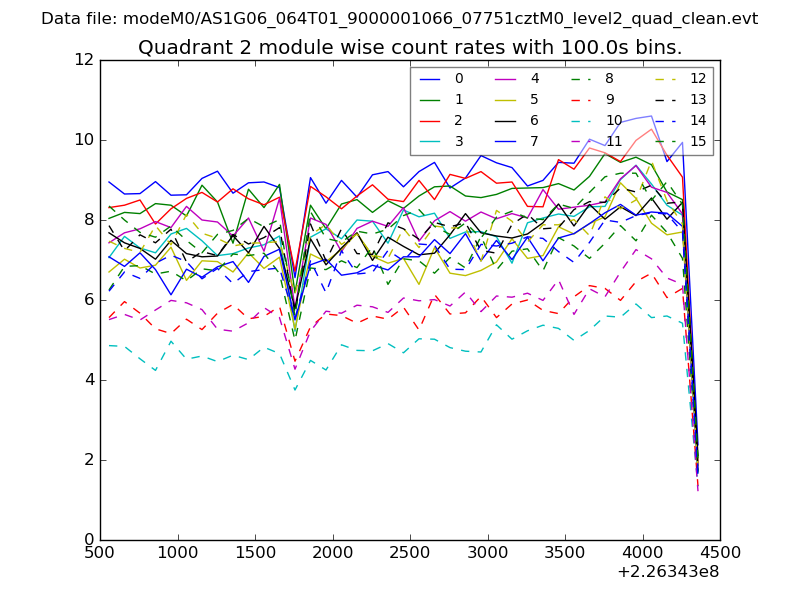 |
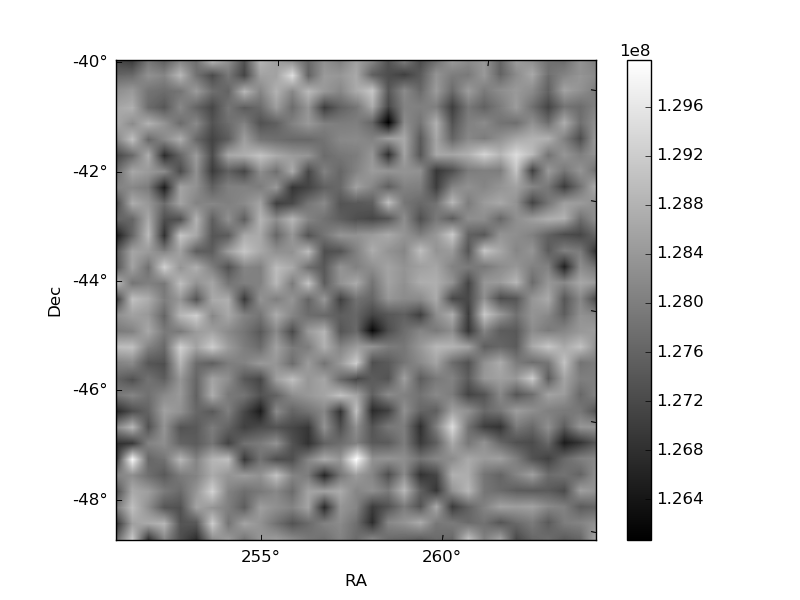 |
| Module-wise count rates for Quadrant D Data is divided into 100 sec bins |
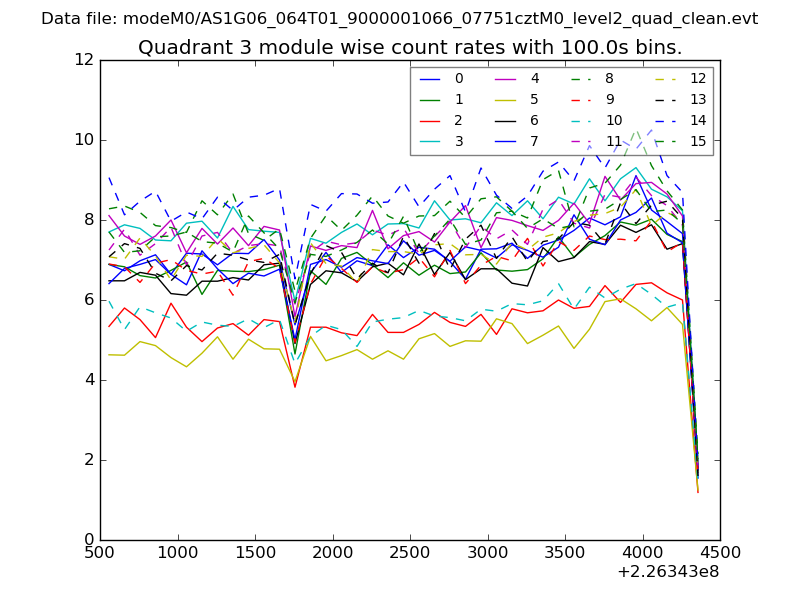 |
 |
| Parameter | Plot |
|---|---|
| CZT HV Monitor | 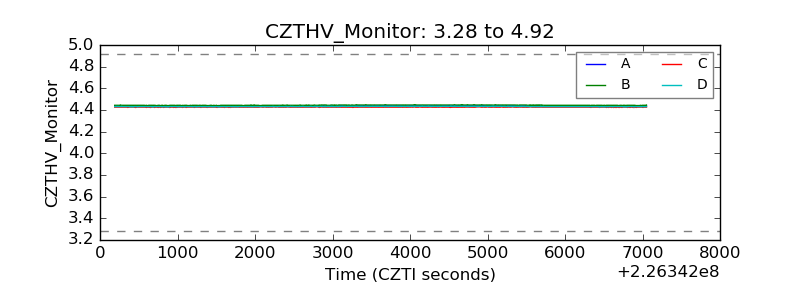 |
| D_VDD | 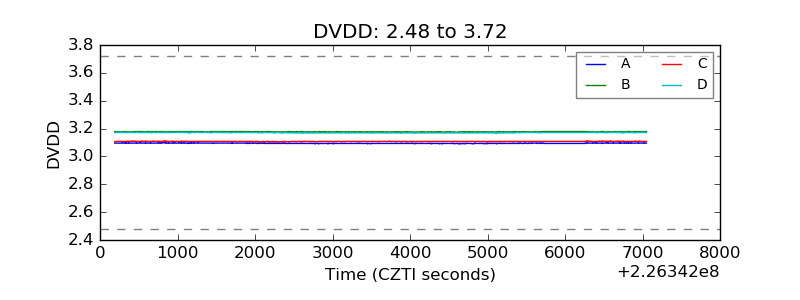 |
| Temperature 1 | 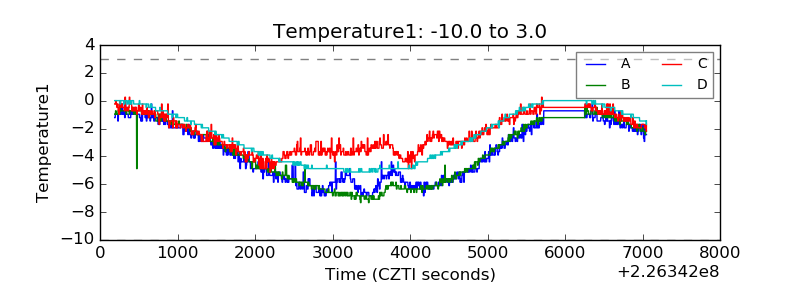 |
| Veto HV Monitor | 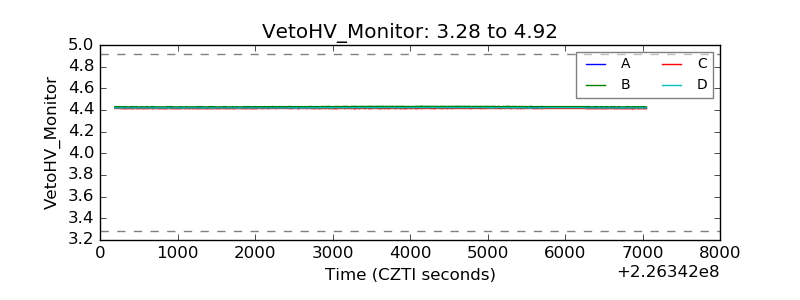 |
| Veto LLD |  |
| Alpha Counter | 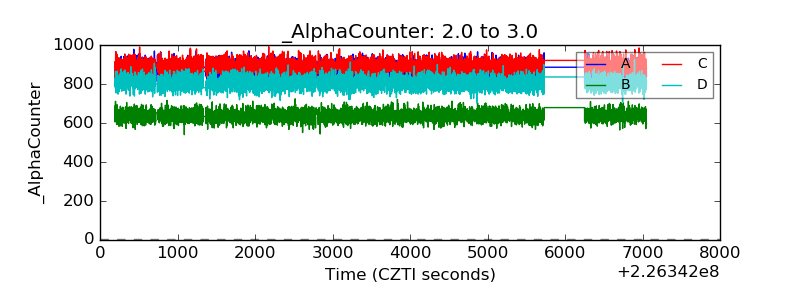 |
| _CPM_Rate | 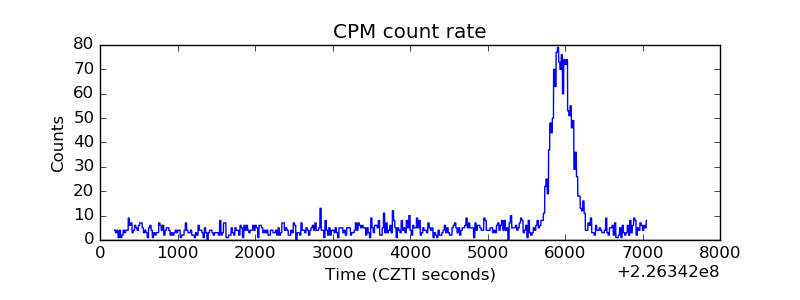 |
| CZT Counter | 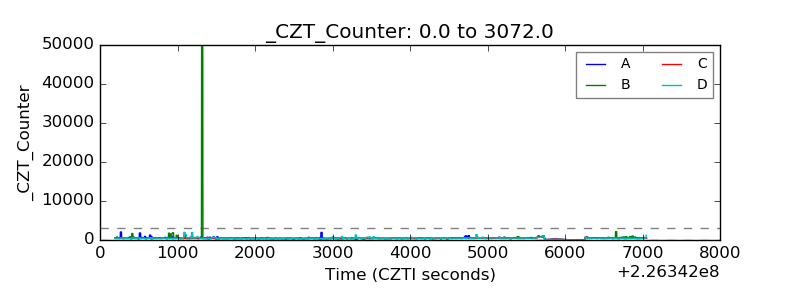 |
| +2.5 Volts monitor |  |
| +5 Volts monitor |  |
| _ROLL_ROT | 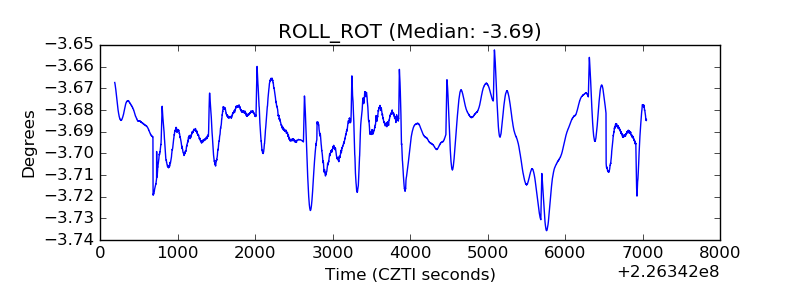 |
| _Roll_DEC | 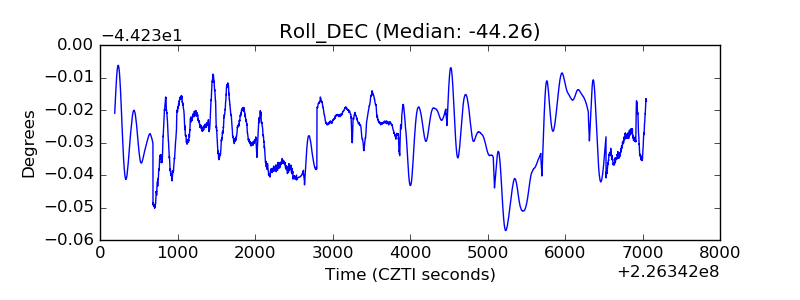 |
| _Roll_RA | 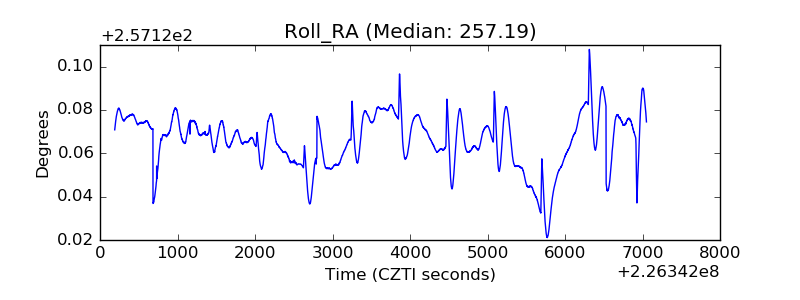 |
| Veto Counter | 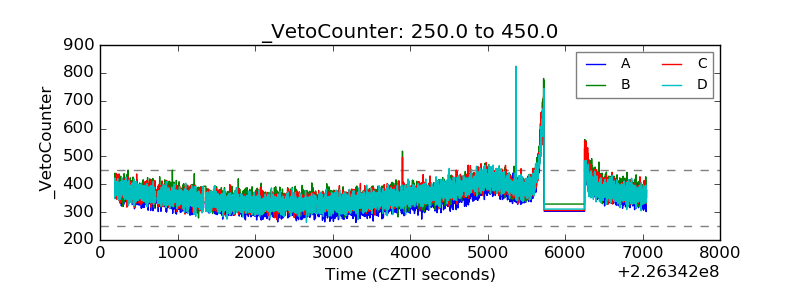 |