| Param | Original file | Final file |
|---|---|---|
| Filename | modeM0/AS1G06_064T01_9000001066_07755cztM0_level2.evt | modeM0/AS1G06_064T01_9000001066_07755cztM0_level2_quad_clean.evt |
| Size (bytes) | 418,250,880 | 98,202,240 |
| Size | 398.9 MB | 93.7 MB |
| Events in quadrant A | 2,957,094 | 636,452 |
| Events in quadrant B | 3,230,325 | 651,476 |
| Events in quadrant C | 2,989,896 | 634,064 |
| Events in quadrant D | 3,049,374 | 600,880 |
| Mode SS | |||
|---|---|---|---|
| Quadrant | BADHDUFLAG | Total packets | Discarded packets |
| A | 0 | 130 | 0 |
| B | 0 | 130 | 0 |
| C | 0 | 130 | 0 |
| D | 0 | 130 | 0 |
| Mode M0 | |||
|---|---|---|---|
| Quadrant | BADHDUFLAG | Total packets | Discarded packets |
| A | 0 | 13190 | 3 |
| B | 0 | 13969 | 2 |
| C | 0 | 13256 | 2 |
| D | 0 | 13609 | 2 |
| Mode M9 | |||
|---|---|---|---|
| Quadrant | BADHDUFLAG | Total packets | Discarded packets |
| A | 0 | 19 | 0 |
| B | 0 | 19 | 0 |
| C | 0 | 19 | 0 |
| D | 0 | 20 | 0 |
| Quadrant | Total seconds | Saturated seconds | Saturation percentage |
|---|---|---|---|
| A | 6473 | 19 | 0.293527% |
| B | 6473 | 37 | 0.571605% |
| C | 6473 | 8 | 0.123590% |
| D | 6473 | 14 | 0.216283% |
Noise dominated data is calculated using 1-second bins in cleaned event files. If a bin has >2000 counts, and if more than 50% of those come from <1% of pixels, then it is considered to be noise-dominated and hence unusable.
| Quadrant | # 1 sec bins | Bins with >0 counts | Bins with >2000 counts | High rate bins dominated by noise | Noise dominated (total time) | Noise dominated (detector-on time) | Marked lightcurve |
|---|---|---|---|---|---|---|---|
| A | 7613 | 6474 | 6 | 6 | 0.08% | 0.09% | 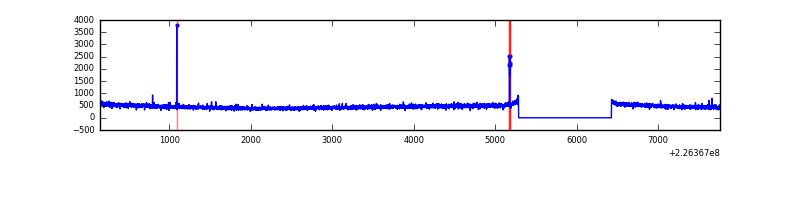 |
| B | 7613 | 6474 | 17 | 17 | 0.22% | 0.26% | 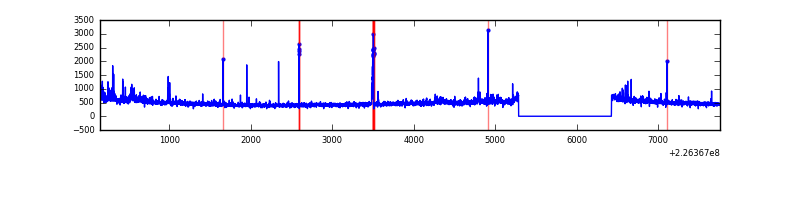 |
| C | 7613 | 6474 | 0 | 0 | 0.00% | 0.00% | 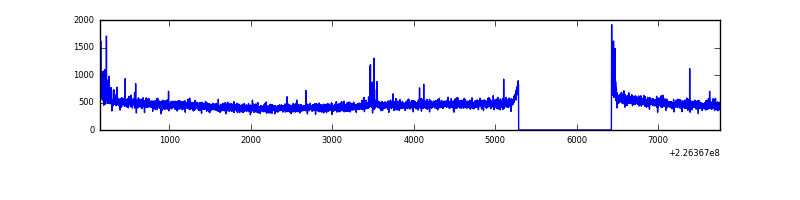 |
| D | 7613 | 6474 | 5 | 5 | 0.07% | 0.08% | 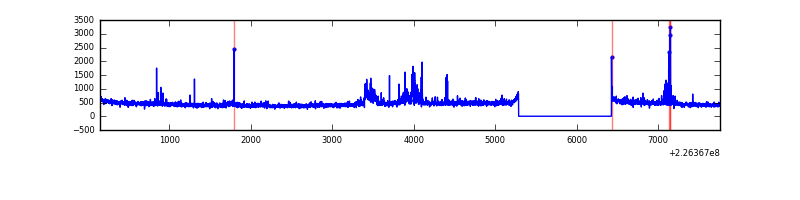 |
Top three noisy pixels from each quadrant. If the there are fewer than three noisy pixels in the level2.evt file, extra rows are filled as -1
| Pixel properties | Quadrant properties | ||||||
|---|---|---|---|---|---|---|---|
| Quadrant | DetID | PixID | Counts | Sigma | Mean | Median | Sigma |
| A | 15 | 234 | 13107 | 79.49 | 763 | 748 | 155.5 |
| A | 0 | 226 | 7234 | 41.72 | 763 | 748 | 155.5 |
| A | 12 | 194 | 6746 | 38.58 | 763 | 748 | 155.5 |
| B | 4 | 173 | 42053 | 278.97 | 778 | 759 | 148.0 |
| B | 4 | 239 | 38714 | 256.42 | 778 | 759 | 148.0 |
| B | 10 | 16 | 33836 | 223.46 | 778 | 759 | 148.0 |
| C | 12 | 4 | 28082 | 156.4 | 756 | 762 | 174.7 |
| C | 10 | 169 | 9926 | 52.46 | 756 | 762 | 174.7 |
| C | 13 | 61 | 5775 | 28.7 | 756 | 762 | 174.7 |
| D | 12 | 221 | 136807 | 744.32 | 745 | 722 | 182.8 |
| D | 1 | 52 | 36756 | 197.09 | 745 | 722 | 182.8 |
| D | 12 | 233 | 24617 | 130.69 | 745 | 722 | 182.8 |
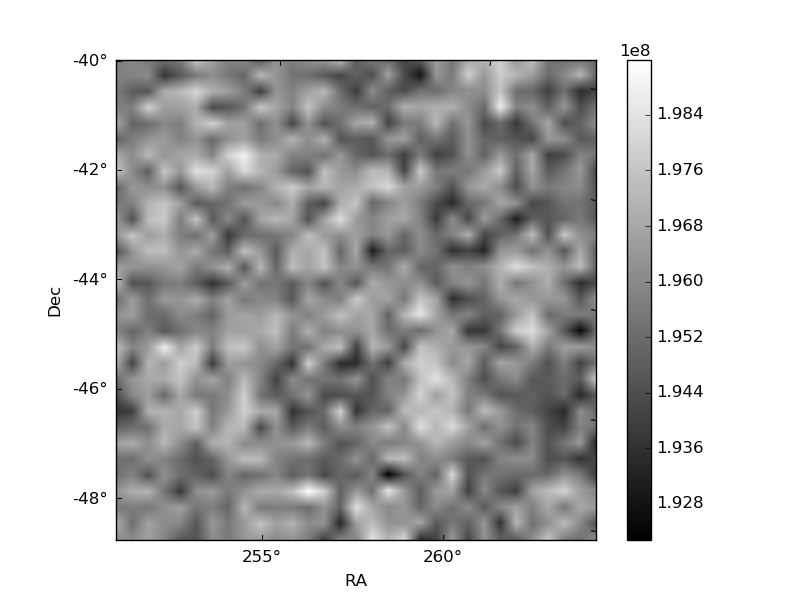
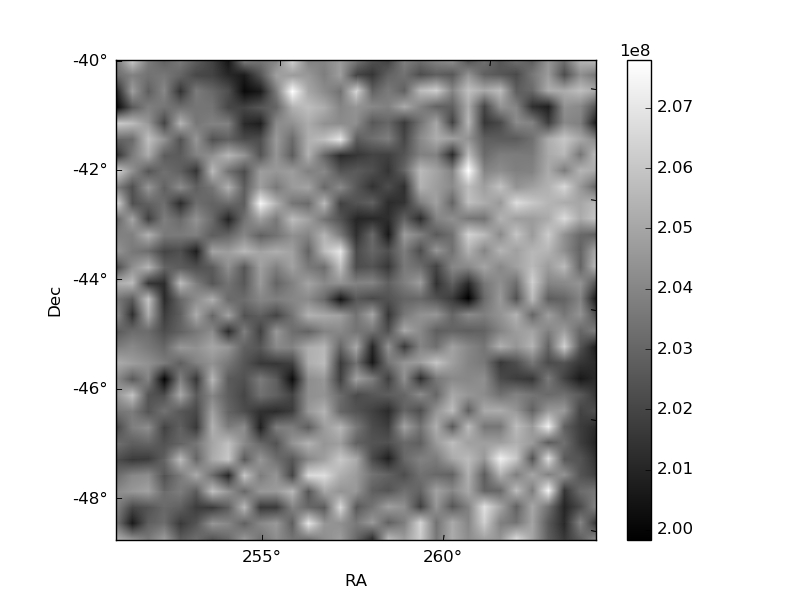
Histogram calculated using DETX and DETY for each event in the final _common_clean file
| Quadrant A | 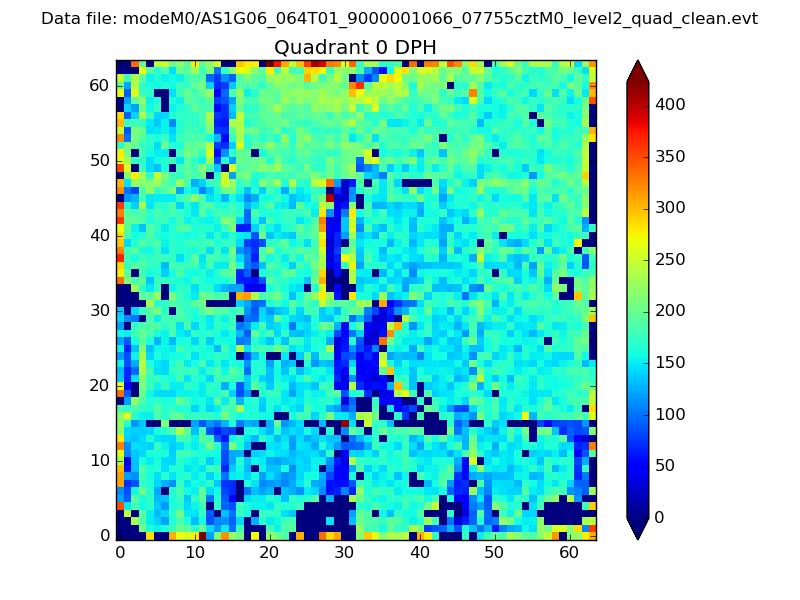 |
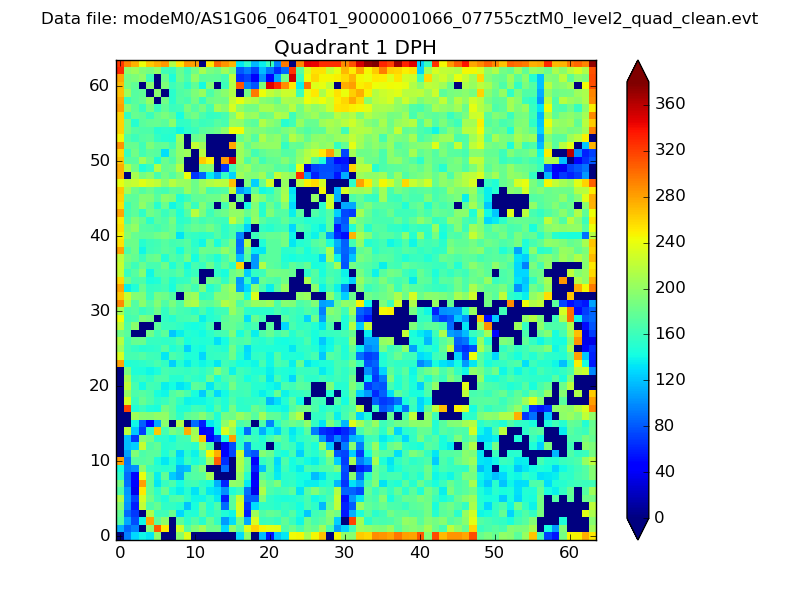 |
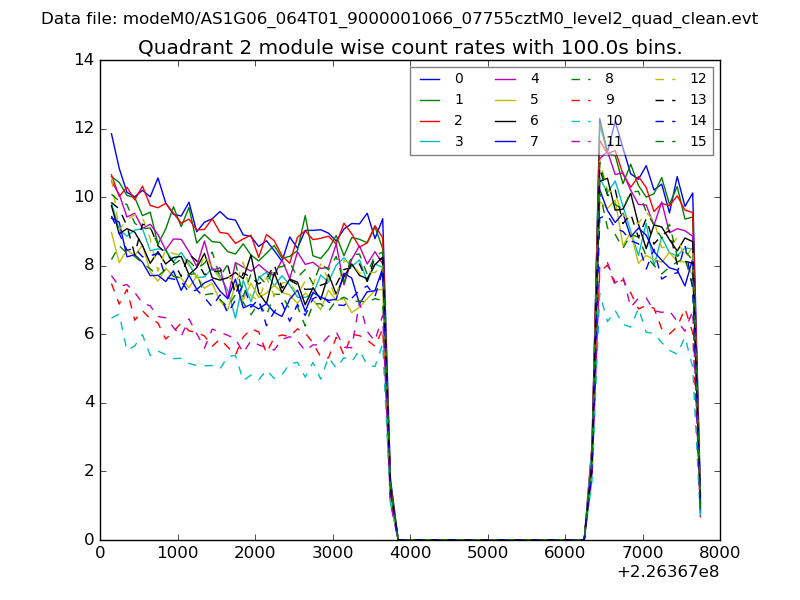
Quadrant B |
|---|---|---|---|
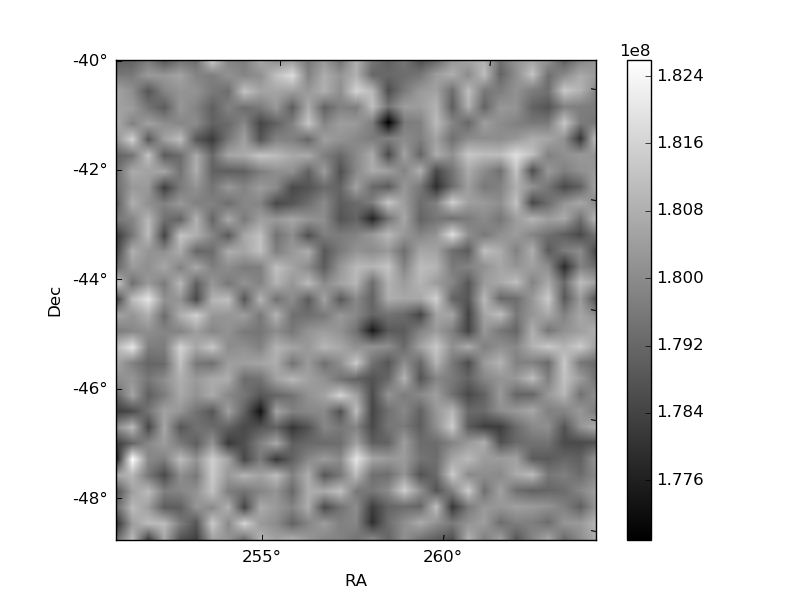
| Quadrant D | 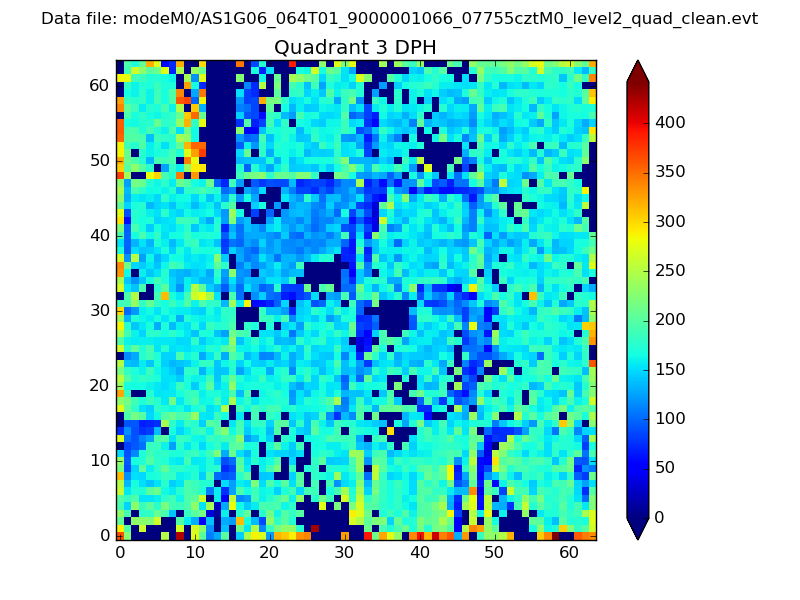 |
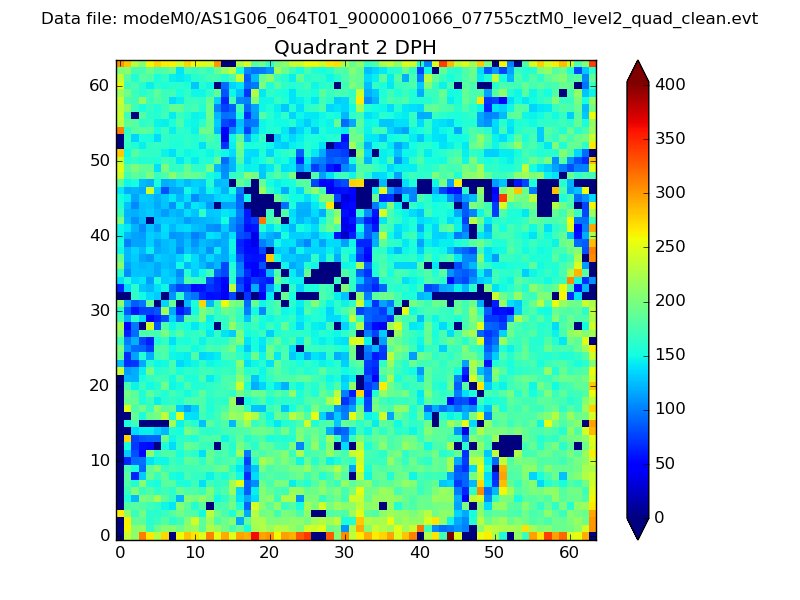 |
Quadrant C |
| Plot type | Count rate plots | Images |
|---|---|---|
| Comparison with Poisson distribution Blue bars denote a histogram of data divided into 1 sec bins. Red curve is a Poisson curve with rate = median count rate of data. |
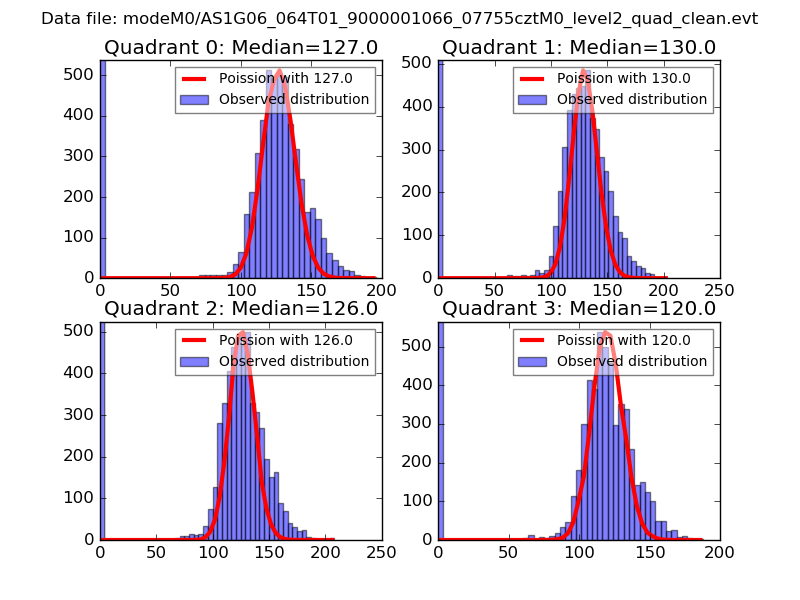 |
 |
| Quadrant-wise count rates Data is divided into 100 sec bins |
 |
|
| Module-wise count rates for Quadrant A Data is divided into 100 sec bins |
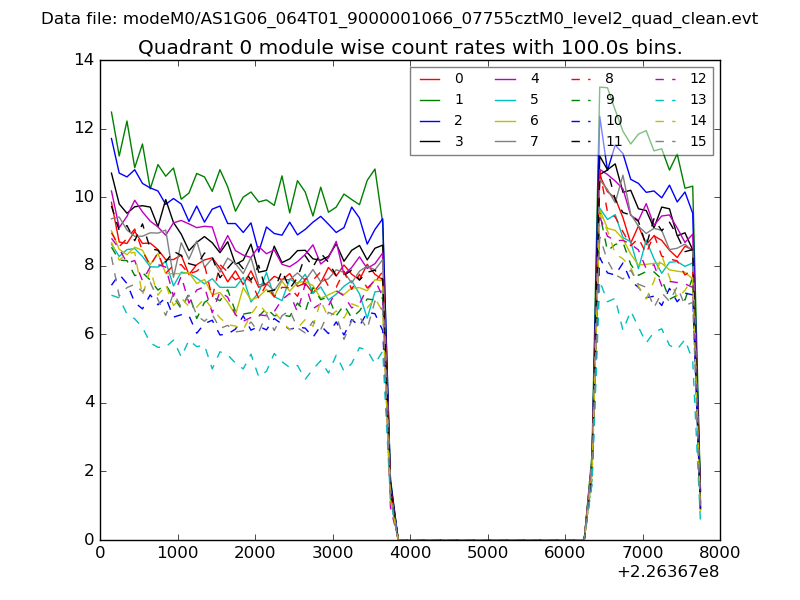 |
 |
| Module-wise count rates for Quadrant B Data is divided into 100 sec bins |
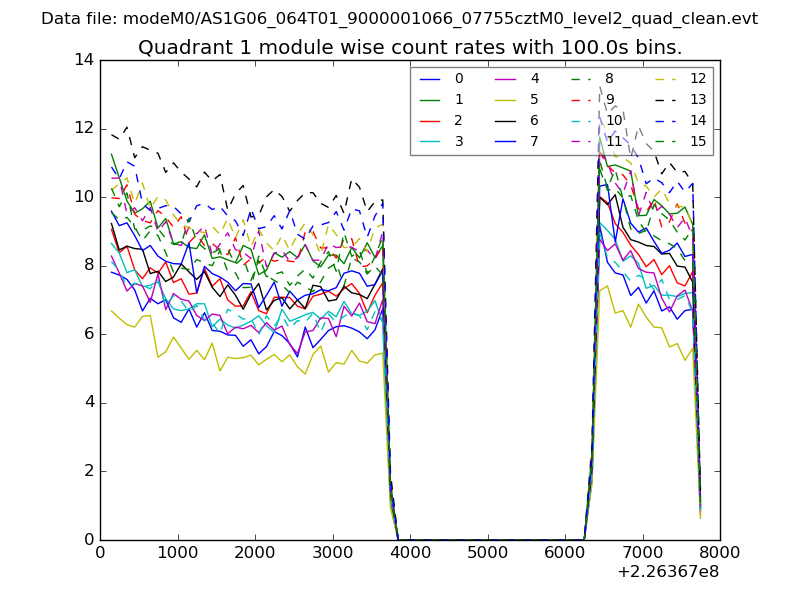 |
 |
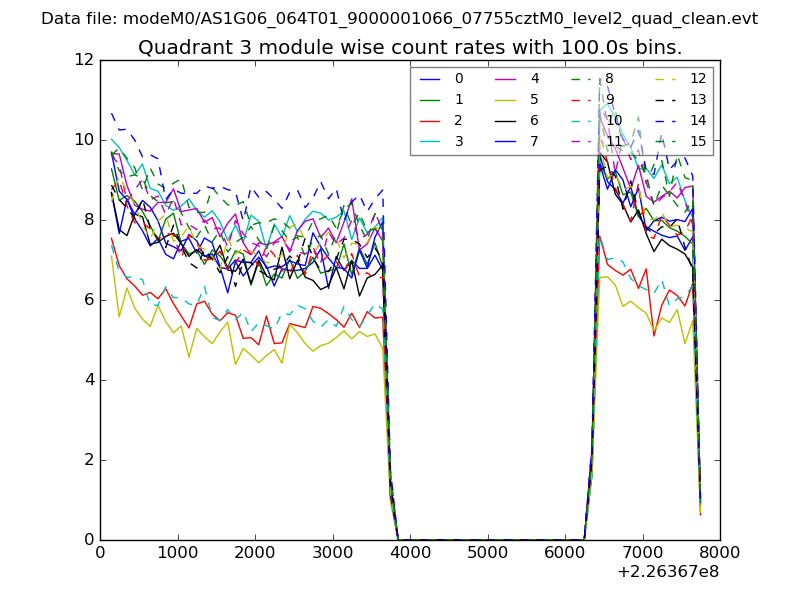
| Module-wise count rates for Quadrant C Data is divided into 100 sec bins |
 |
 |
| Module-wise count rates for Quadrant D Data is divided into 100 sec bins |
 |
 |
| Parameter | Plot |
|---|---|
| CZT HV Monitor | 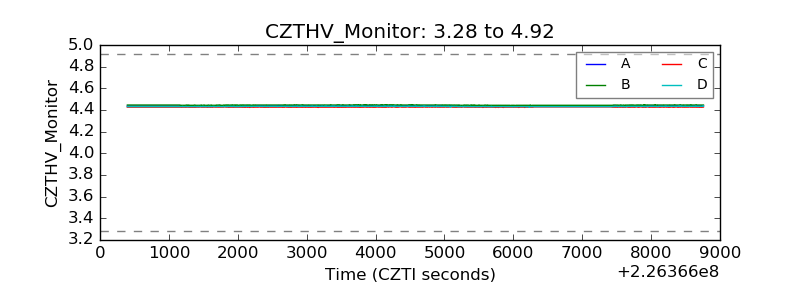 |
| D_VDD | 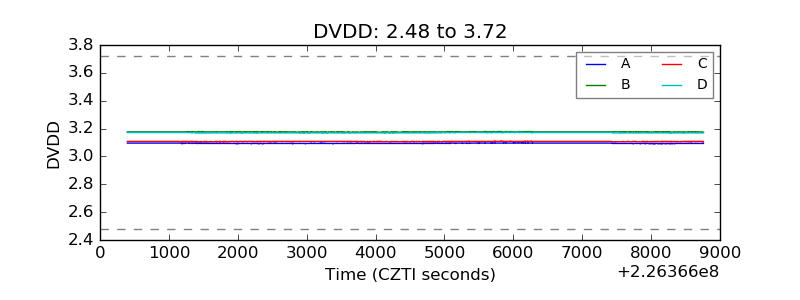 |
| Temperature 1 |  |
| Veto HV Monitor | 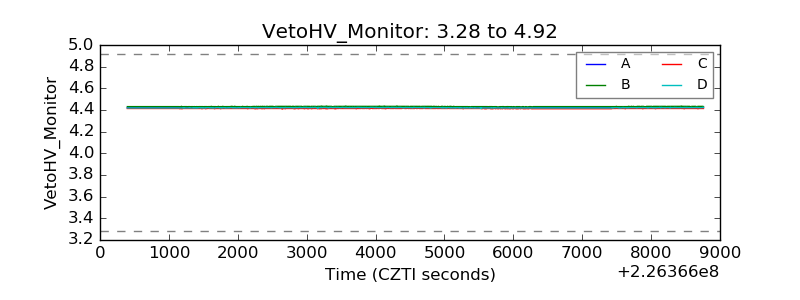 |
| Veto LLD | 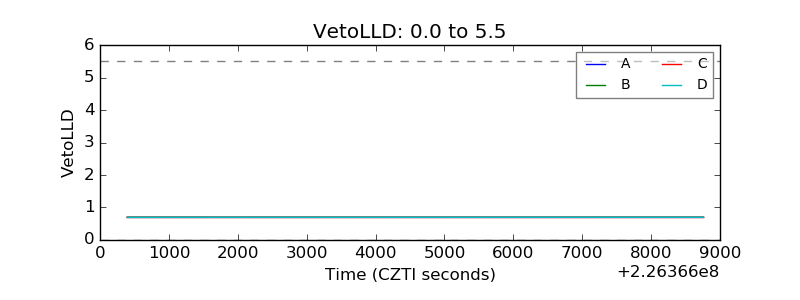 |
| Alpha Counter | 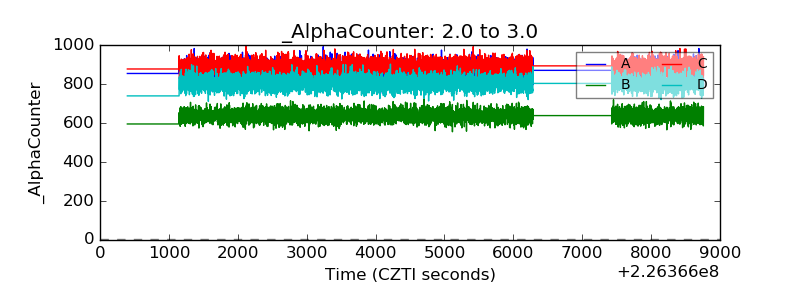 |
| _CPM_Rate | 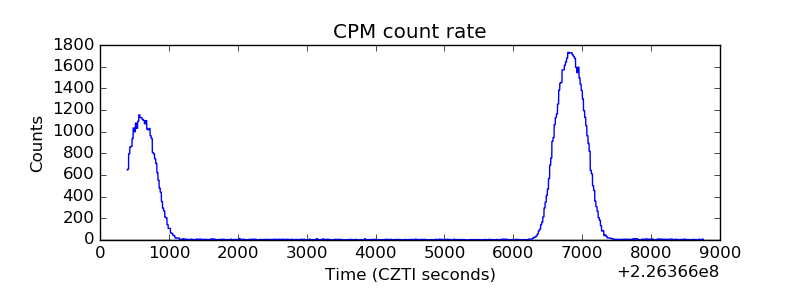 |
| CZT Counter | 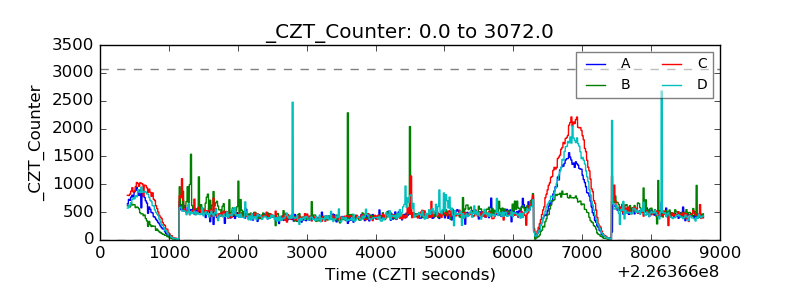 |
| +2.5 Volts monitor |  |
| +5 Volts monitor |  |
| _ROLL_ROT | 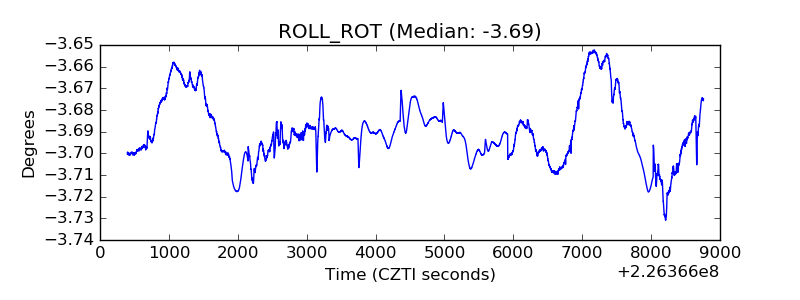 |
| _Roll_DEC | 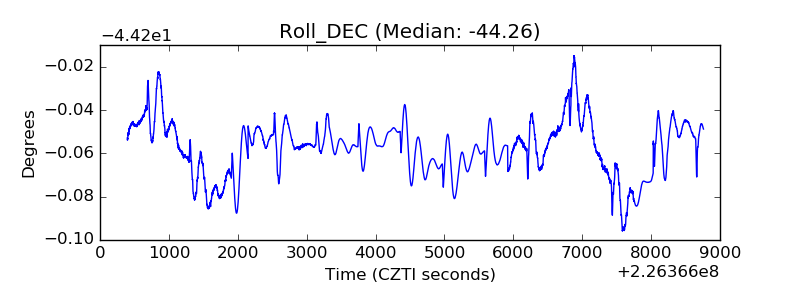 |
| _Roll_RA |  |
| Veto Counter | 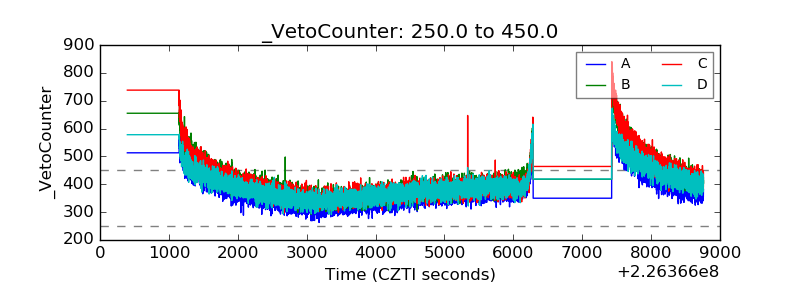 |