| Param | Original file | Final file |
|---|---|---|
| Filename | modeM0/AS1G06_064T01_9000001066_07756cztM0_level2.evt | modeM0/AS1G06_064T01_9000001066_07756cztM0_level2_quad_clean.evt |
| Size (bytes) | 440,910,720 | 101,977,920 |
| Size | 420.5 MB | 97.3 MB |
| Events in quadrant A | 3,126,305 | 656,232 |
| Events in quadrant B | 3,310,772 | 676,634 |
| Events in quadrant C | 3,180,157 | 662,918 |
| Events in quadrant D | 3,279,380 | 624,742 |
| Mode SS | |||
|---|---|---|---|
| Quadrant | BADHDUFLAG | Total packets | Discarded packets |
| A | 0 | 136 | 0 |
| B | 0 | 136 | 0 |
| C | 0 | 136 | 0 |
| D | 0 | 136 | 0 |
| Mode M0 | |||
|---|---|---|---|
| Quadrant | BADHDUFLAG | Total packets | Discarded packets |
| A | 0 | 13756 | 3 |
| B | 0 | 14174 | 2 |
| C | 0 | 13836 | 2 |
| D | 0 | 14360 | 2 |
| Mode M9 | |||
|---|---|---|---|
| Quadrant | BADHDUFLAG | Total packets | Discarded packets |
| A | 0 | 20 | 0 |
| B | 0 | 20 | 0 |
| C | 0 | 20 | 0 |
| D | 0 | 21 | 0 |
| Quadrant | Total seconds | Saturated seconds | Saturation percentage |
|---|---|---|---|
| A | 6713 | 28 | 0.417101% |
| B | 6713 | 39 | 0.580962% |
| C | 6713 | 36 | 0.536273% |
| D | 6713 | 66 | 0.983167% |
Noise dominated data is calculated using 1-second bins in cleaned event files. If a bin has >2000 counts, and if more than 50% of those come from <1% of pixels, then it is considered to be noise-dominated and hence unusable.
| Quadrant | # 1 sec bins | Bins with >0 counts | Bins with >2000 counts | High rate bins dominated by noise | Noise dominated (total time) | Noise dominated (detector-on time) | Marked lightcurve |
|---|---|---|---|---|---|---|---|
| A | 7913 | 6714 | 0 | 0 | 0.00% | 0.00% | 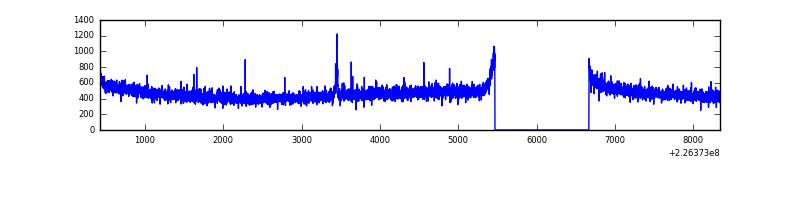 |
| B | 7913 | 6713 | 1 | 1 | 0.01% | 0.01% | 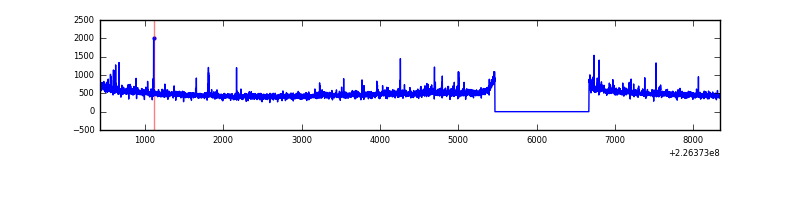 |
| C | 7913 | 6713 | 1 | 1 | 0.01% | 0.01% | 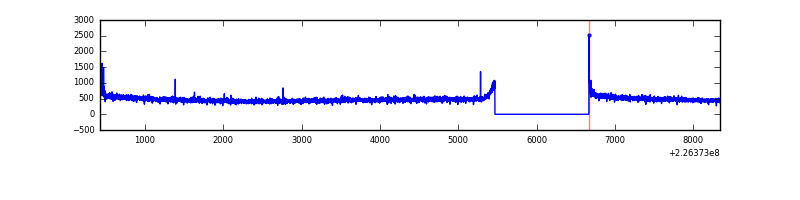 |
| D | 7913 | 6713 | 31 | 31 | 0.39% | 0.46% | 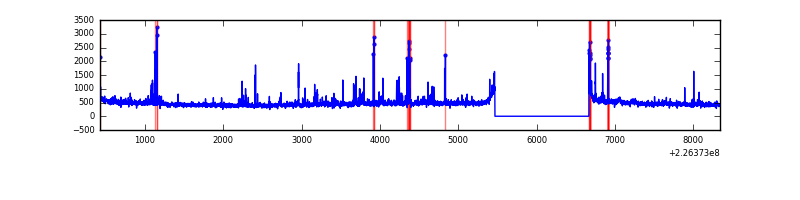 |
Top three noisy pixels from each quadrant. If the there are fewer than three noisy pixels in the level2.evt file, extra rows are filled as -1
| Pixel properties | Quadrant properties | ||||||
|---|---|---|---|---|---|---|---|
| Quadrant | DetID | PixID | Counts | Sigma | Mean | Median | Sigma |
| A | 4 | 208 | 11400 | 64.1 | 808 | 792 | 165.5 |
| A | 0 | 226 | 7510 | 40.6 | 808 | 792 | 165.5 |
| A | 12 | 194 | 7061 | 37.88 | 808 | 792 | 165.5 |
| B | 4 | 173 | 49256 | 312.13 | 823 | 805 | 155.2 |
| B | 0 | 214 | 15325 | 93.54 | 823 | 805 | 155.2 |
| B | 12 | 111 | 14772 | 89.98 | 823 | 805 | 155.2 |
| C | 12 | 4 | 19140 | 98.55 | 807 | 812 | 186.0 |
| C | 1 | 16 | 8981 | 43.92 | 807 | 812 | 186.0 |
| C | 13 | 61 | 6168 | 28.8 | 807 | 812 | 186.0 |
| D | 1 | 52 | 80988 | 413.85 | 794 | 771 | 193.8 |
| D | 12 | 221 | 80445 | 411.05 | 794 | 771 | 193.8 |
| D | 2 | 14 | 38332 | 193.78 | 794 | 771 | 193.8 |
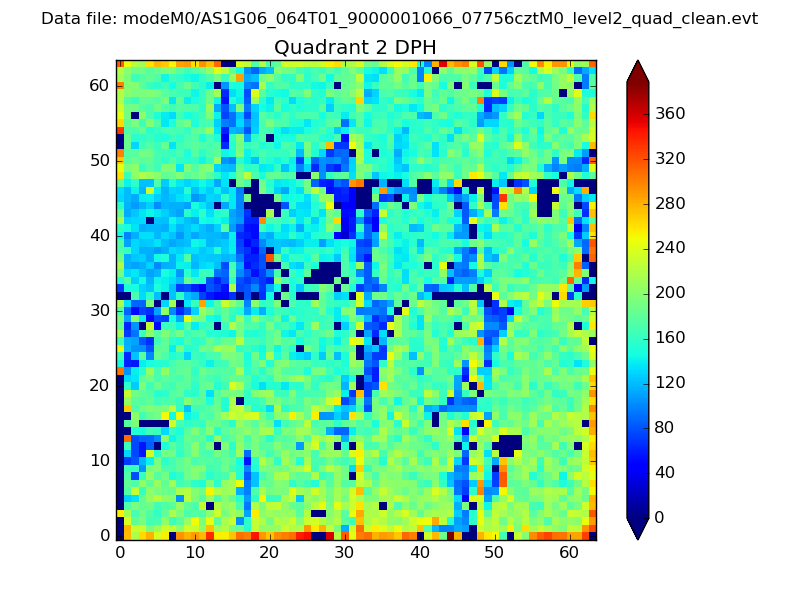
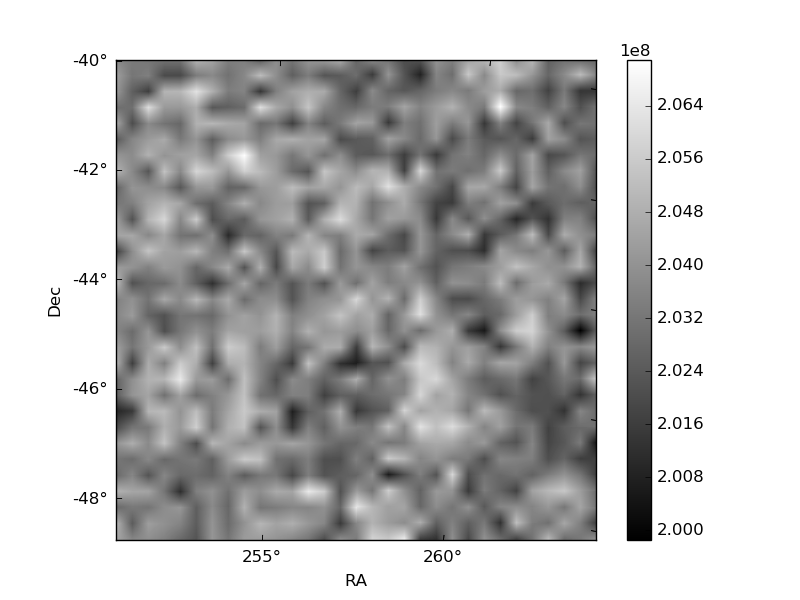
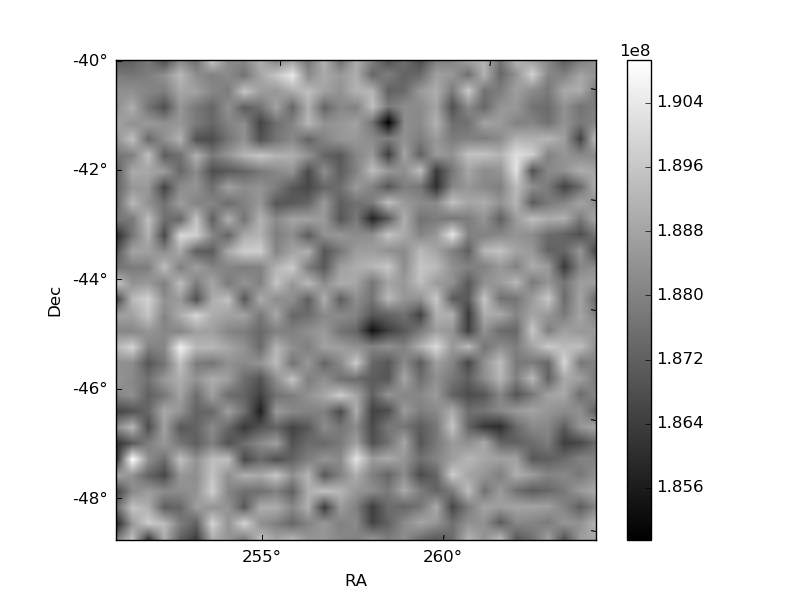
Histogram calculated using DETX and DETY for each event in the final _common_clean file
| Quadrant A | 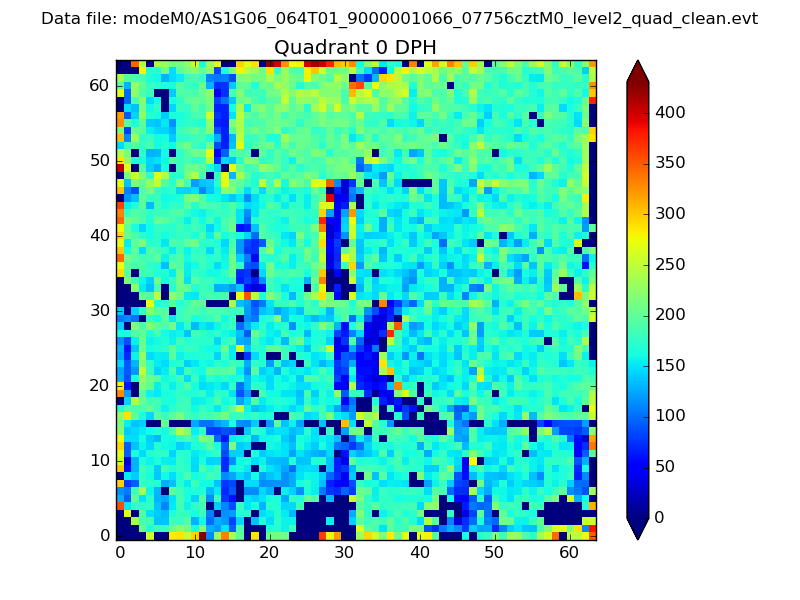 |
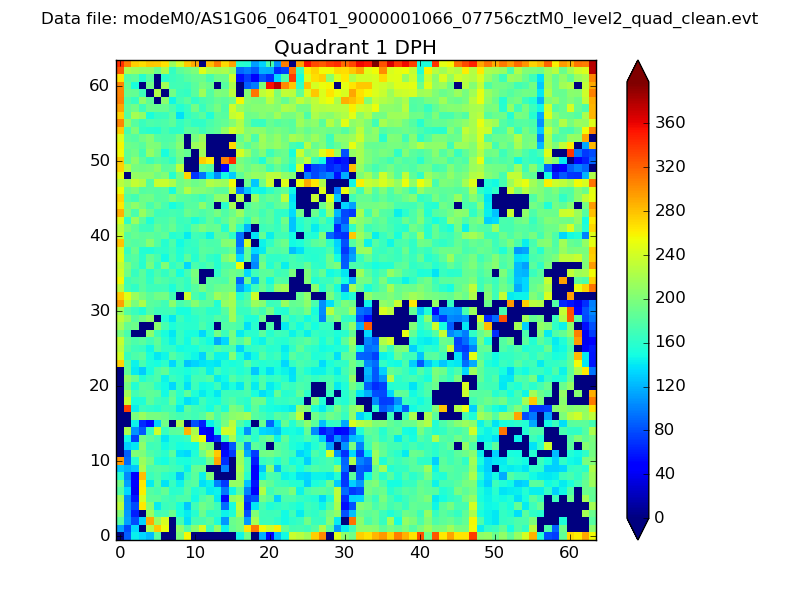 |
Quadrant B |
|---|---|---|---|
| Quadrant D | 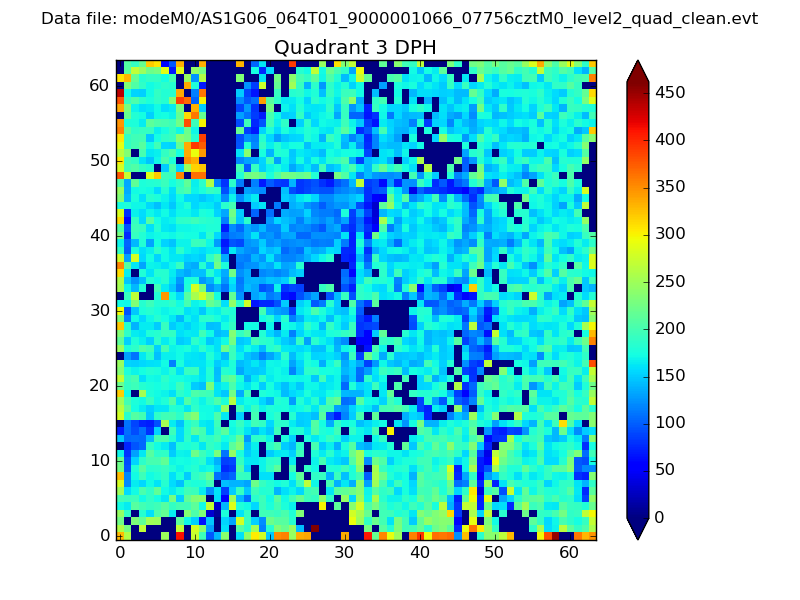 |
 |
Quadrant C |
| Plot type | Count rate plots | Images |
|---|---|---|
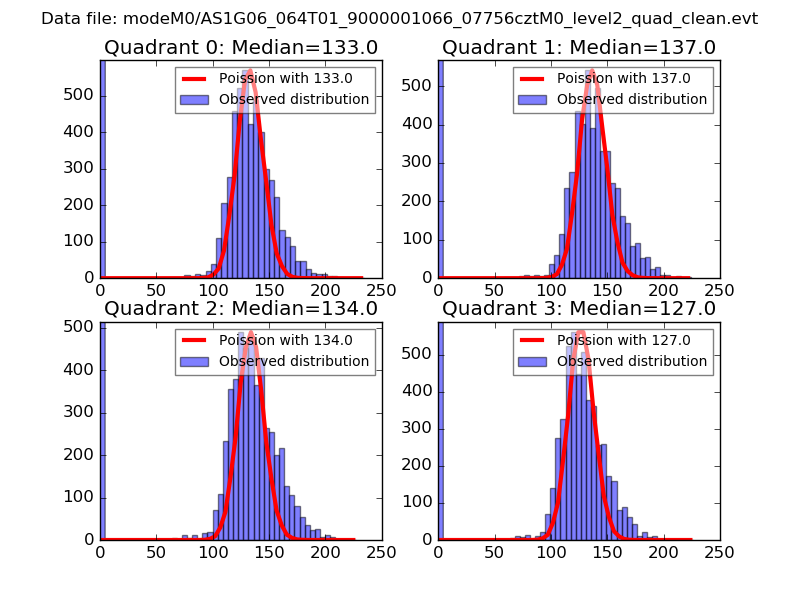
| Comparison with Poisson distribution Blue bars denote a histogram of data divided into 1 sec bins. Red curve is a Poisson curve with rate = median count rate of data. |
 |
 |
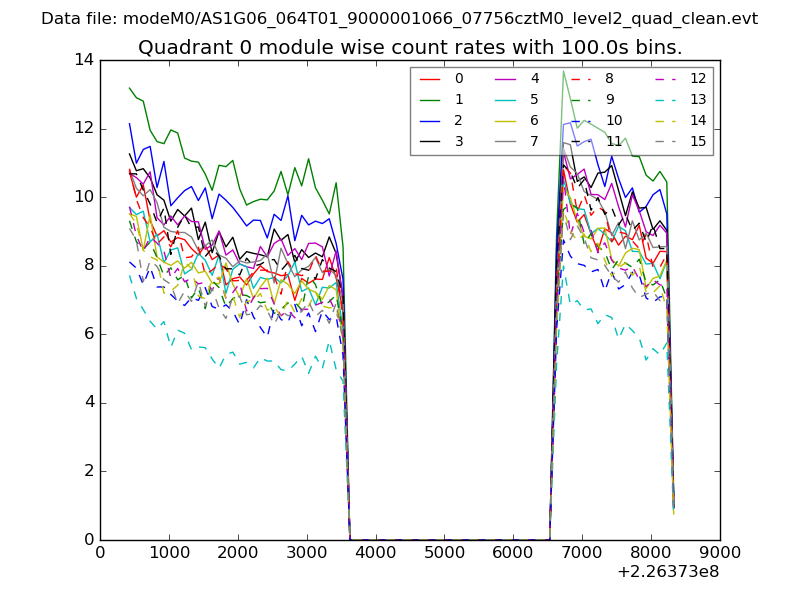
| Quadrant-wise count rates Data is divided into 100 sec bins |
 |
|
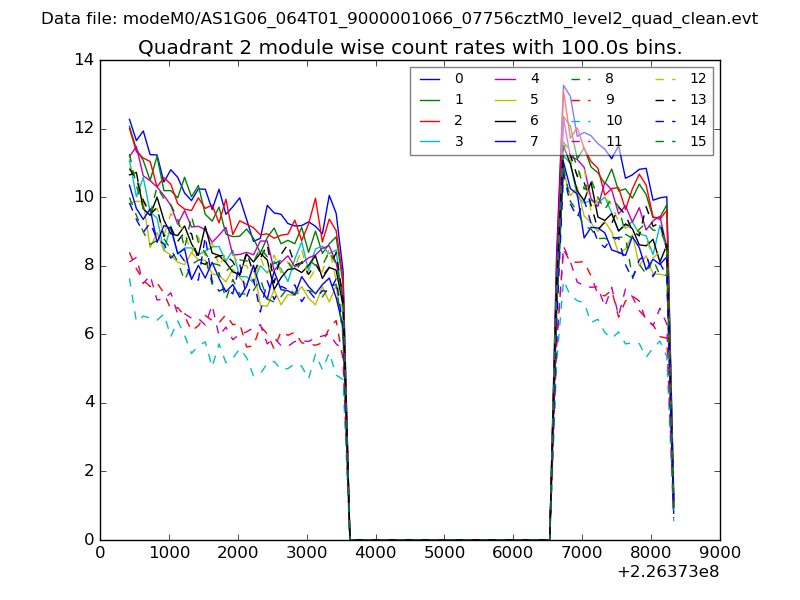
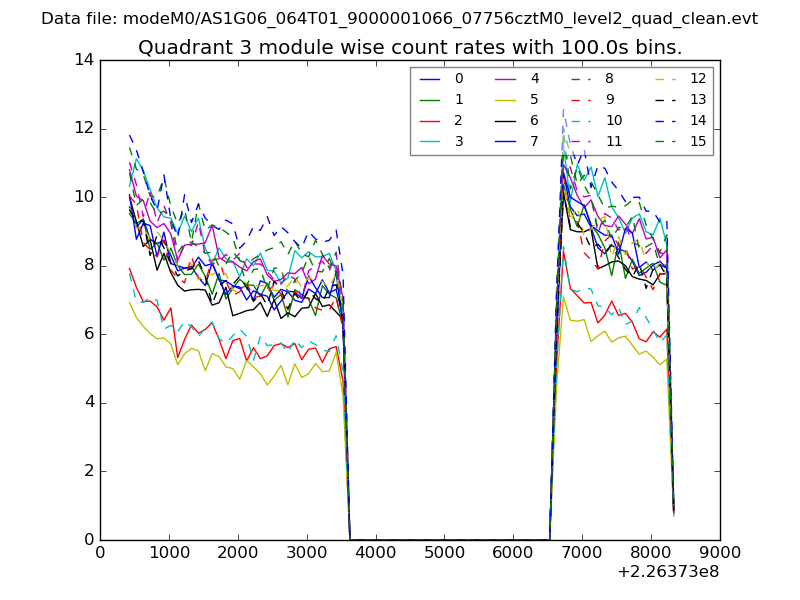
| Module-wise count rates for Quadrant A Data is divided into 100 sec bins |
 |
 |
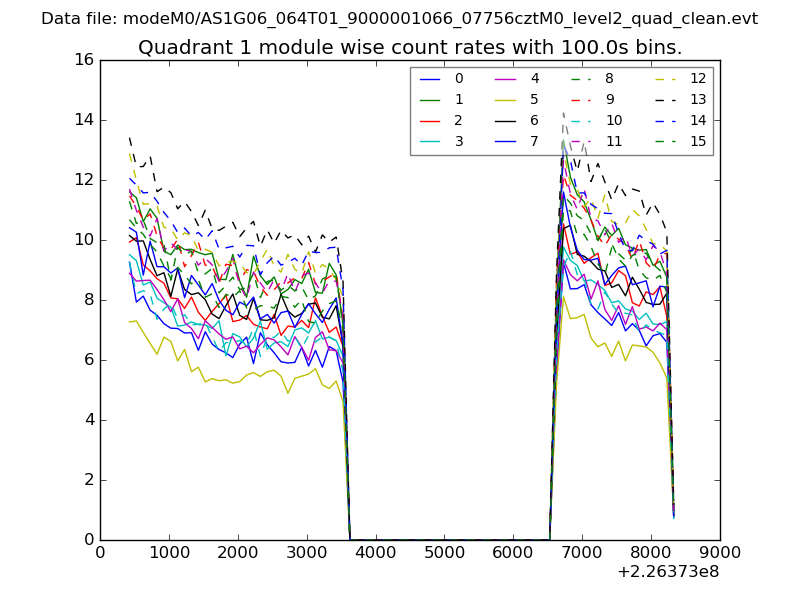
| Module-wise count rates for Quadrant B Data is divided into 100 sec bins |
 |
 |
| Module-wise count rates for Quadrant C Data is divided into 100 sec bins |
 |
 |
| Module-wise count rates for Quadrant D Data is divided into 100 sec bins |
 |
 |
| Parameter | Plot |
|---|---|
| CZT HV Monitor | 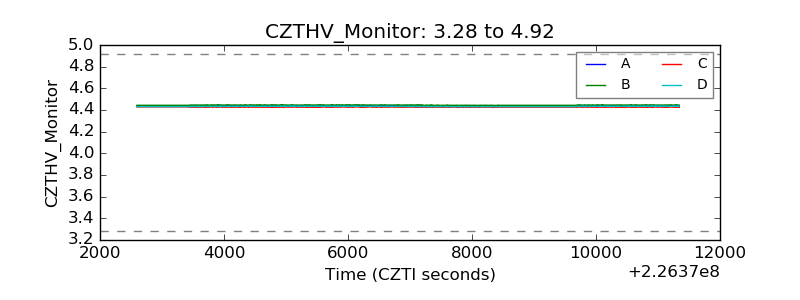 |
| D_VDD | 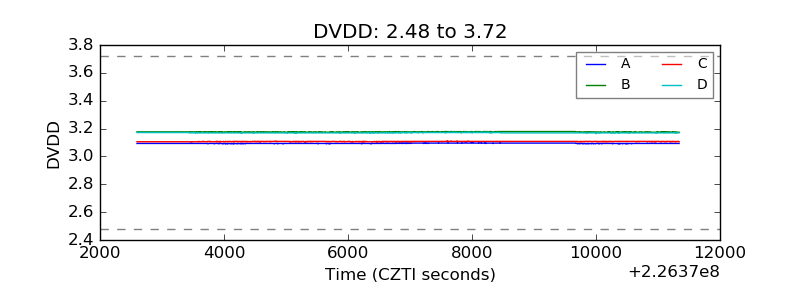 |
| Temperature 1 | 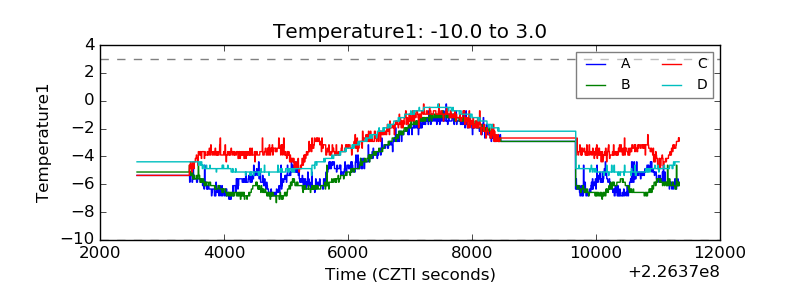 |
| Veto HV Monitor |  |
| Veto LLD | 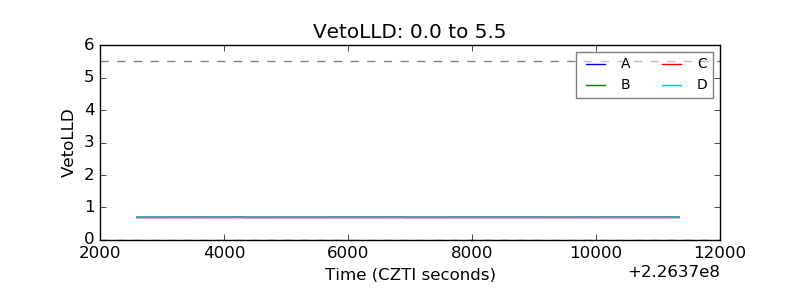 |
| Alpha Counter | 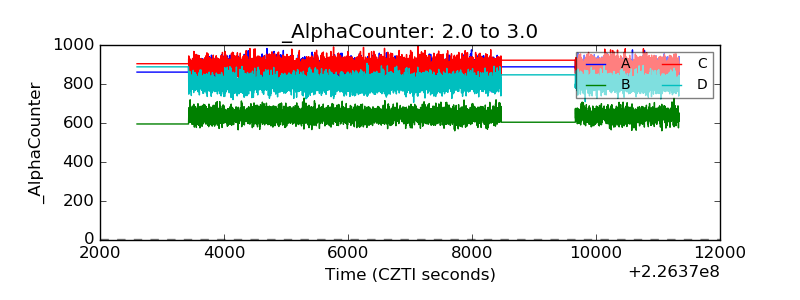 |
| _CPM_Rate | 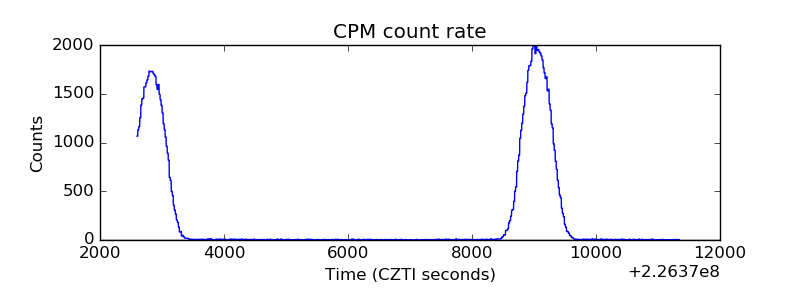 |
| CZT Counter | 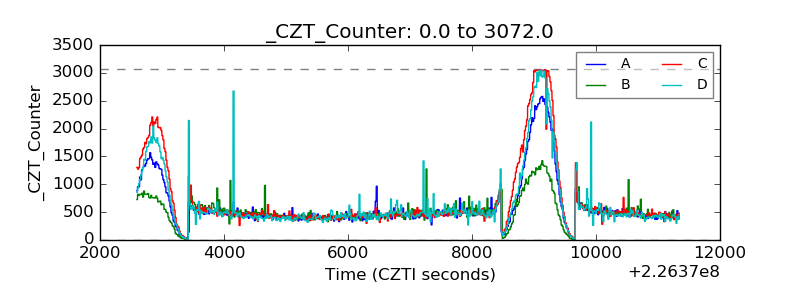 |
| +2.5 Volts monitor |  |
| +5 Volts monitor |  |
| _ROLL_ROT | 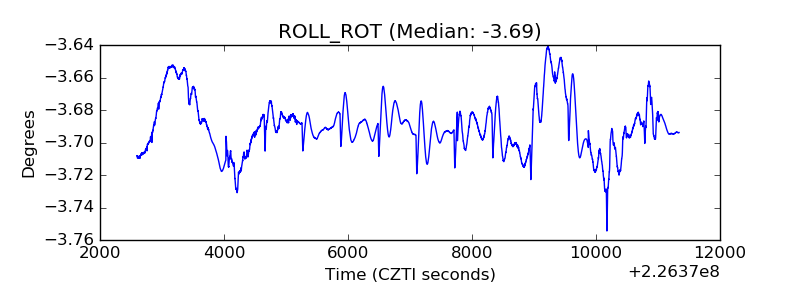 |
| _Roll_DEC | 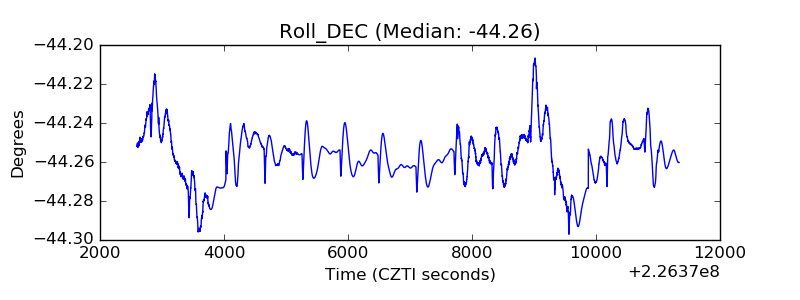 |
| _Roll_RA |  |
| Veto Counter | 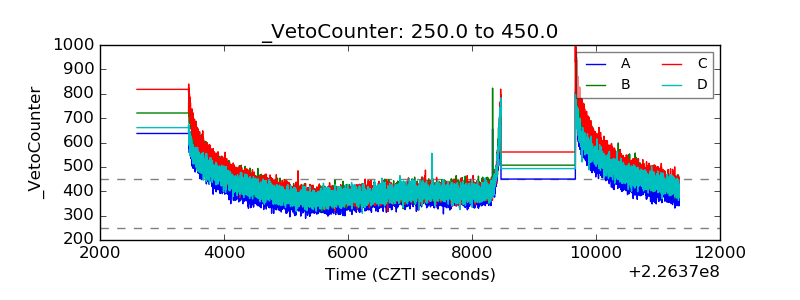 |