| Param | Original file | Final file |
|---|---|---|
| Filename | modeM0/AS1G06_064T01_9000001066_07759cztM0_level2.evt | modeM0/AS1G06_064T01_9000001066_07759cztM0_level2_quad_clean.evt |
| Size (bytes) | 838,575,360 | 137,401,920 |
| Size | 799.7 MB | 131.0 MB |
| Events in quadrant A | 4,949,665 | 876,545 |
| Events in quadrant B | 5,536,071 | 886,630 |
| Events in quadrant C | 4,941,894 | 879,139 |
| Events in quadrant D | 9,261,438 | 795,154 |
| Mode SS | |||
|---|---|---|---|
| Quadrant | BADHDUFLAG | Total packets | Discarded packets |
| A | 0 | 214 | 0 |
| B | 0 | 214 | 0 |
| C | 0 | 214 | 0 |
| D | 0 | 214 | 0 |
| Mode M0 | |||
|---|---|---|---|
| Quadrant | BADHDUFLAG | Total packets | Discarded packets |
| A | 0 | 21464 | 3 |
| B | 0 | 22936 | 2 |
| C | 0 | 21488 | 2 |
| D | 0 | 34470 | 2 |
| Mode M9 | |||
|---|---|---|---|
| Quadrant | BADHDUFLAG | Total packets | Discarded packets |
| A | 0 | 24 | 0 |
| B | 0 | 24 | 0 |
| C | 0 | 24 | 0 |
| D | 0 | 24 | 0 |
| Quadrant | Total seconds | Saturated seconds | Saturation percentage |
|---|---|---|---|
| A | 10444 | 94 | 0.900038% |
| B | 10444 | 244 | 2.336270% |
| C | 10444 | 58 | 0.555343% |
| D | 10444 | 1747 | 16.727308% |
Noise dominated data is calculated using 1-second bins in cleaned event files. If a bin has >2000 counts, and if more than 50% of those come from <1% of pixels, then it is considered to be noise-dominated and hence unusable.
| Quadrant | # 1 sec bins | Bins with >0 counts | Bins with >2000 counts | High rate bins dominated by noise | Noise dominated (total time) | Noise dominated (detector-on time) | Marked lightcurve |
|---|---|---|---|---|---|---|---|
| A | 12939 | 10446 | 0 | 0 | 0.00% | 0.00% | 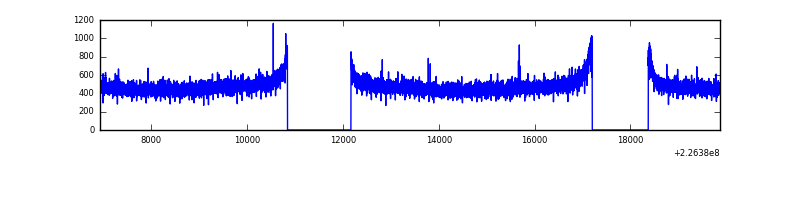 |
| B | 12939 | 10446 | 88 | 88 | 0.68% | 0.84% | 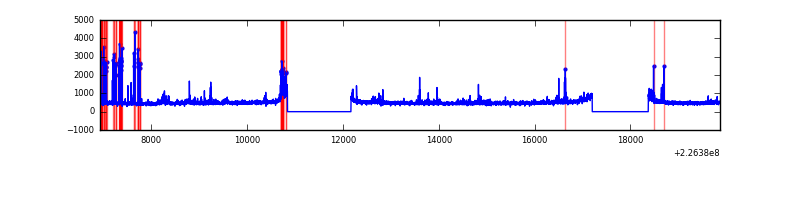 |
| C | 12939 | 10445 | 0 | 0 | 0.00% | 0.00% | 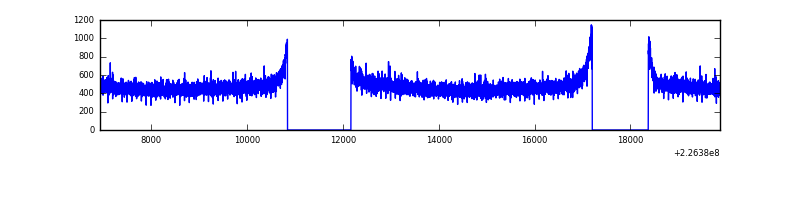 |
| D | 12939 | 10445 | 1583 | 1583 | 12.23% | 15.16% | 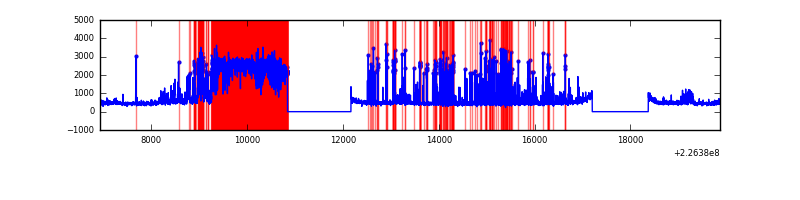 |
Top three noisy pixels from each quadrant. If the there are fewer than three noisy pixels in the level2.evt file, extra rows are filled as -1
| Pixel properties | Quadrant properties | ||||||
|---|---|---|---|---|---|---|---|
| Quadrant | DetID | PixID | Counts | Sigma | Mean | Median | Sigma |
| A | 0 | 226 | 12471 | 43.13 | 1284 | 1256 | 260.0 |
| A | 12 | 194 | 11553 | 39.6 | 1284 | 1256 | 260.0 |
| A | 3 | 1 | 5635 | 16.84 | 1284 | 1256 | 260.0 |
| B | 4 | 173 | 267430 | 1112.38 | 1280 | 1253 | 239.3 |
| B | 4 | 81 | 164620 | 682.73 | 1280 | 1253 | 239.3 |
| B | 0 | 214 | 42802 | 173.64 | 1280 | 1253 | 239.3 |
| C | 13 | 61 | 9800 | 29.56 | 1263 | 1271 | 288.6 |
| C | 8 | 222 | 5772 | 15.6 | 1263 | 1271 | 288.6 |
| C | 12 | 4 | 4354 | 10.68 | 1263 | 1271 | 288.6 |
| D | 12 | 221 | 4444463 | 15486.19 | 1180 | 1146 | 286.9 |
| D | 2 | 152 | 145468 | 503.0 | 1180 | 1146 | 286.9 |
| D | 13 | 104 | 85878 | 295.31 | 1180 | 1146 | 286.9 |
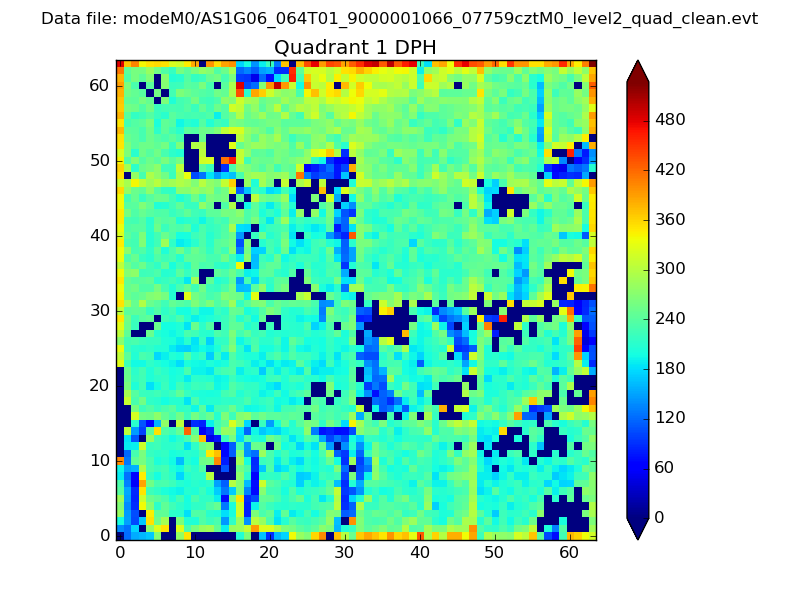
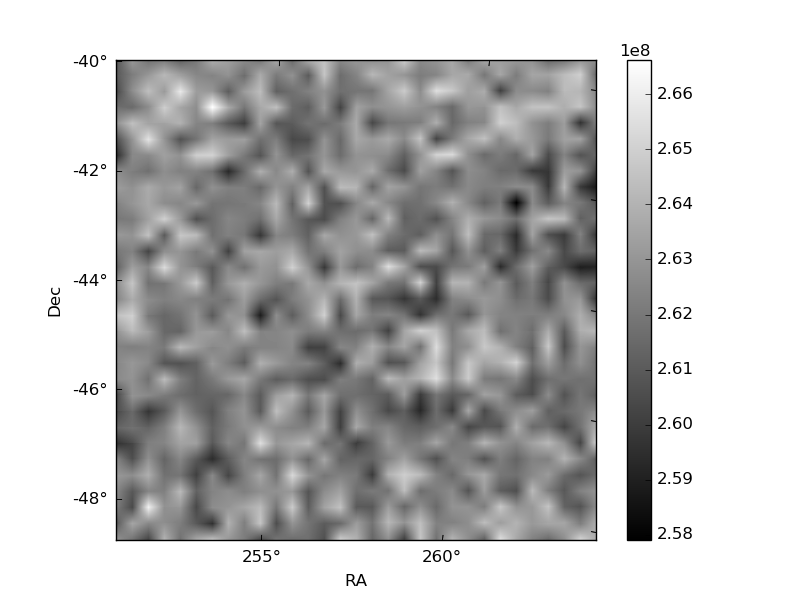
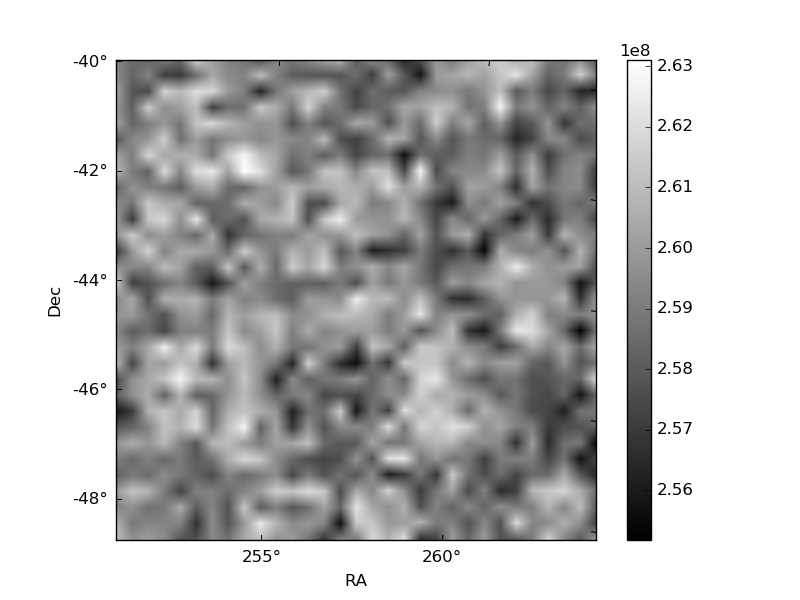
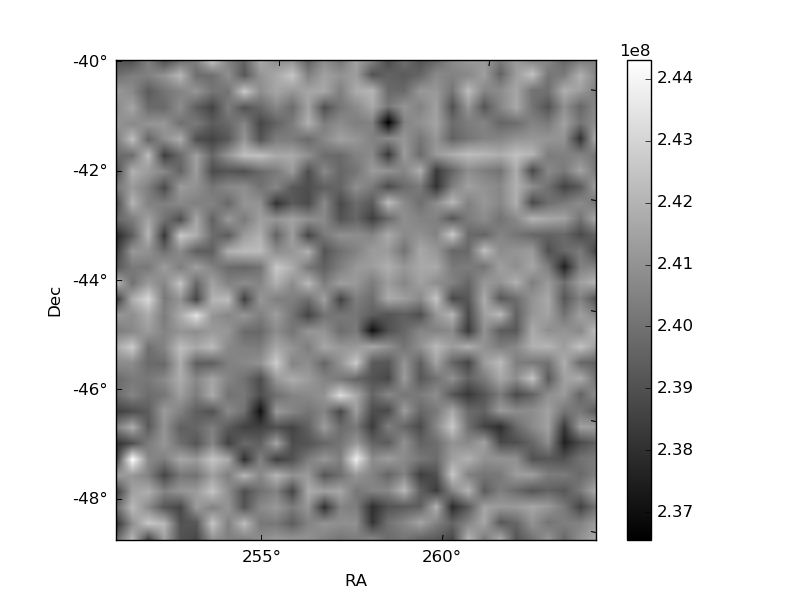
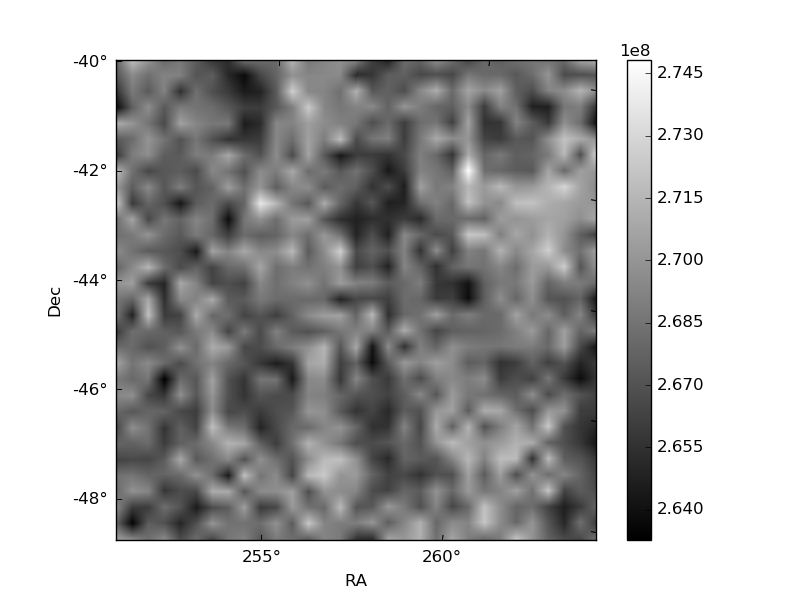
Histogram calculated using DETX and DETY for each event in the final _common_clean file
| Quadrant A |  |
 |
Quadrant B |
|---|---|---|---|
| Quadrant D | 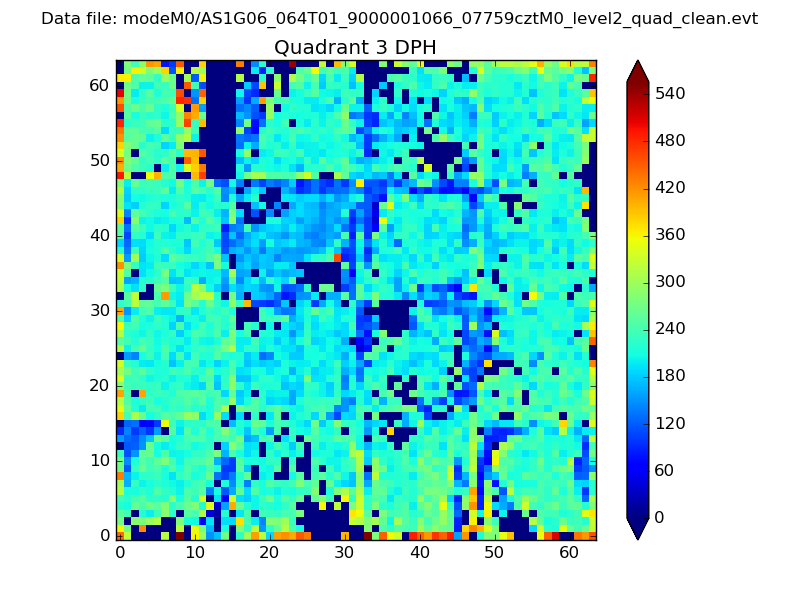 |
 |
Quadrant C |
| Plot type | Count rate plots | Images |
|---|---|---|
| Comparison with Poisson distribution Blue bars denote a histogram of data divided into 1 sec bins. Red curve is a Poisson curve with rate = median count rate of data. |
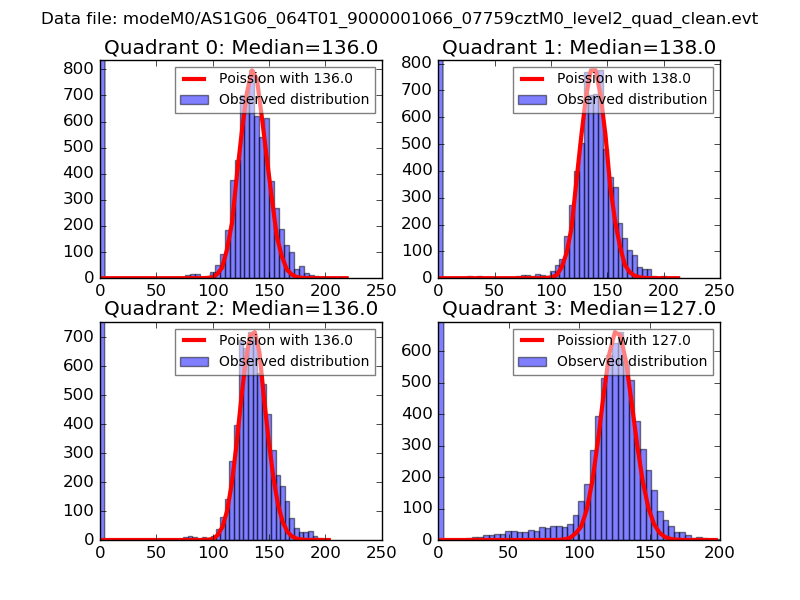 |
 |
| Quadrant-wise count rates Data is divided into 100 sec bins |
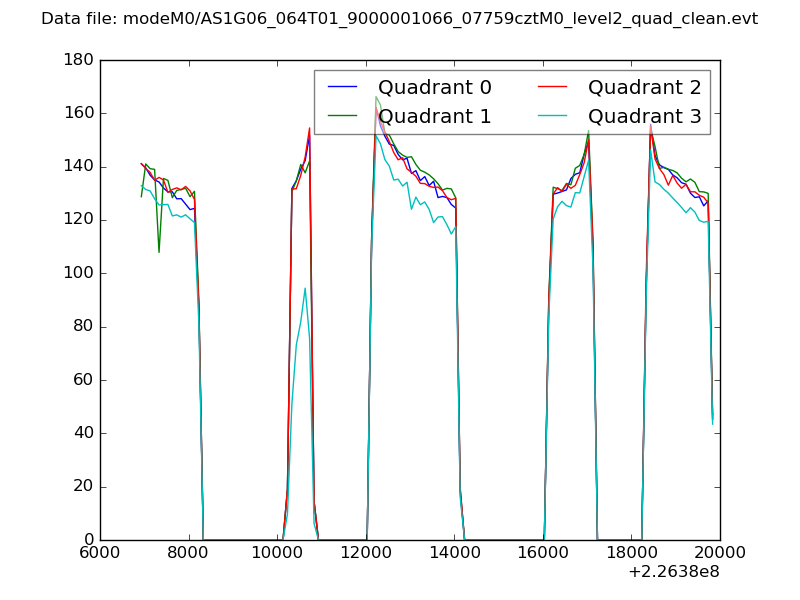 |
|
| Module-wise count rates for Quadrant A Data is divided into 100 sec bins |
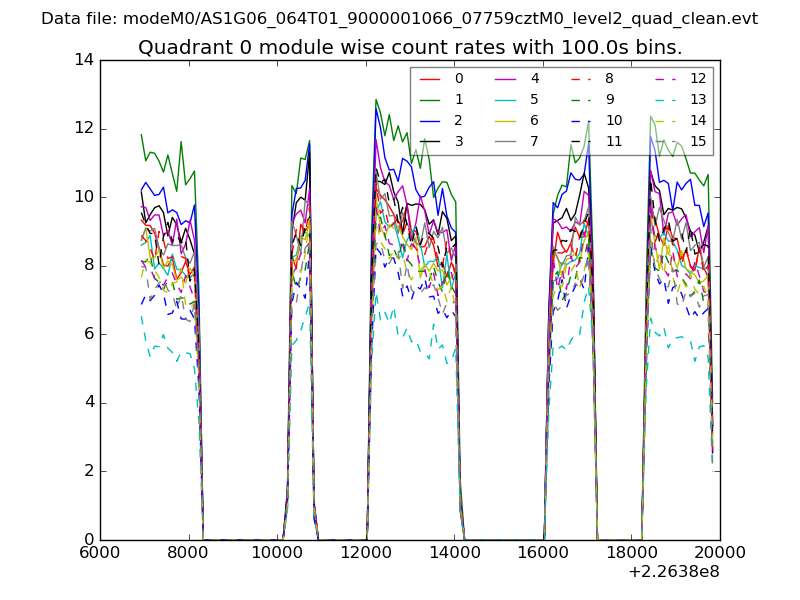 |
 |
| Module-wise count rates for Quadrant B Data is divided into 100 sec bins |
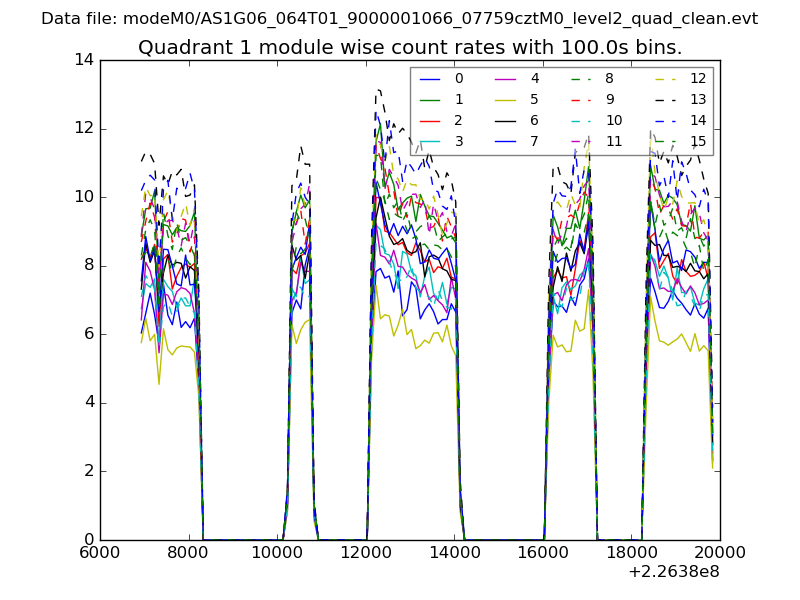 |
 |
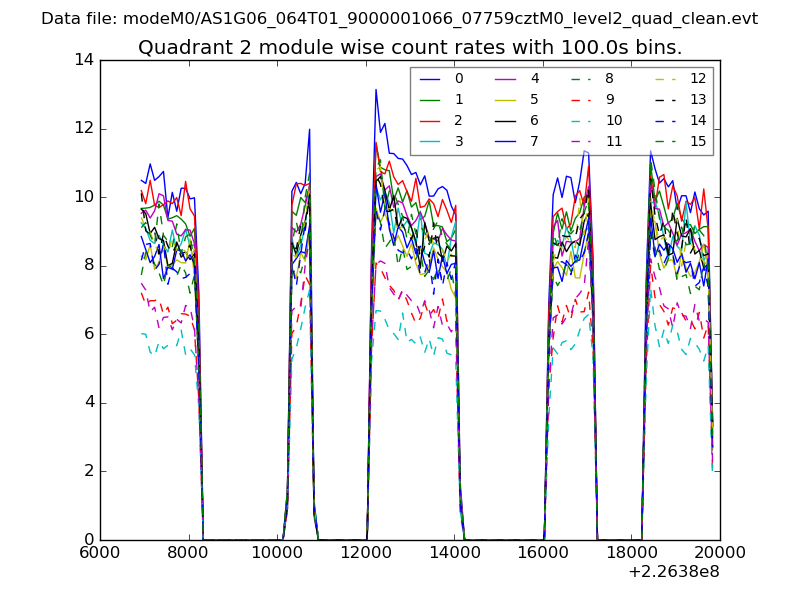
| Module-wise count rates for Quadrant C Data is divided into 100 sec bins |
 |
 |
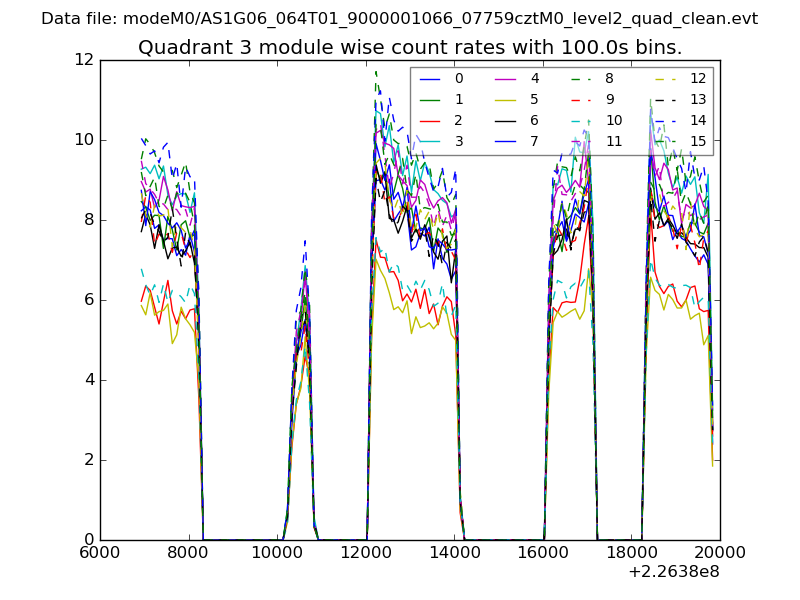
| Module-wise count rates for Quadrant D Data is divided into 100 sec bins |
 |
 |
| Parameter | Plot |
|---|---|
| CZT HV Monitor | 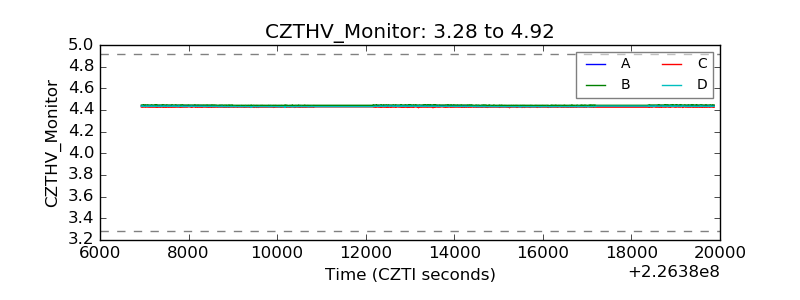 |
| D_VDD | 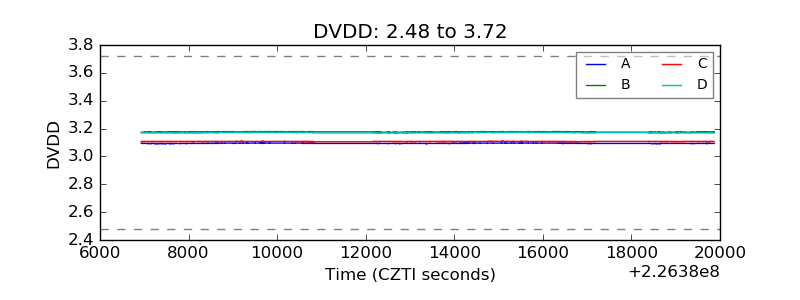 |
| Temperature 1 | 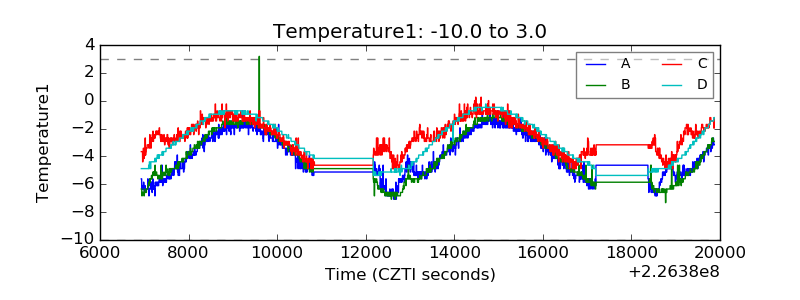 |
| Veto HV Monitor | 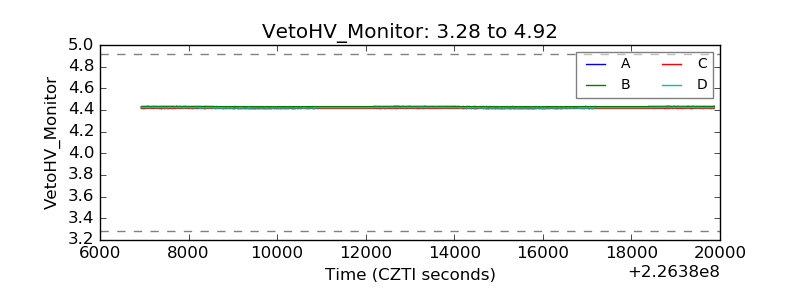 |
| Veto LLD | 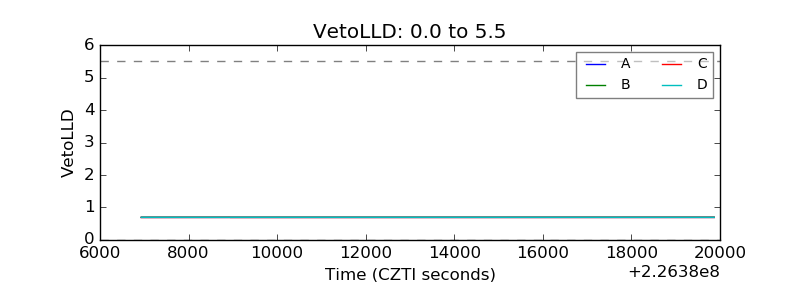 |
| Alpha Counter | 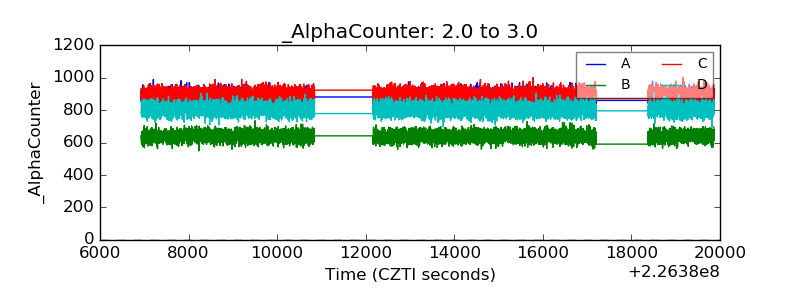 |
| _CPM_Rate | 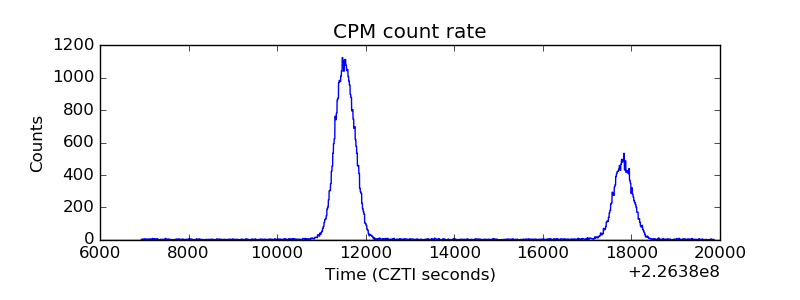 |
| CZT Counter | 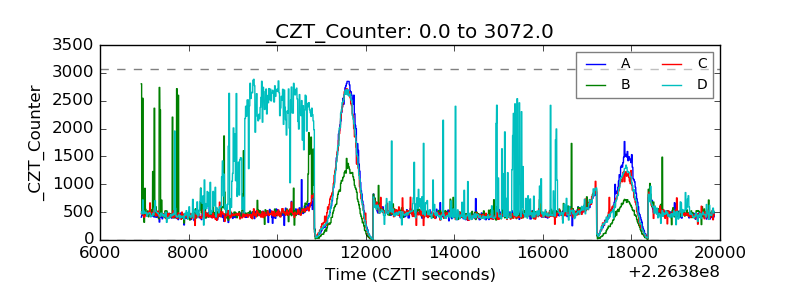 |
| +2.5 Volts monitor |  |
| +5 Volts monitor |  |
| _ROLL_ROT | 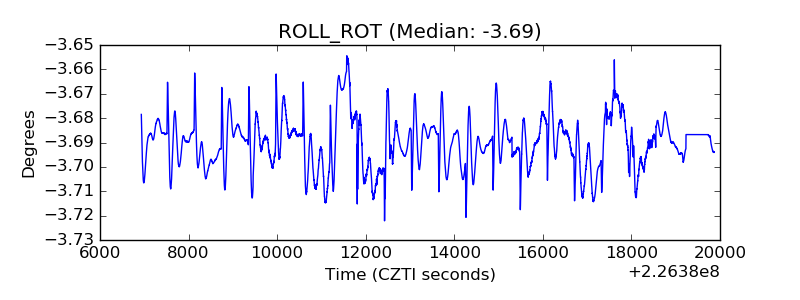 |
| _Roll_DEC | 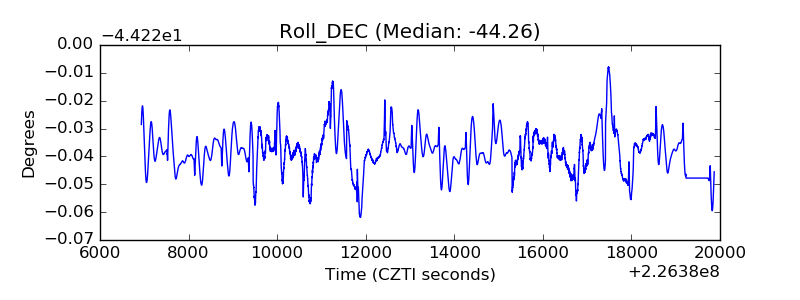 |
| _Roll_RA | 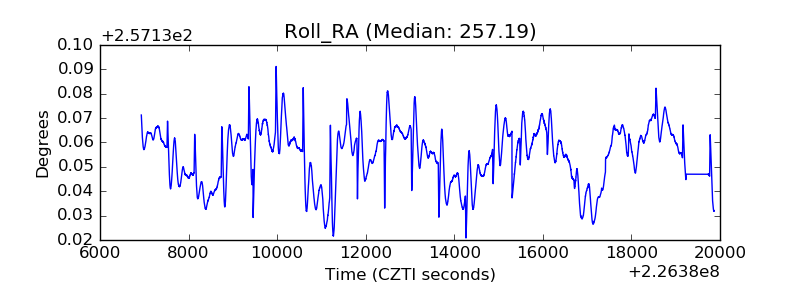 |
| Veto Counter | 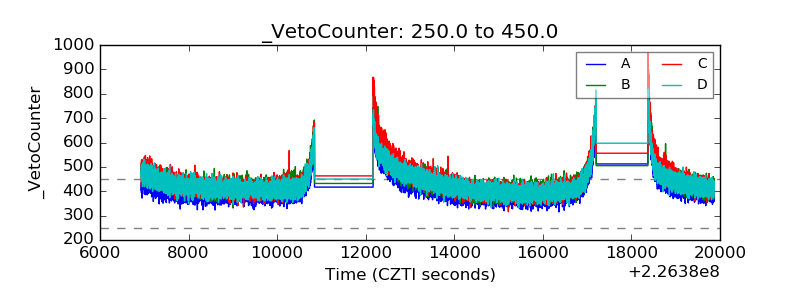 |