| Param | Original file | Final file |
|---|---|---|
| Filename | modeM0/AS1G06_064T01_9000001066_07760cztM0_level2.evt | modeM0/AS1G06_064T01_9000001066_07760cztM0_level2_quad_clean.evt |
| Size (bytes) | 195,082,560 | 26,807,040 |
| Size | 186.0 MB | 25.6 MB |
| Events in quadrant A | 1,387,416 | 147,402 |
| Events in quadrant B | 1,463,131 | 151,019 |
| Events in quadrant C | 1,361,633 | 147,522 |
| Events in quadrant D | 1,478,641 | 140,314 |
| Mode SS | |||
|---|---|---|---|
| Quadrant | BADHDUFLAG | Total packets | Discarded packets |
| A | 0 | 62 | 0 |
| B | 0 | 62 | 0 |
| C | 0 | 62 | 0 |
| D | 0 | 62 | 0 |
| Mode M0 | |||
|---|---|---|---|
| Quadrant | BADHDUFLAG | Total packets | Discarded packets |
| A | 0 | 6346 | 0 |
| B | 0 | 6439 | 0 |
| C | 0 | 6336 | 0 |
| D | 0 | 6669 | 0 |
| Quadrant | Total seconds | Saturated seconds | Saturation percentage |
|---|---|---|---|
| A | 3165 | 2 | 0.063191% |
| B | 3165 | 3 | 0.094787% |
| C | 3165 | 0 | 0.000000% |
| D | 3165 | 3 | 0.094787% |
Noise dominated data is calculated using 1-second bins in cleaned event files. If a bin has >2000 counts, and if more than 50% of those come from <1% of pixels, then it is considered to be noise-dominated and hence unusable.
| Quadrant | # 1 sec bins | Bins with >0 counts | Bins with >2000 counts | High rate bins dominated by noise | Noise dominated (total time) | Noise dominated (detector-on time) | Marked lightcurve |
|---|---|---|---|---|---|---|---|
| A | 3165 | 3165 | 0 | 0 | 0.00% | 0.00% | 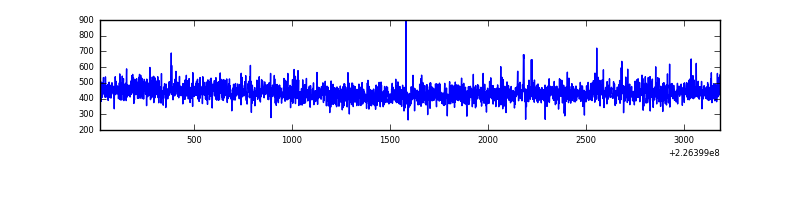 |
| B | 3165 | 3165 | 1 | 1 | 0.03% | 0.03% | 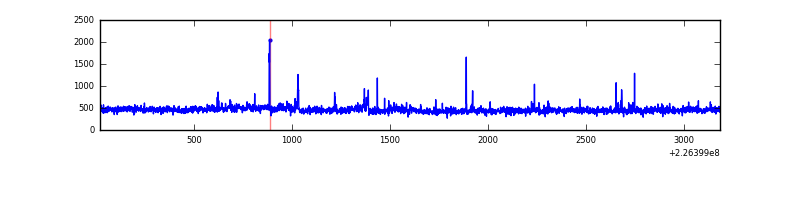 |
| C | 3165 | 3165 | 0 | 0 | 0.00% | 0.00% | 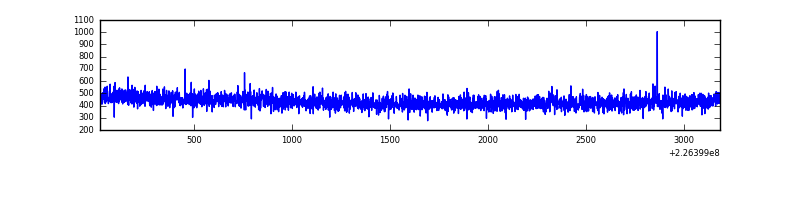 |
| D | 3165 | 3165 | 4 | 4 | 0.13% | 0.13% | 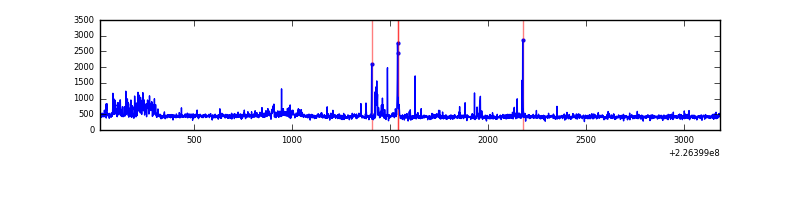 |
Top three noisy pixels from each quadrant. If the there are fewer than three noisy pixels in the level2.evt file, extra rows are filled as -1
| Pixel properties | Quadrant properties | ||||||
|---|---|---|---|---|---|---|---|
| Quadrant | DetID | PixID | Counts | Sigma | Mean | Median | Sigma |
| A | 0 | 226 | 3557 | 43.24 | 359 | 350 | 74.2 |
| A | 12 | 194 | 3228 | 38.8 | 359 | 350 | 74.2 |
| A | 8 | 6 | 2418 | 27.88 | 359 | 350 | 74.2 |
| B | 4 | 173 | 20487 | 291.52 | 358 | 350 | 69.1 |
| B | 0 | 219 | 14922 | 210.95 | 358 | 350 | 69.1 |
| B | 0 | 214 | 14565 | 205.79 | 358 | 350 | 69.1 |
| C | 13 | 61 | 2683 | 28.79 | 348 | 350 | 81.0 |
| C | 12 | 4 | 1713 | 16.82 | 348 | 350 | 81.0 |
| C | 8 | 222 | 1202 | 10.52 | 348 | 350 | 81.0 |
| D | 2 | 152 | 62337 | 704.51 | 353 | 343 | 88.0 |
| D | 12 | 221 | 36838 | 414.74 | 353 | 343 | 88.0 |
| D | 2 | 14 | 14627 | 162.33 | 353 | 343 | 88.0 |
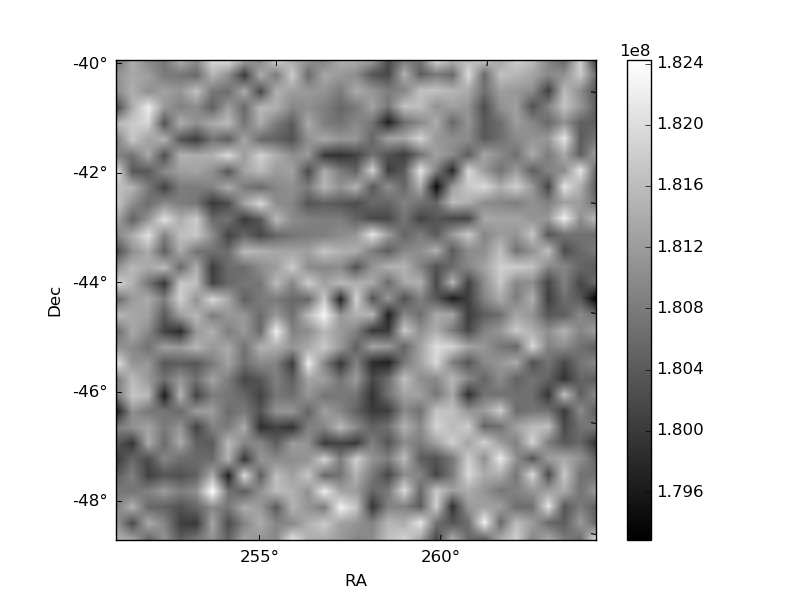
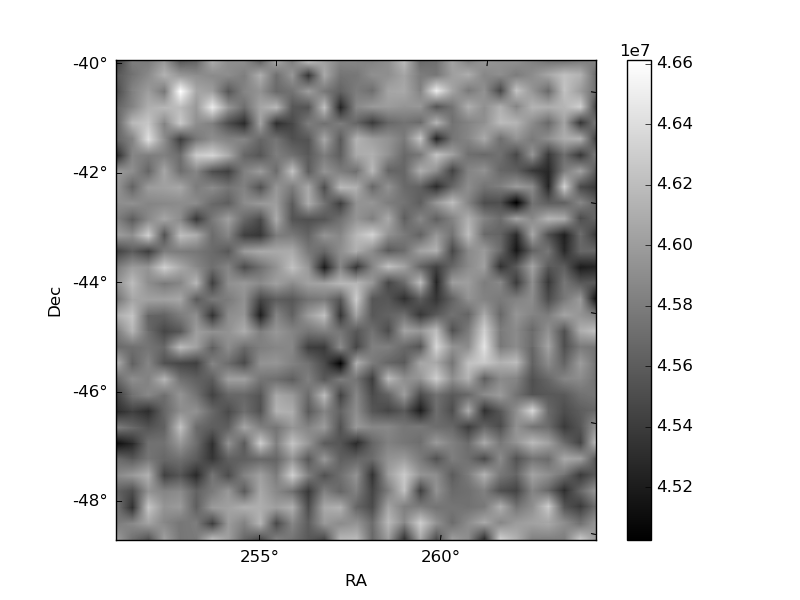
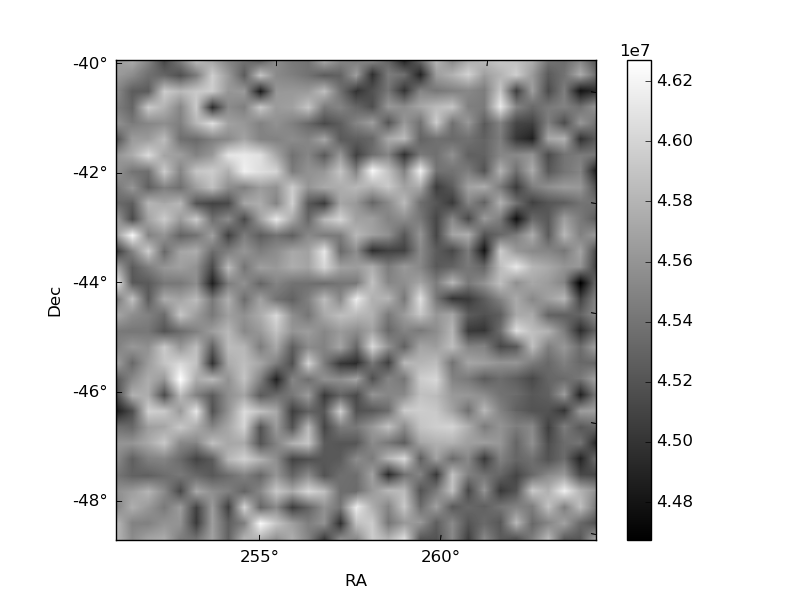
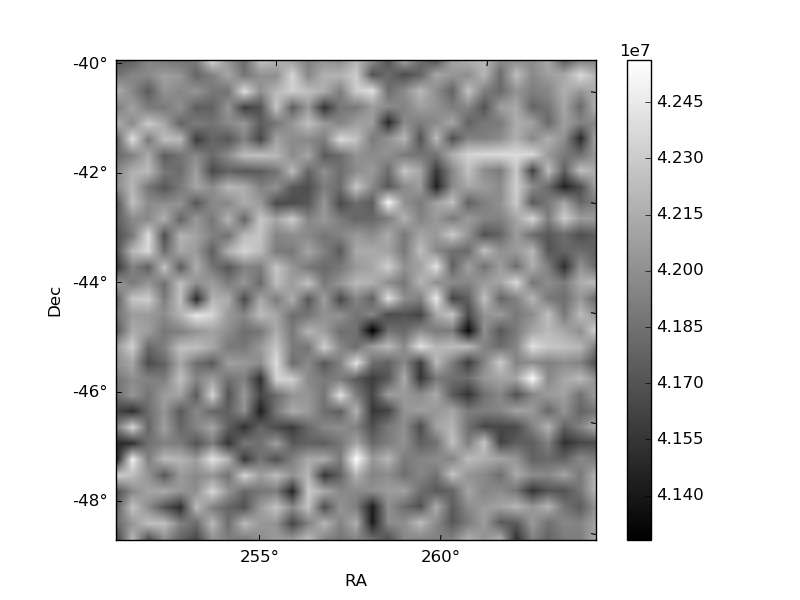
Histogram calculated using DETX and DETY for each event in the final _common_clean file
| Quadrant A | 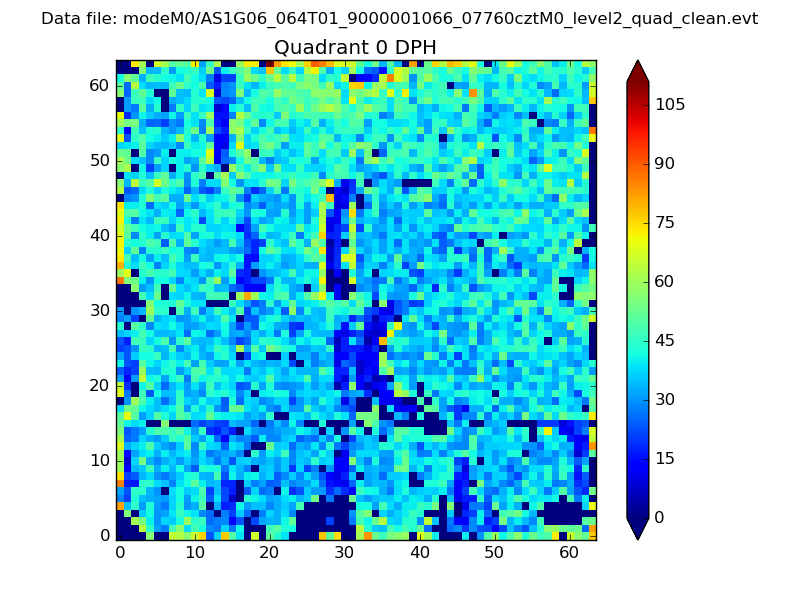 |
 |
Quadrant B |
|---|---|---|---|
| Quadrant D | 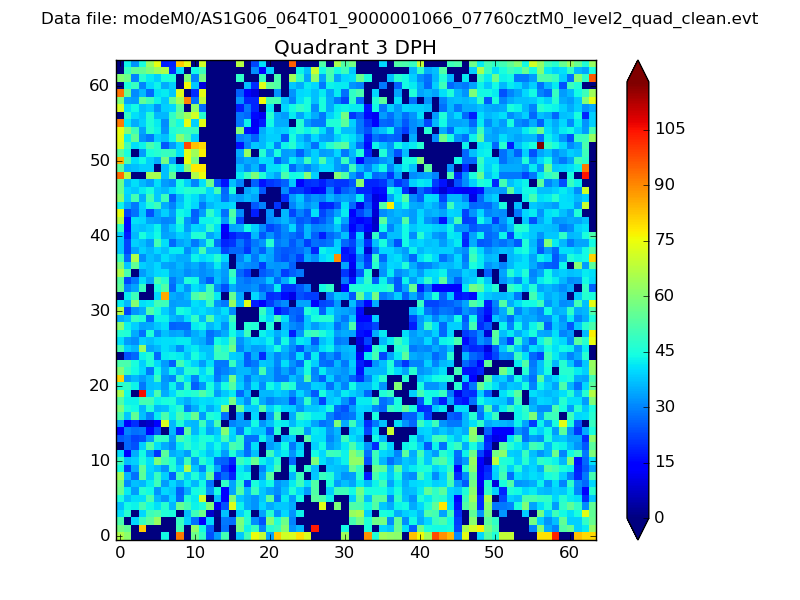 |
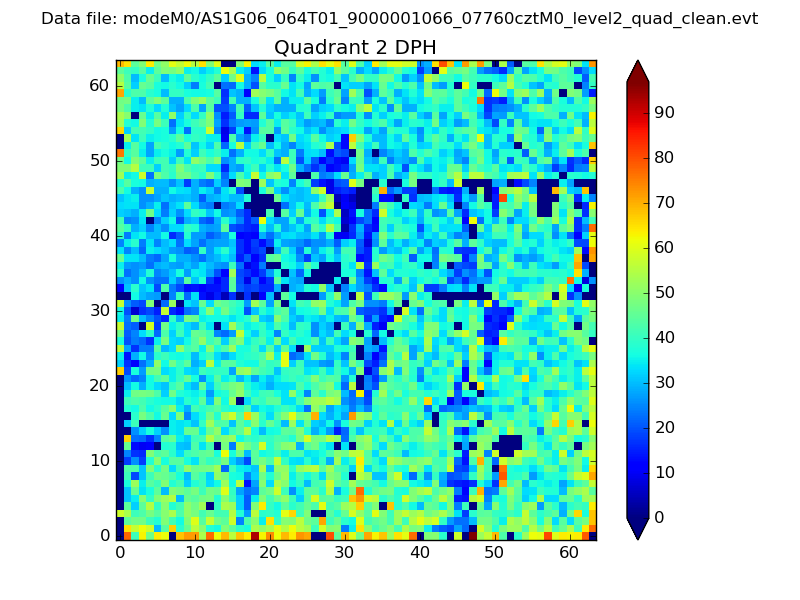 |
Quadrant C |
| Plot type | Count rate plots | Images |
|---|---|---|
| Comparison with Poisson distribution Blue bars denote a histogram of data divided into 1 sec bins. Red curve is a Poisson curve with rate = median count rate of data. |
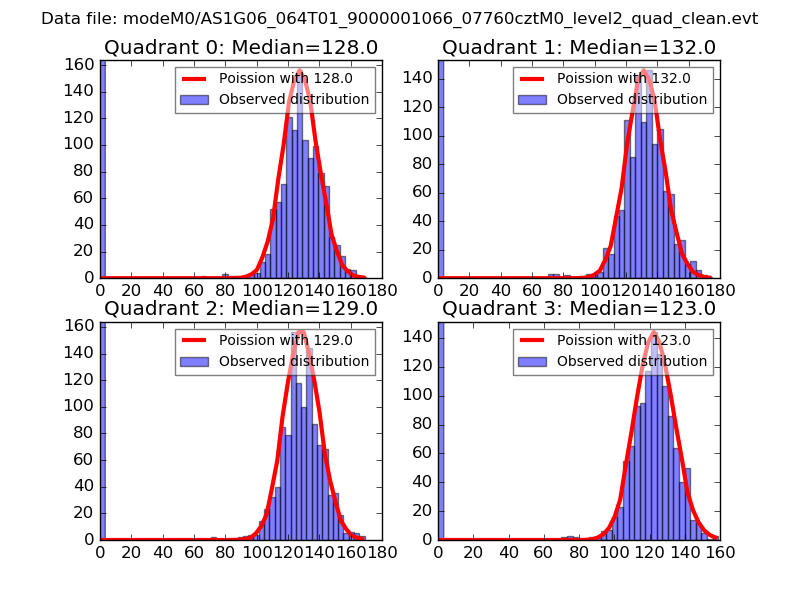 |
 |
| Quadrant-wise count rates Data is divided into 100 sec bins |
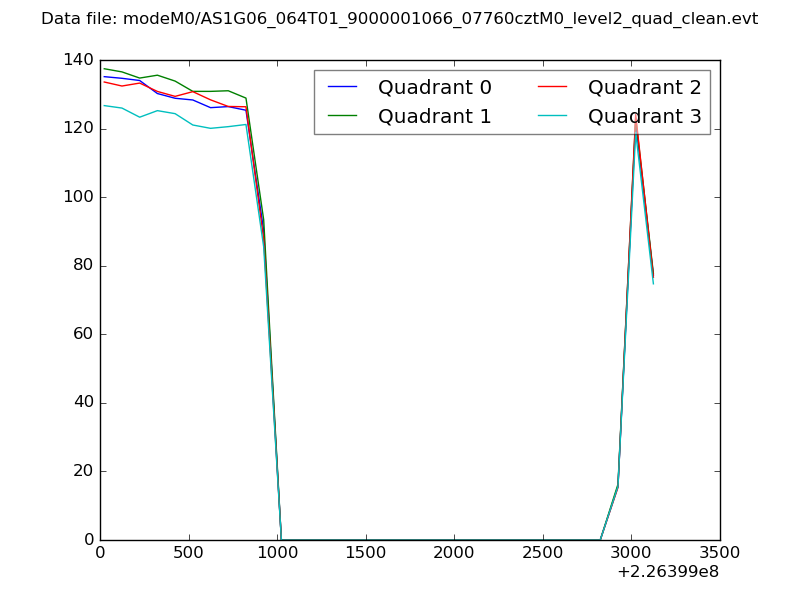 |
|
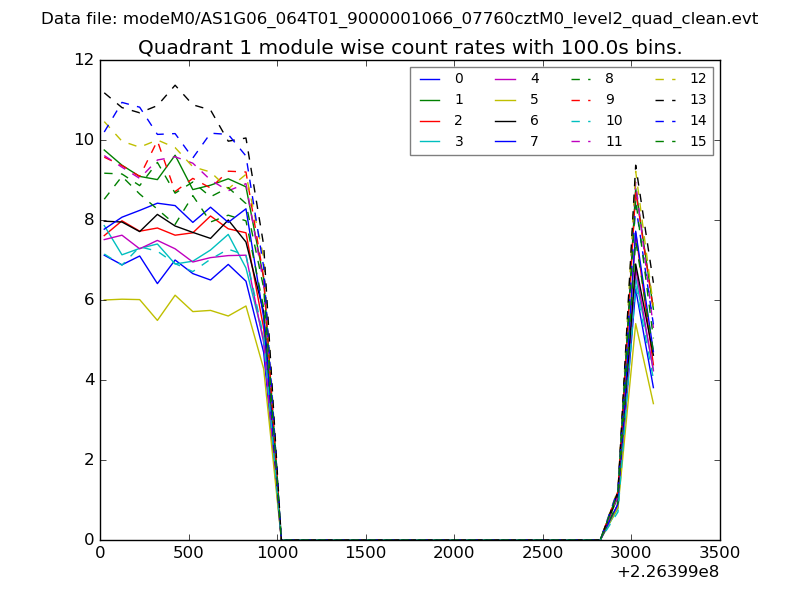
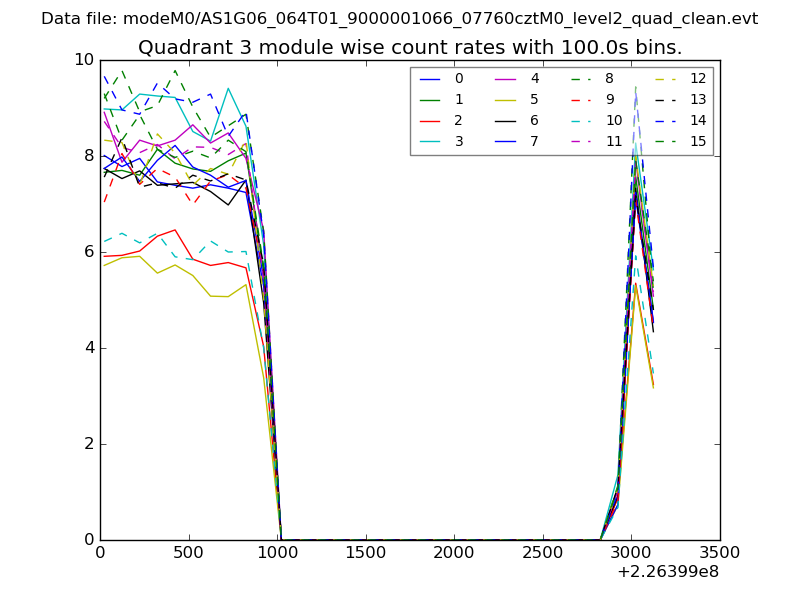
| Module-wise count rates for Quadrant A Data is divided into 100 sec bins |
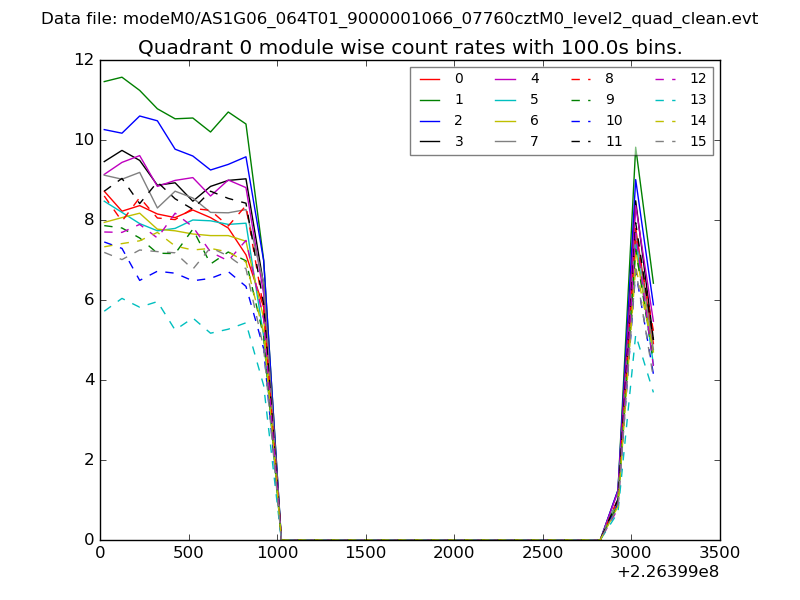 |
 |
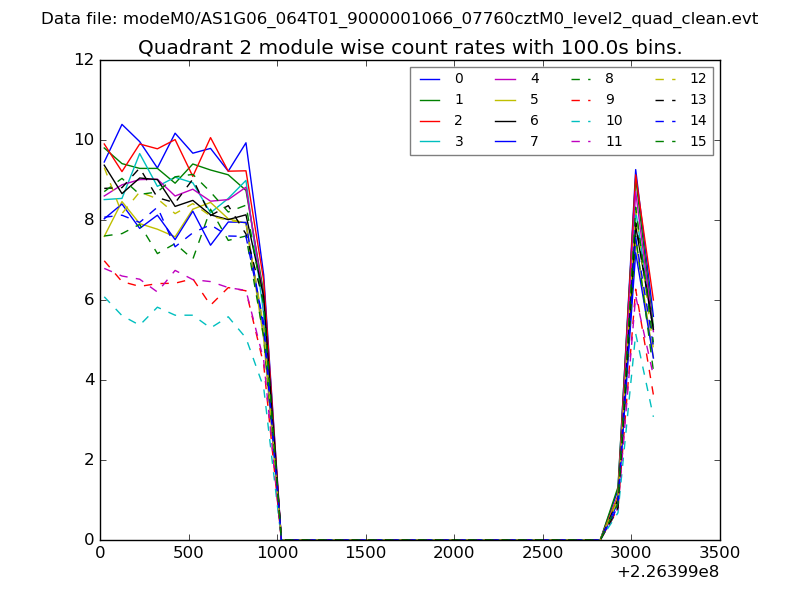
| Module-wise count rates for Quadrant B Data is divided into 100 sec bins |
 |
 |
| Module-wise count rates for Quadrant C Data is divided into 100 sec bins |
 |
 |
| Module-wise count rates for Quadrant D Data is divided into 100 sec bins |
 |
 |
| Parameter | Plot |
|---|---|
| CZT HV Monitor | 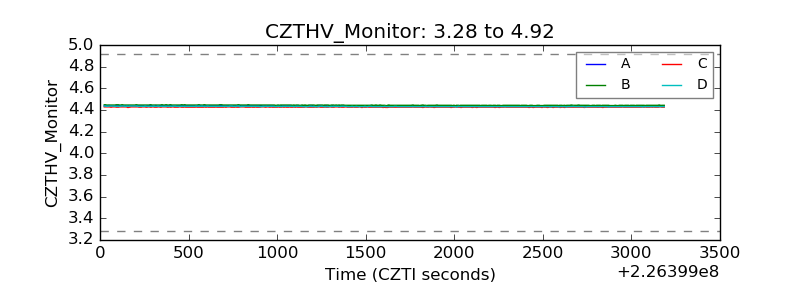 |
| D_VDD | 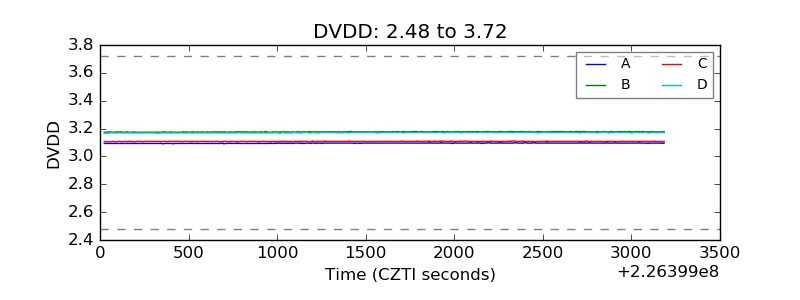 |
| Temperature 1 | 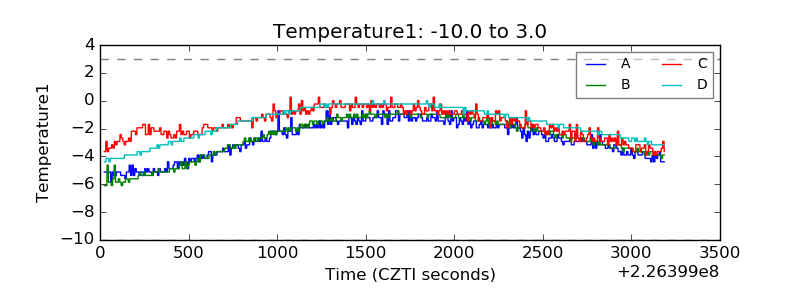 |
| Veto HV Monitor | 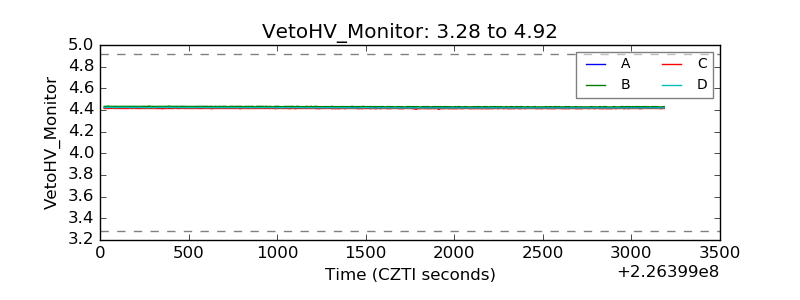 |
| Veto LLD | 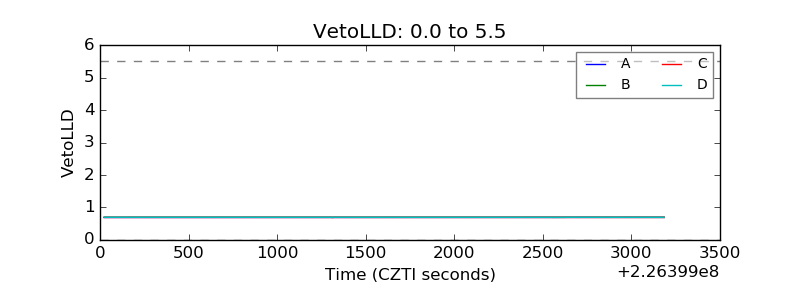 |
| Alpha Counter | 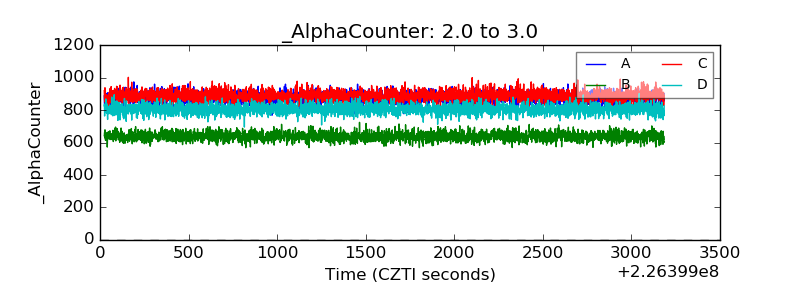 |
| _CPM_Rate | 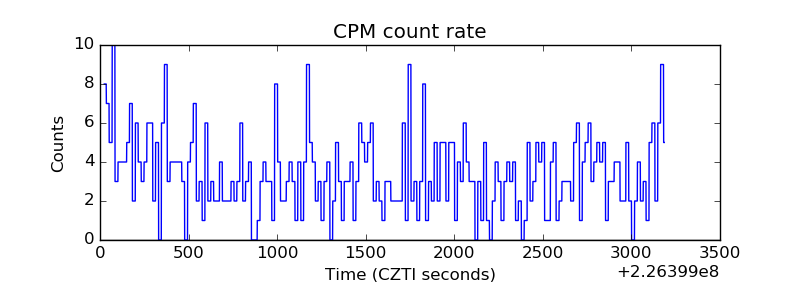 |
| CZT Counter | 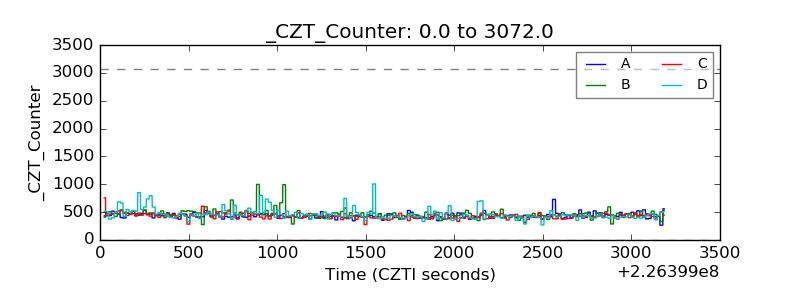 |
| +2.5 Volts monitor |  |
| +5 Volts monitor | 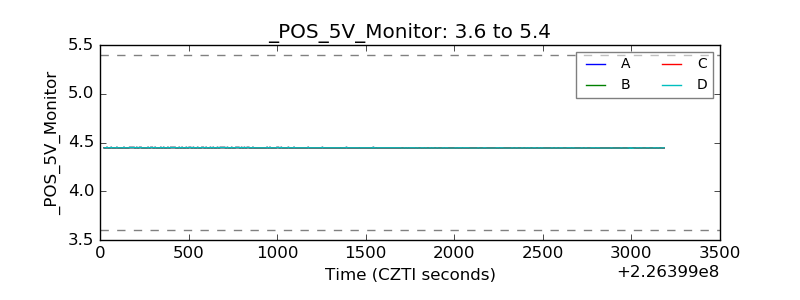 |
| _ROLL_ROT | 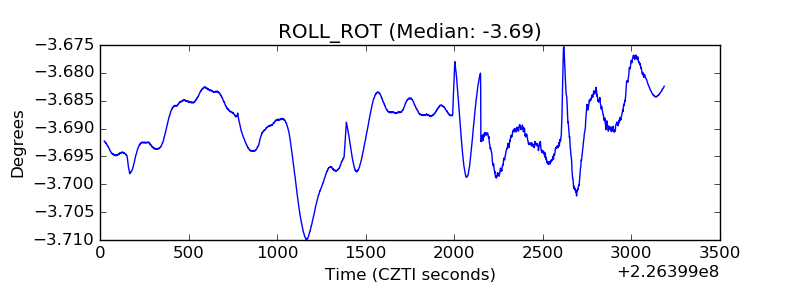 |
| _Roll_DEC | 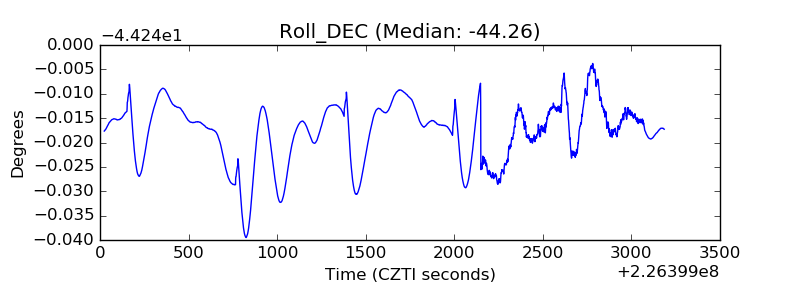 |
| _Roll_RA | 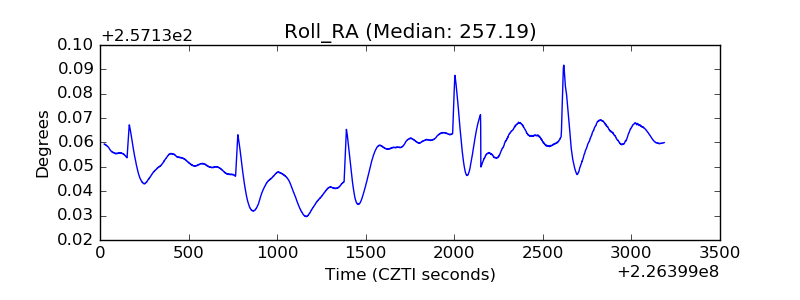 |
| Veto Counter | 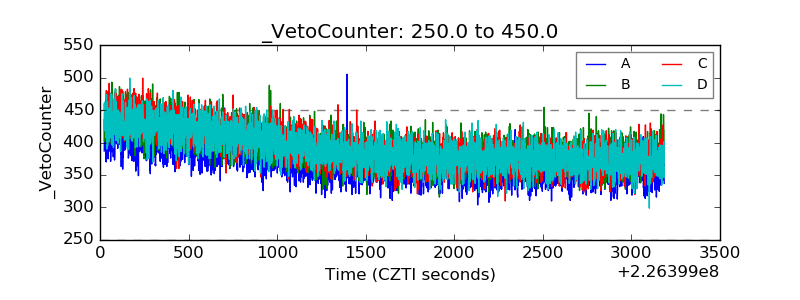 |