| Param | Original file | Final file |
|---|---|---|
| Filename | modeM0/AS1A02_132T01_9000001068cztM0_level2.fits | modeM0/AS1A02_132T01_9000001068cztM0_level2_quad_clean.evt |
| Size (bytes) | 1,093,703,040 | 1,090,103,040 |
| Size | 1.0 GB | 1.0 GB |
| Events in quadrant A | 6,550,202 | 6,470,474 |
| Events in quadrant B | 6,347,908 | 6,523,730 |
| Events in quadrant C | 6,550,380 | 6,298,674 |
| Events in quadrant D | 5,594,038 | 5,644,055 |
| Mode M0 | |||
|---|---|---|---|
| Quadrant | BADHDUFLAG | Total packets | Discarded packets |
| A | 0 | 243261 | 0 |
| B | 0 | 250952 | 0 |
| C | 0 | 242666 | 0 |
| D | 0 | 276686 | 0 |
| Mode SS | |||
|---|---|---|---|
| Quadrant | BADHDUFLAG | Total packets | Discarded packets |
| A | 0 | 2404 | 0 |
| B | 0 | 2406 | 0 |
| C | 0 | 2406 | 0 |
| D | 0 | 2406 | 0 |
| Mode M9 | |||
|---|---|---|---|
| Quadrant | BADHDUFLAG | Total packets | Discarded packets |
| A | 0 | 150 | 0 |
| B | 0 | 150 | 0 |
| C | 0 | 150 | 0 |
| D | 0 | 150 | 0 |
| Quadrant | Total seconds | Saturated seconds | Saturation percentage |
|---|---|---|---|
| A | 117879 | 2002 | 1.698352% |
| B | 117883 | 2334 | 1.979929% |
| C | 117880 | 1368 | 1.160502% |
| D | 117877 | 3393 | 2.878424% |
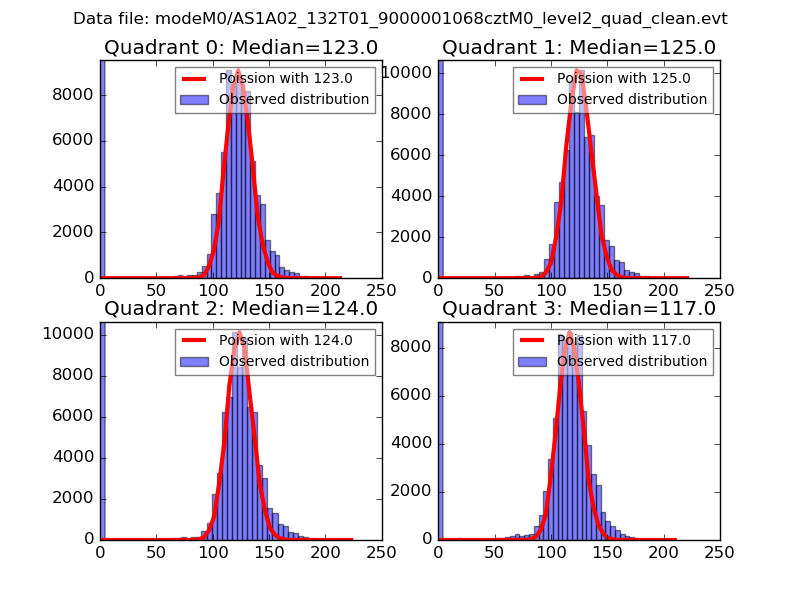
Noise dominated data is calculated using 1-second bins in cleaned event files. If a bin has >2000 counts, and if more than 50% of those come from <1% of pixels, then it is considered to be noise-dominated and hence unusable.
| Quadrant | # 1 sec bins | Bins with >0 counts | Bins with >2000 counts | High rate bins dominated by noise | Noise dominated (total time) | Noise dominated (detector-on time) | Marked lightcurve |
|---|---|---|---|---|---|---|---|
| A | 132738 | 117880 | 0 | 0 | 0.00% | 0.00% | 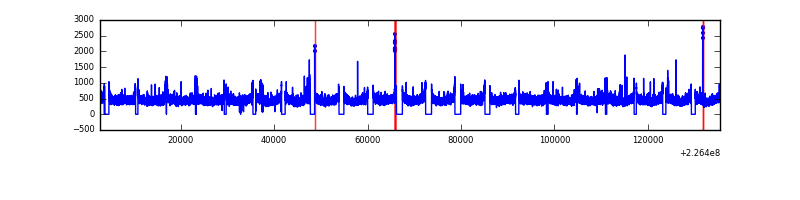 |
| B | 132737 | 117876 | 0 | 0 | 0.00% | 0.00% |  |
| C | 132738 | 117883 | 0 | 0 | 0.00% | 0.00% | 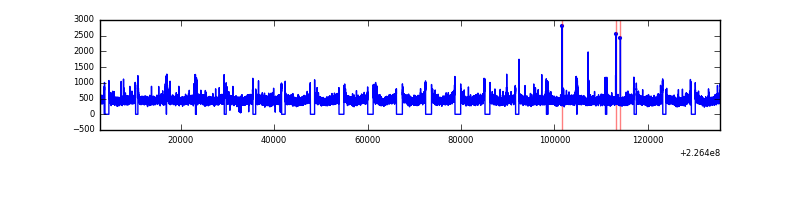 |
| D | 132737 | 117857 | 0 | 0 | 0.00% | 0.00% |  |
Top three noisy pixels from each quadrant. If the there are fewer than three noisy pixels in the level2.evt file, extra rows are filled as -1
| Pixel properties | Quadrant properties | ||||||
|---|---|---|---|---|---|---|---|
| Quadrant | DetID | PixID | Counts | Sigma | Mean | Median | Sigma |
| A | 0 | 29 | 6535 | 11.37 | 1702 | 1579 | 436.0 |
| A | 7 | 110 | 5535 | 9.07 | 1702 | 1579 | 436.0 |
| A | 0 | 30 | 5015 | 7.88 | 1702 | 1579 | 436.0 |
| B | 2 | 9 | 5524 | 11.6 | 1674 | 1583 | 339.6 |
| B | 3 | 17 | 4366 | 8.19 | 1674 | 1583 | 339.6 |
| B | 12 | 226 | 4345 | 8.13 | 1674 | 1583 | 339.6 |
| C | 1 | 81 | 4781 | 6.91 | 1731 | 1593 | 461.3 |
| C | 1 | 80 | 4725 | 6.79 | 1731 | 1593 | 461.3 |
| C | 12 | 241 | 4493 | 6.29 | 1731 | 1593 | 461.3 |
| D | 6 | 231 | 4028 | 6.0 | 1597 | 1444 | 430.5 |
| D | 11 | 82 | 3980 | 5.89 | 1597 | 1444 | 430.5 |
| D | 7 | 5 | 3967 | 5.86 | 1597 | 1444 | 430.5 |
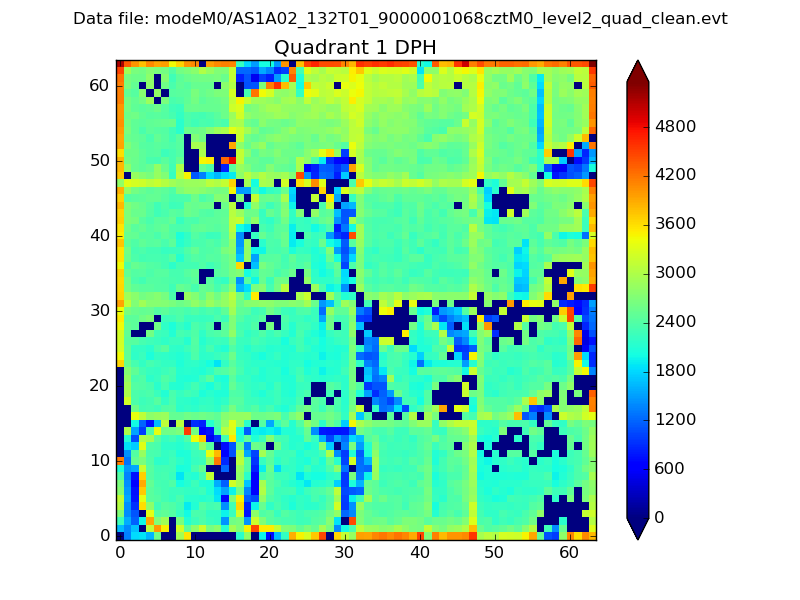
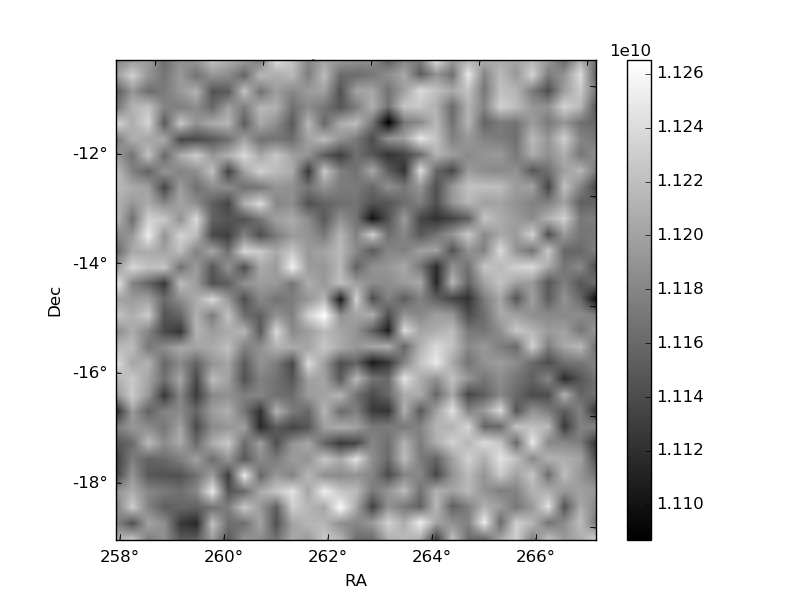
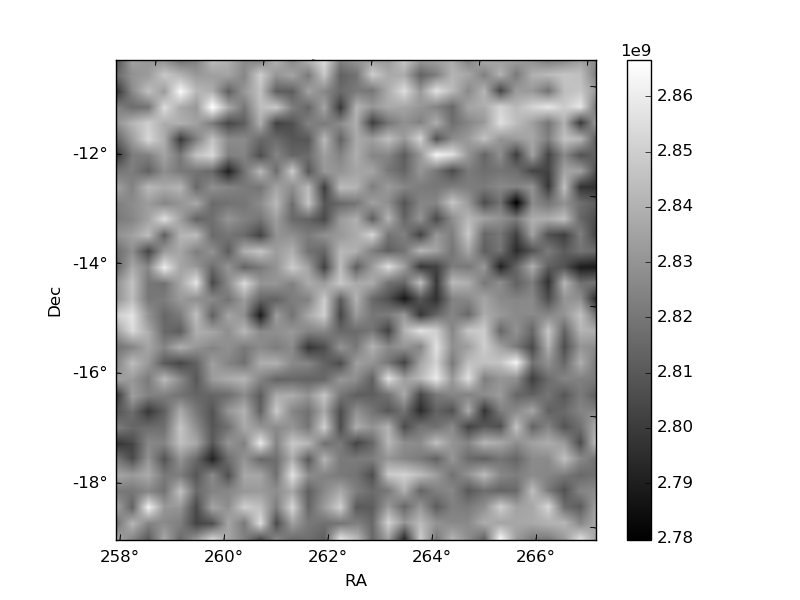
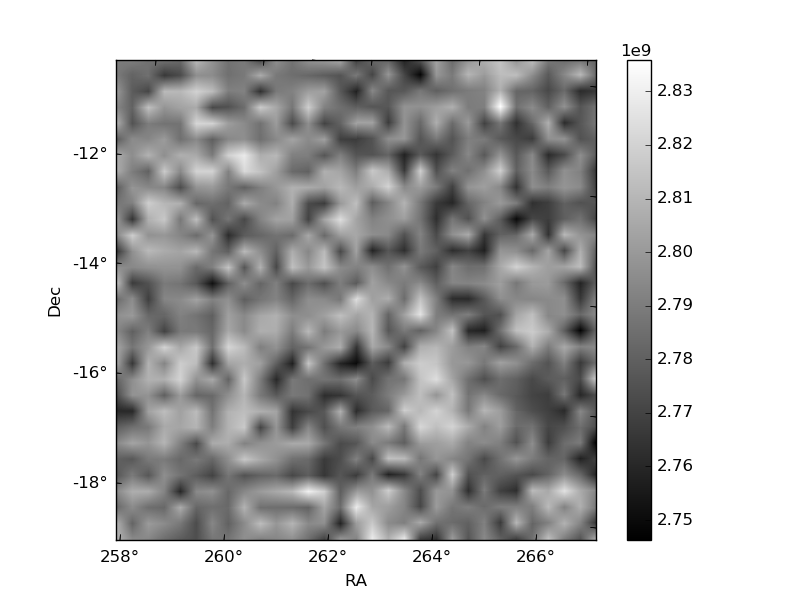
Histogram calculated using DETX and DETY for each event in the final _common_clean file
| Quadrant A |  |
 |
Quadrant B |
|---|---|---|---|
| Quadrant D | 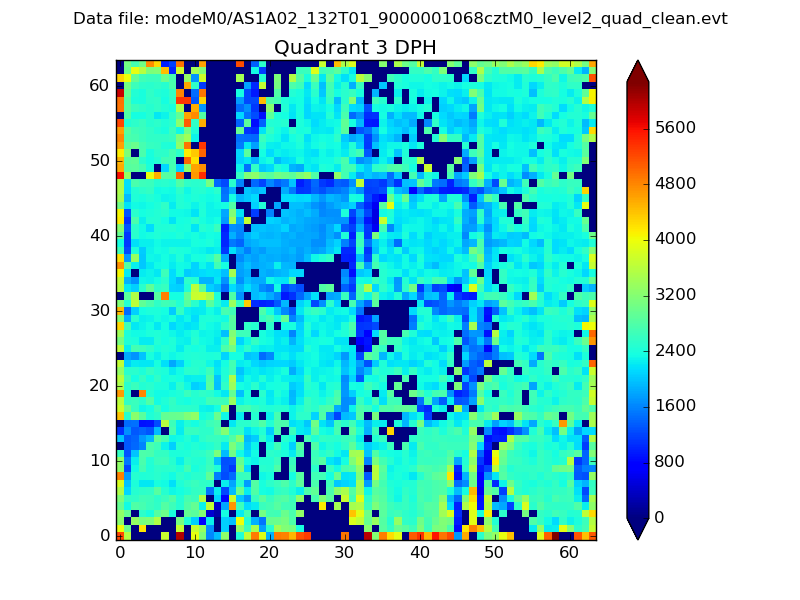 |
 |
Quadrant C |
| Plot type | Count rate plots | Images |
|---|---|---|
| Comparison with Poisson distribution Blue bars denote a histogram of data divided into 1 sec bins. Red curve is a Poisson curve with rate = median count rate of data. |
 |
 |
| Quadrant-wise count rates Data is divided into 100 sec bins |
 |
|
| Module-wise count rates for Quadrant A Data is divided into 100 sec bins |
 |
 |
| Module-wise count rates for Quadrant B Data is divided into 100 sec bins |
 |
 |
| Module-wise count rates for Quadrant C Data is divided into 100 sec bins |
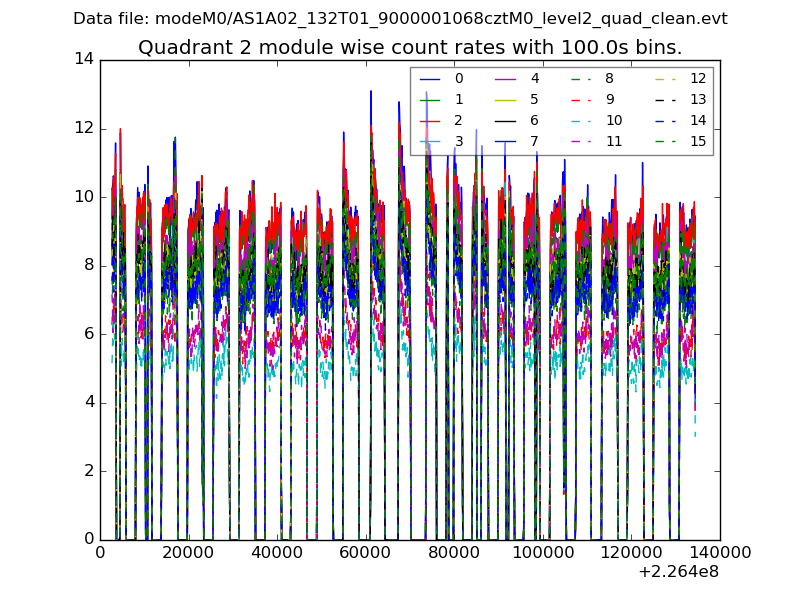 |
 |
| Module-wise count rates for Quadrant D Data is divided into 100 sec bins |
 |
 |
| Parameter | Plot |
|---|---|
| CZT HV Monitor | 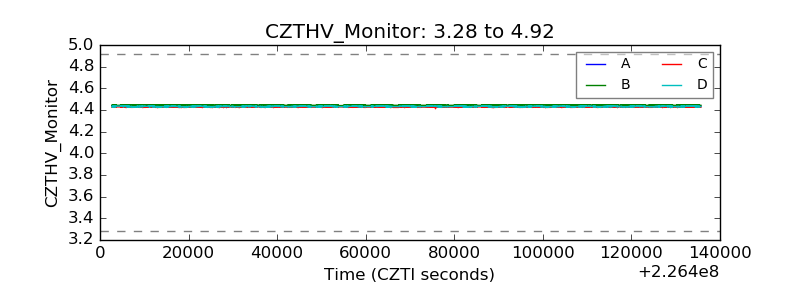 |
| D_VDD |  |
| Temperature 1 |  |
| Veto HV Monitor |  |
| Veto LLD |  |
| Alpha Counter |  |
| _CPM_Rate |  |
| CZT Counter |  |
| +2.5 Volts monitor |  |
| +5 Volts monitor | 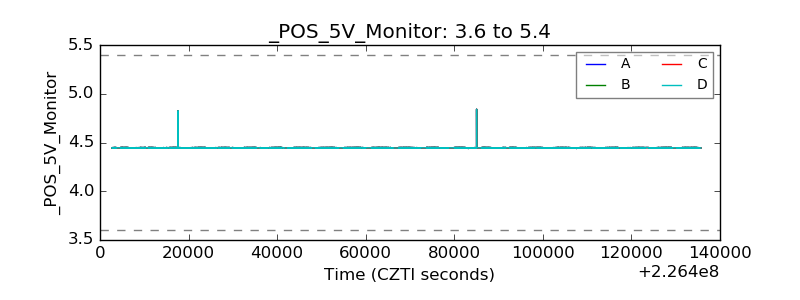 |
| _ROLL_ROT |  |
| _Roll_DEC |  |
| _Roll_RA |  |
| Veto Counter | 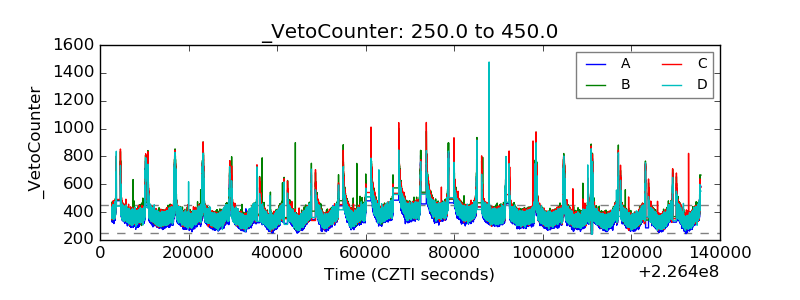 |