| Param | Original file | Final file |
|---|---|---|
| Filename | modeM0/AS1A02_132T01_9000001068_07760cztM0_level2.evt | modeM0/AS1A02_132T01_9000001068_07760cztM0_level2_quad_clean.evt |
| Size (bytes) | 161,956,800 | 43,827,840 |
| Size | 154.5 MB | 41.8 MB |
| Events in quadrant A | 1,141,661 | 292,039 |
| Events in quadrant B | 1,195,345 | 296,424 |
| Events in quadrant C | 1,135,534 | 296,811 |
| Events in quadrant D | 1,276,599 | 278,819 |
| Mode M0 | |||
|---|---|---|---|
| Quadrant | BADHDUFLAG | Total packets | Discarded packets |
| A | 0 | 4785 | 2 |
| B | 0 | 4912 | 1 |
| C | 0 | 4778 | 1 |
| D | 0 | 5246 | 1 |
| Mode SS | |||
|---|---|---|---|
| Quadrant | BADHDUFLAG | Total packets | Discarded packets |
| A | 0 | 46 | 0 |
| B | 0 | 46 | 0 |
| C | 0 | 46 | 0 |
| D | 0 | 46 | 0 |
| Mode M9 | |||
|---|---|---|---|
| Quadrant | BADHDUFLAG | Total packets | Discarded packets |
| A | 0 | 10 | 0 |
| B | 0 | 10 | 0 |
| C | 0 | 10 | 0 |
| D | 0 | 10 | 0 |
| Quadrant | Total seconds | Saturated seconds | Saturation percentage |
|---|---|---|---|
| A | 2260 | 87 | 3.849558% |
| B | 2260 | 76 | 3.362832% |
| C | 2260 | 48 | 2.123894% |
| D | 2260 | 82 | 3.628319% |
Noise dominated data is calculated using 1-second bins in cleaned event files. If a bin has >2000 counts, and if more than 50% of those come from <1% of pixels, then it is considered to be noise-dominated and hence unusable.
| Quadrant | # 1 sec bins | Bins with >0 counts | Bins with >2000 counts | High rate bins dominated by noise | Noise dominated (total time) | Noise dominated (detector-on time) | Marked lightcurve |
|---|---|---|---|---|---|---|---|
| A | 3195 | 2261 | 0 | 0 | 0.00% | 0.00% | 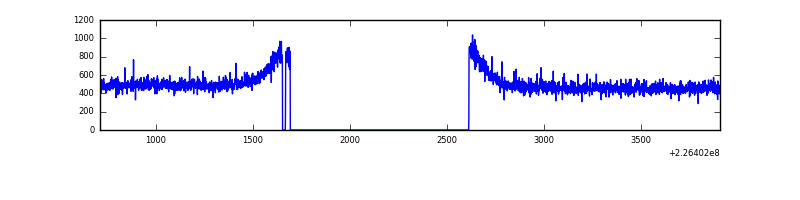 |
| B | 3195 | 2261 | 0 | 0 | 0.00% | 0.00% | 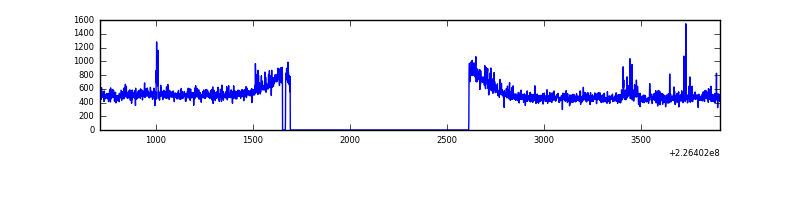 |
| C | 3195 | 2262 | 0 | 0 | 0.00% | 0.00% | 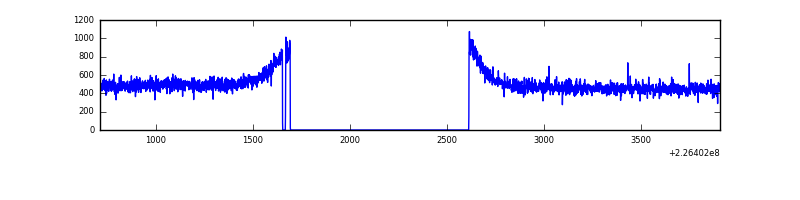 |
| D | 3195 | 2261 | 11 | 11 | 0.34% | 0.49% | 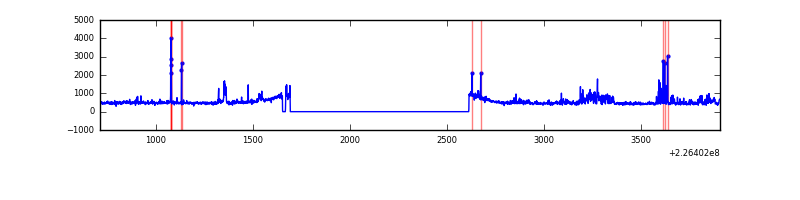 |
Top three noisy pixels from each quadrant. If the there are fewer than three noisy pixels in the level2.evt file, extra rows are filled as -1
| Pixel properties | Quadrant properties | ||||||
|---|---|---|---|---|---|---|---|
| Quadrant | DetID | PixID | Counts | Sigma | Mean | Median | Sigma |
| A | 12 | 194 | 2739 | 39.04 | 295 | 287 | 62.8 |
| A | 0 | 226 | 2659 | 37.77 | 295 | 287 | 62.8 |
| A | 3 | 1 | 2367 | 33.12 | 295 | 287 | 62.8 |
| B | 4 | 173 | 31119 | 519.49 | 295 | 287 | 59.4 |
| B | 12 | 111 | 5867 | 94.02 | 295 | 287 | 59.4 |
| B | 0 | 213 | 4885 | 77.47 | 295 | 287 | 59.4 |
| C | 13 | 61 | 2224 | 27.82 | 290 | 292 | 69.4 |
| C | 8 | 222 | 2083 | 25.79 | 290 | 292 | 69.4 |
| C | 12 | 4 | 847 | 7.99 | 290 | 292 | 69.4 |
| D | 1 | 52 | 118563 | 1604.63 | 289 | 279 | 73.7 |
| D | 2 | 152 | 53244 | 718.52 | 289 | 279 | 73.7 |
| D | 2 | 14 | 7292 | 95.14 | 289 | 279 | 73.7 |
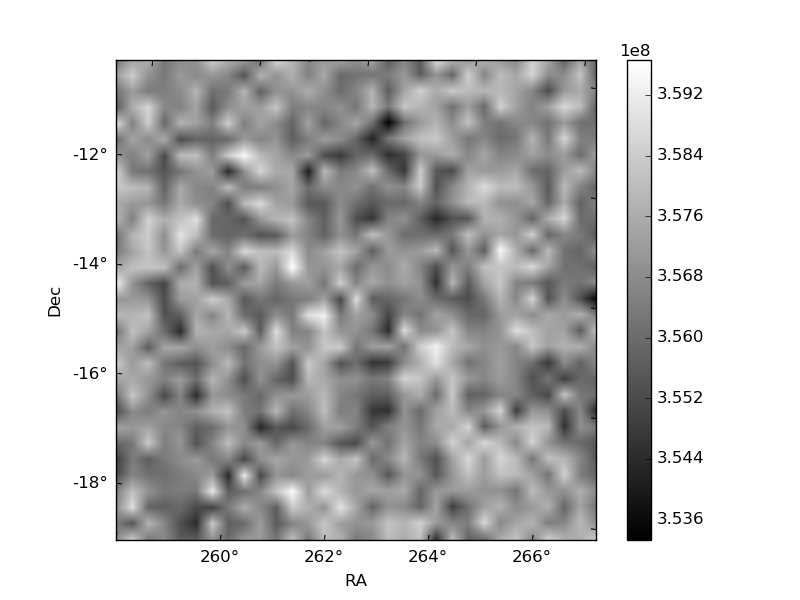
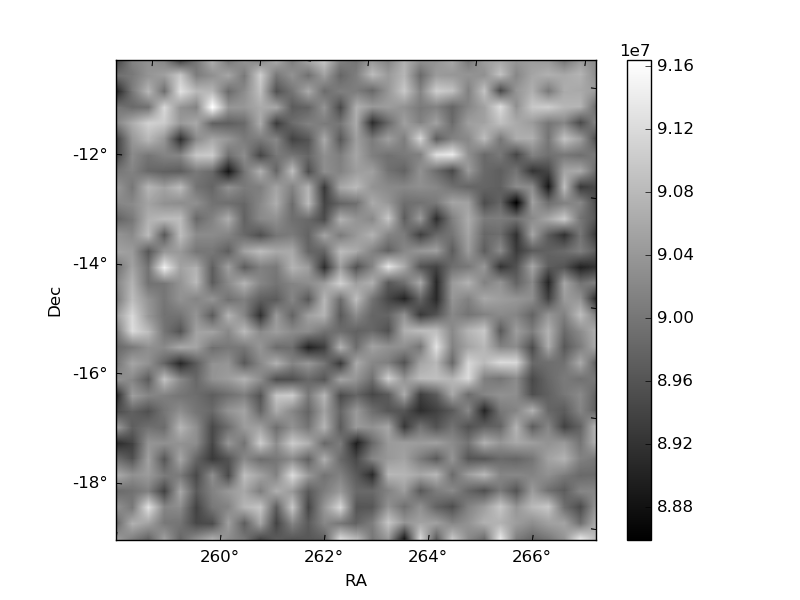
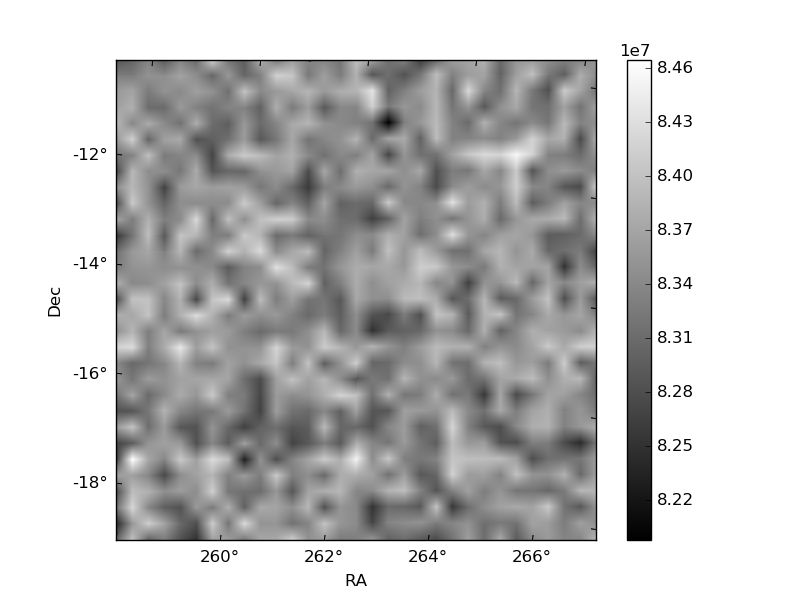
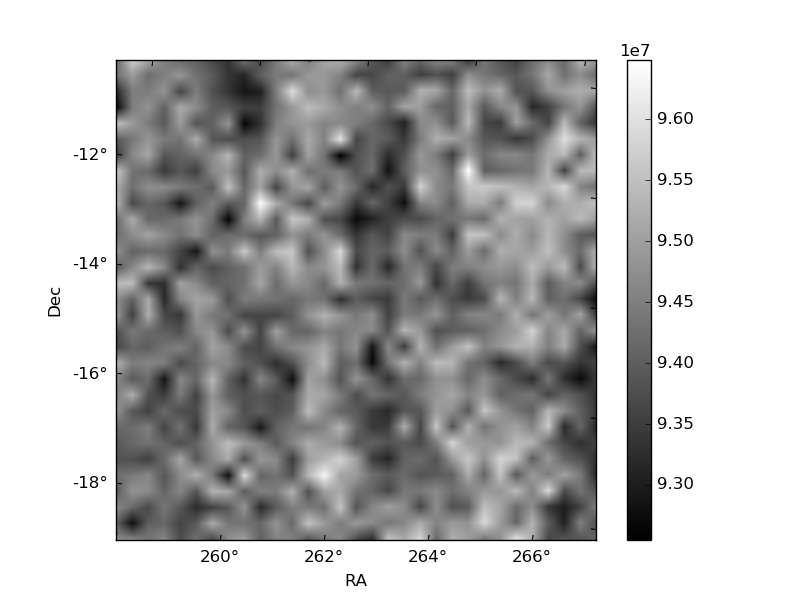
Histogram calculated using DETX and DETY for each event in the final _common_clean file
| Quadrant A | 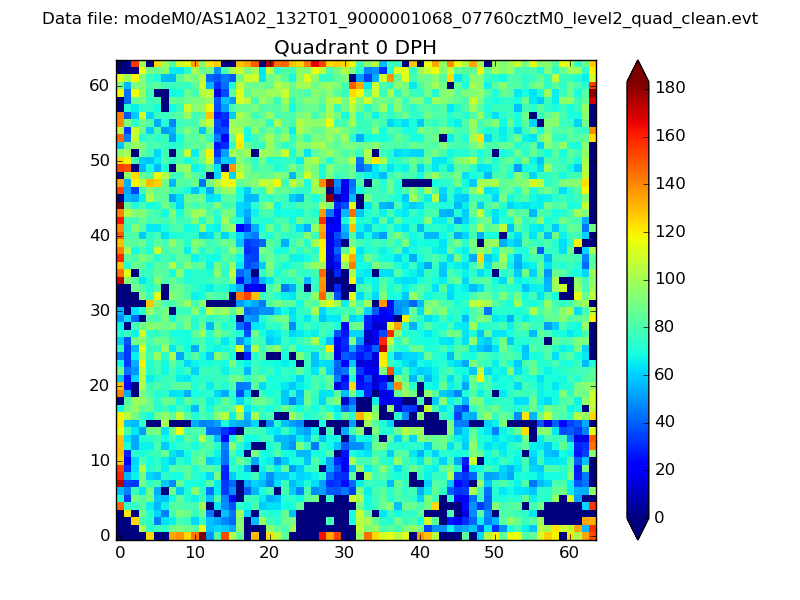 |
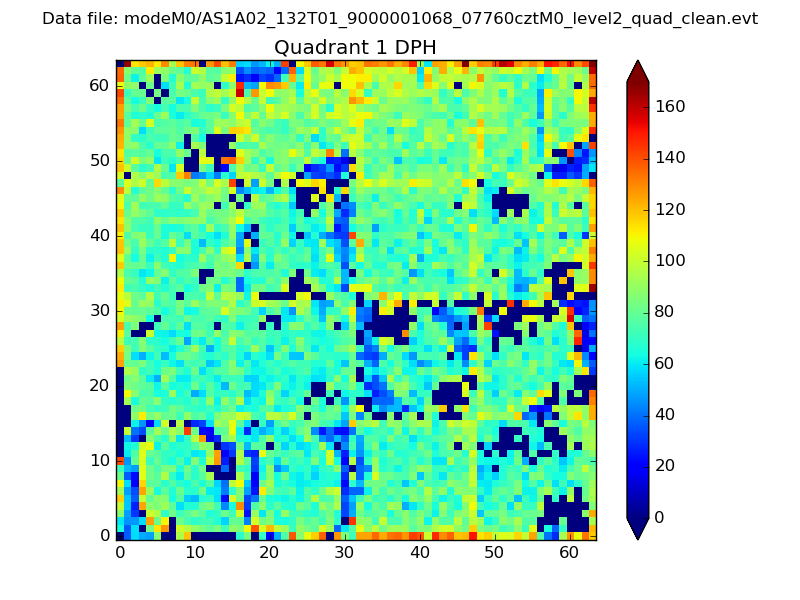 |
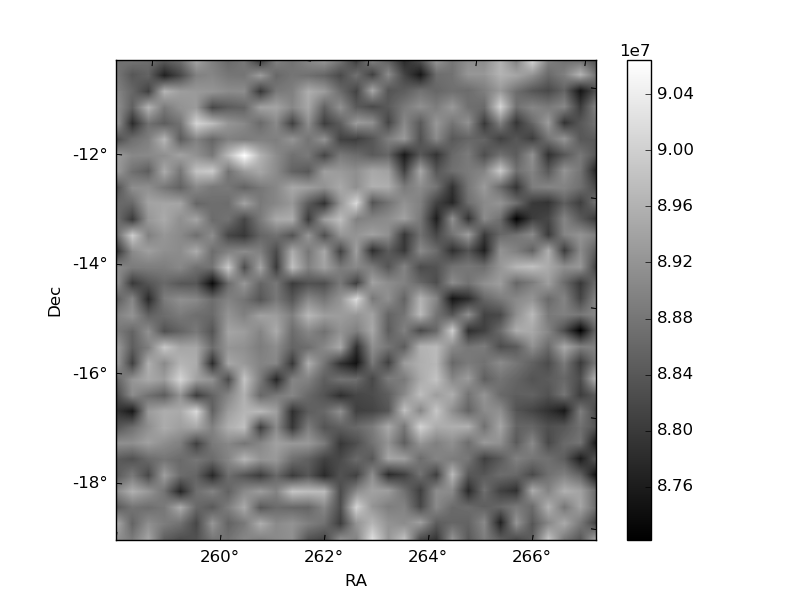
Quadrant B |
|---|---|---|---|
| Quadrant D | 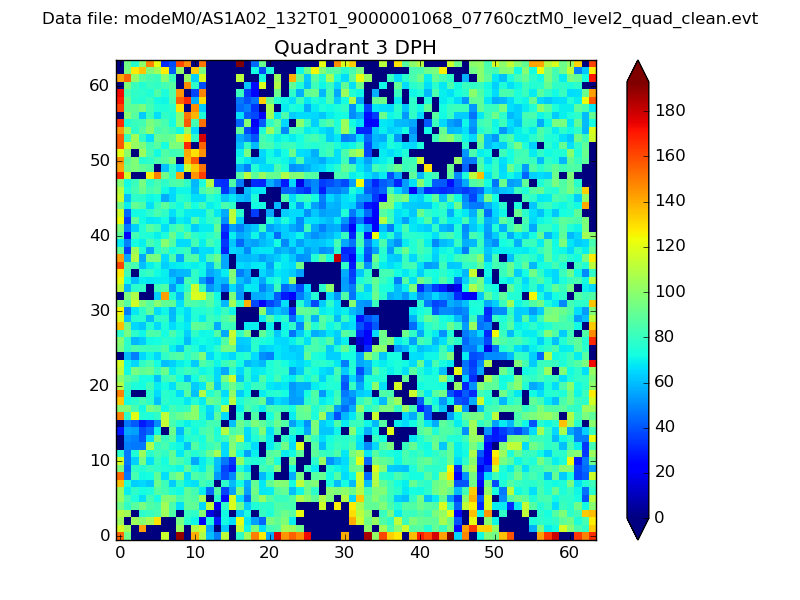 |
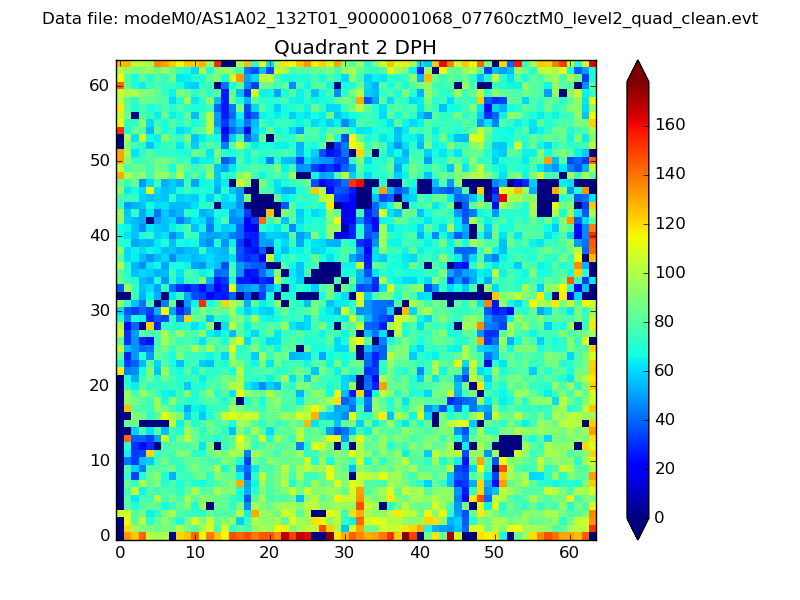 |
Quadrant C |
| Plot type | Count rate plots | Images |
|---|---|---|
| Comparison with Poisson distribution Blue bars denote a histogram of data divided into 1 sec bins. Red curve is a Poisson curve with rate = median count rate of data. |
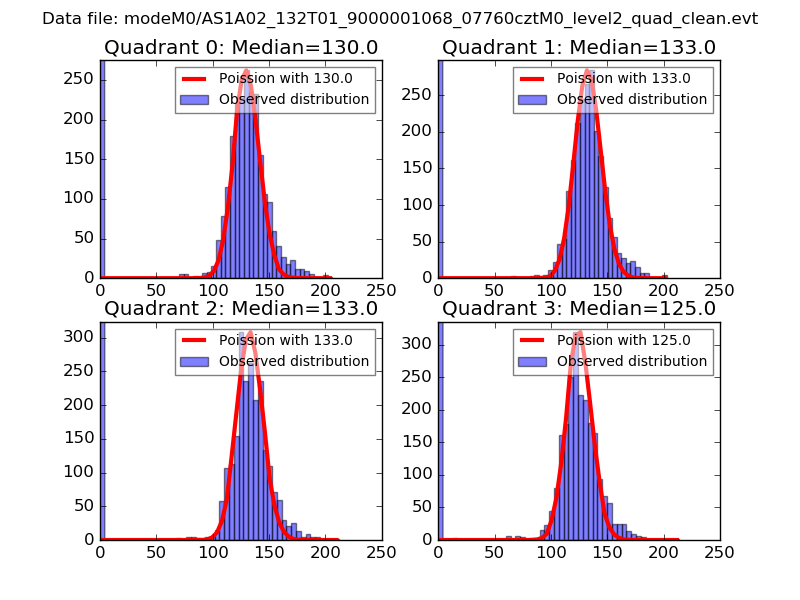 |
 |
| Quadrant-wise count rates Data is divided into 100 sec bins |
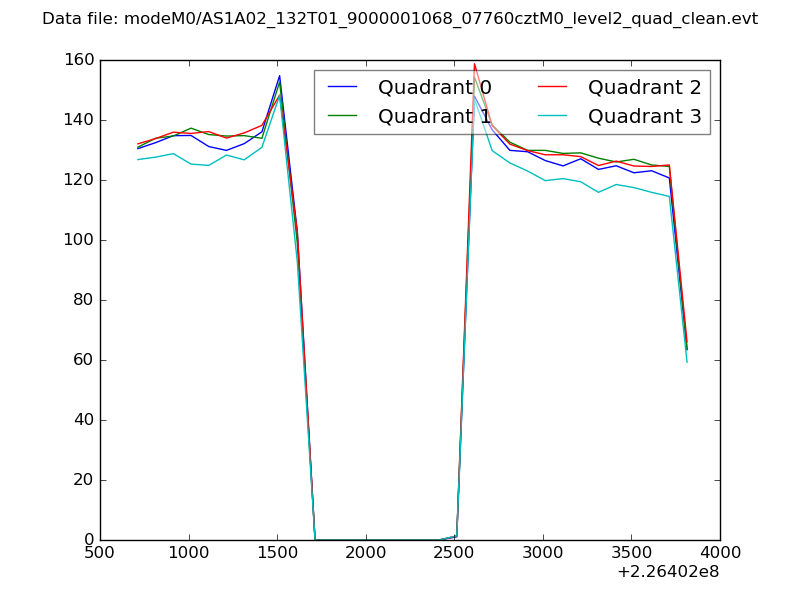 |
|
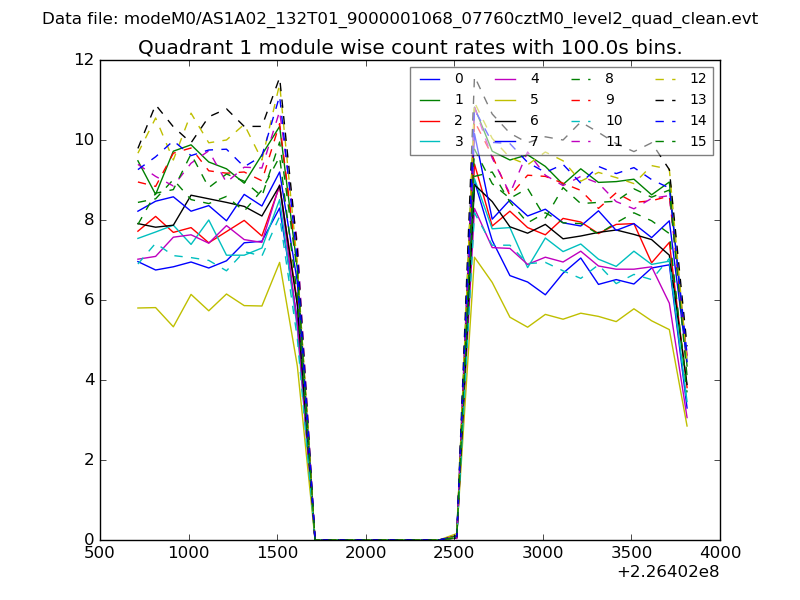
| Module-wise count rates for Quadrant A Data is divided into 100 sec bins |
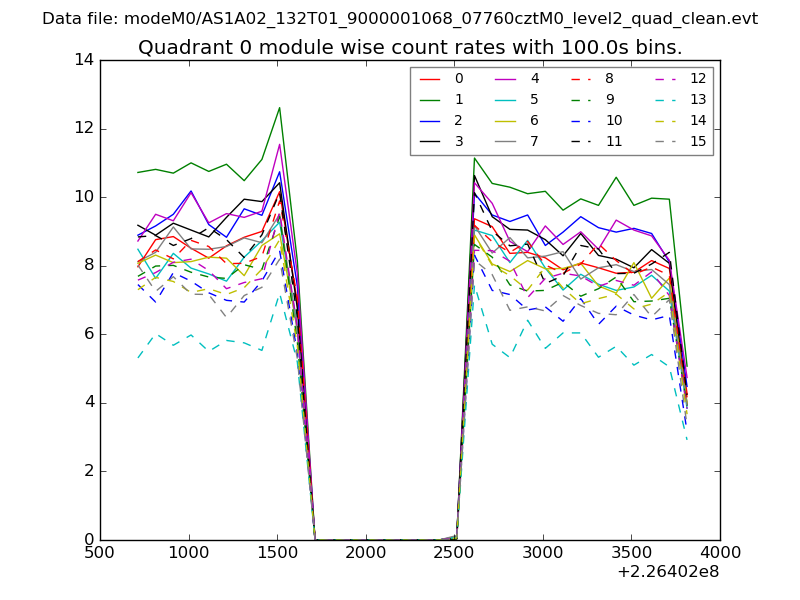 |
 |
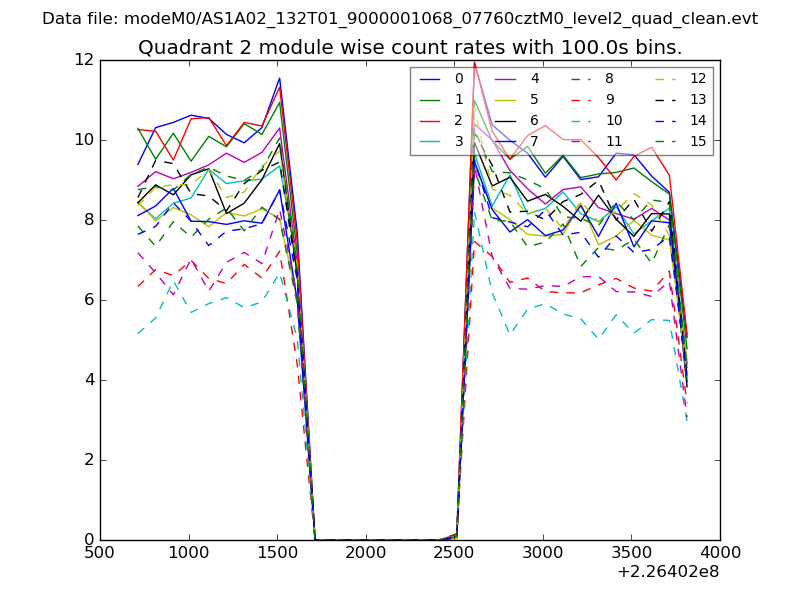
| Module-wise count rates for Quadrant B Data is divided into 100 sec bins |
 |
 |
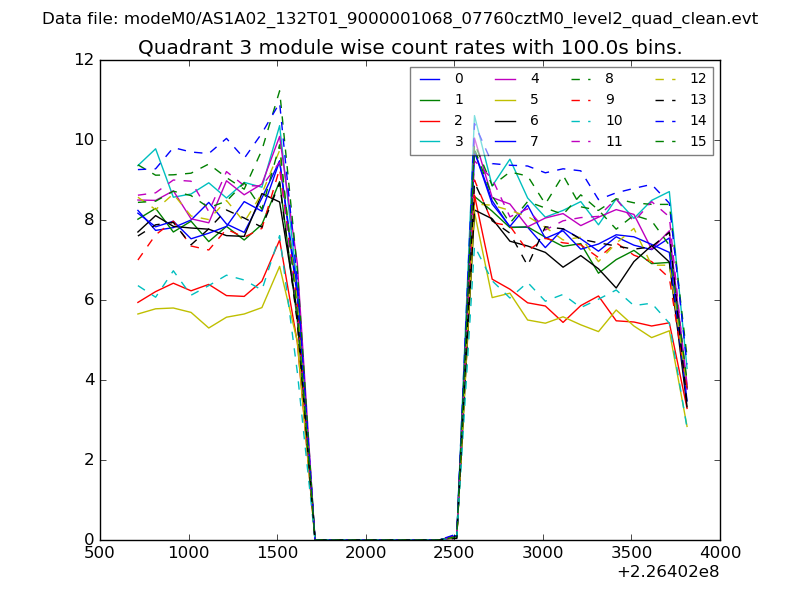
| Module-wise count rates for Quadrant C Data is divided into 100 sec bins |
 |
 |
| Module-wise count rates for Quadrant D Data is divided into 100 sec bins |
 |
 |
| Parameter | Plot |
|---|---|
| CZT HV Monitor | 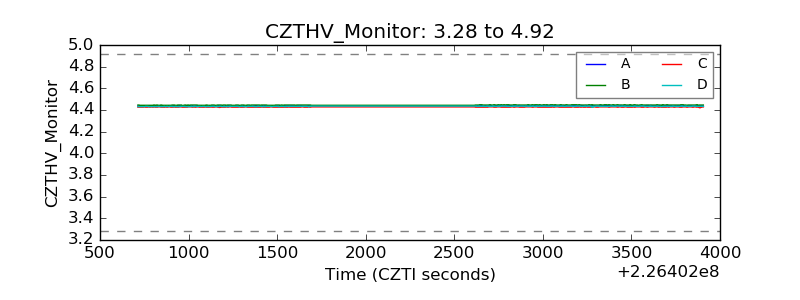 |
| D_VDD | 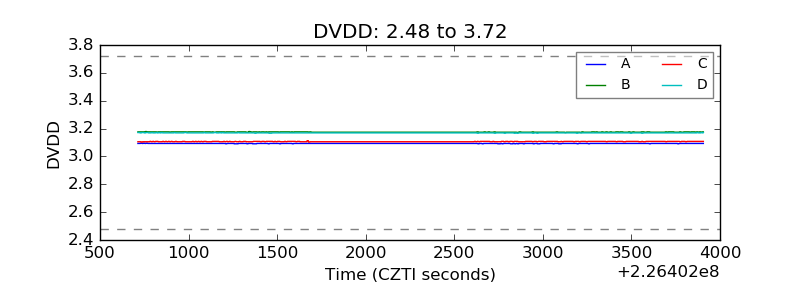 |
| Temperature 1 | 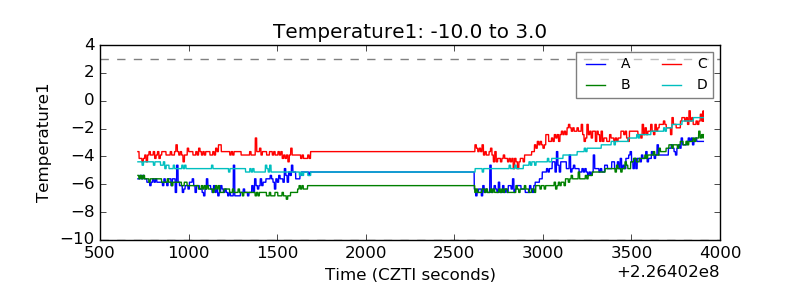 |
| Veto HV Monitor | 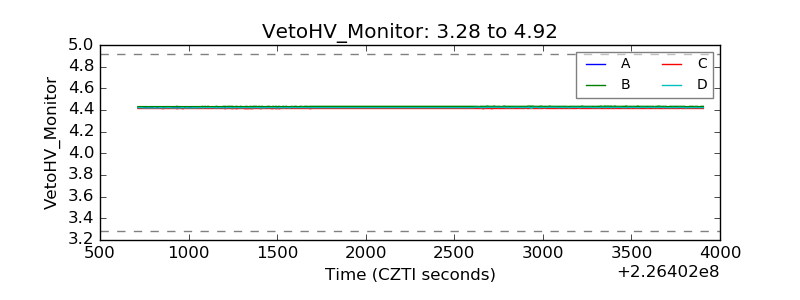 |
| Veto LLD |  |
| Alpha Counter | 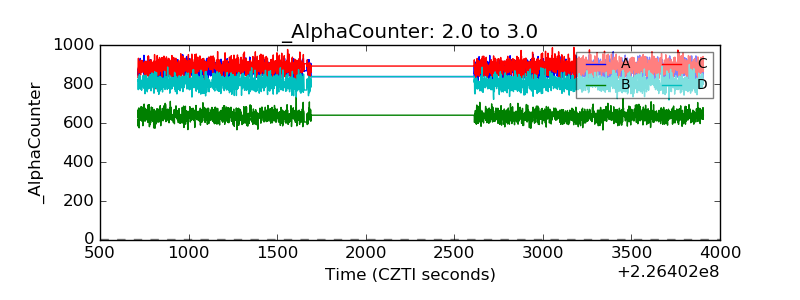 |
| _CPM_Rate | 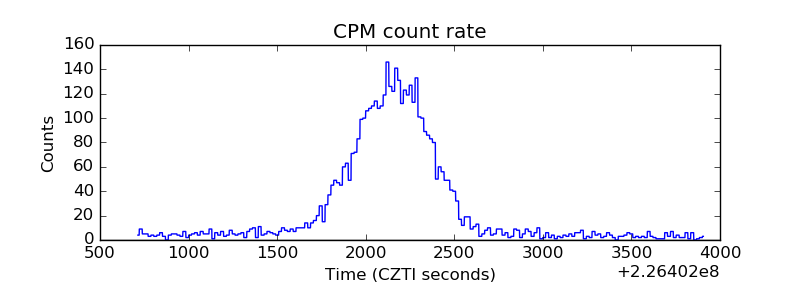 |
| CZT Counter | 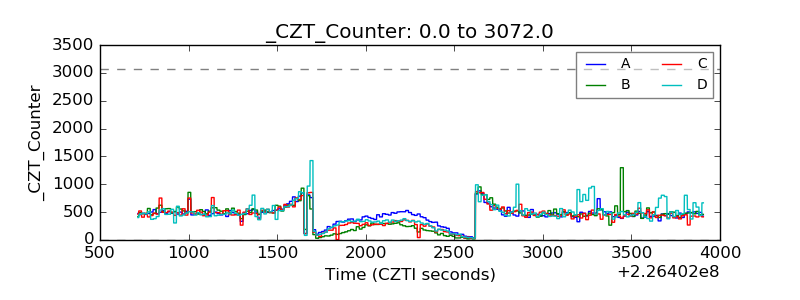 |
| +2.5 Volts monitor |  |
| +5 Volts monitor |  |
| _ROLL_ROT |  |
| _Roll_DEC | 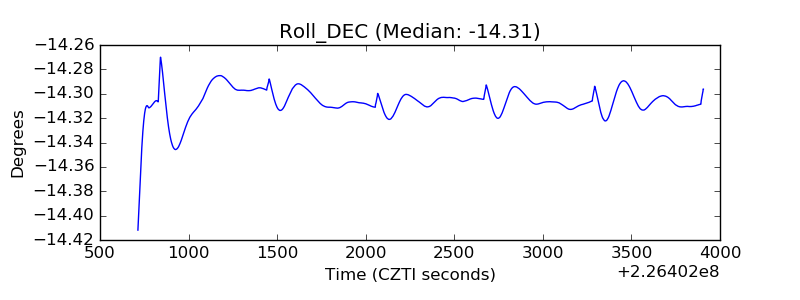 |
| _Roll_RA | 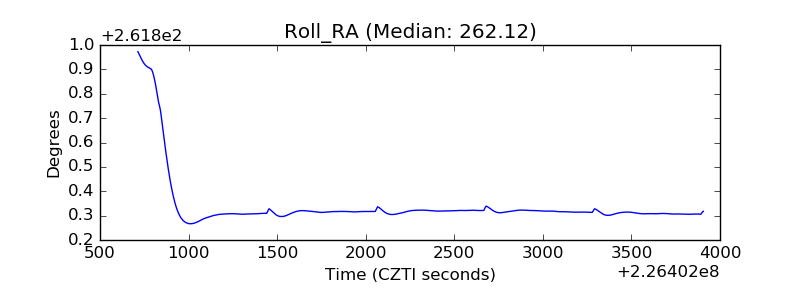 |
| Veto Counter | 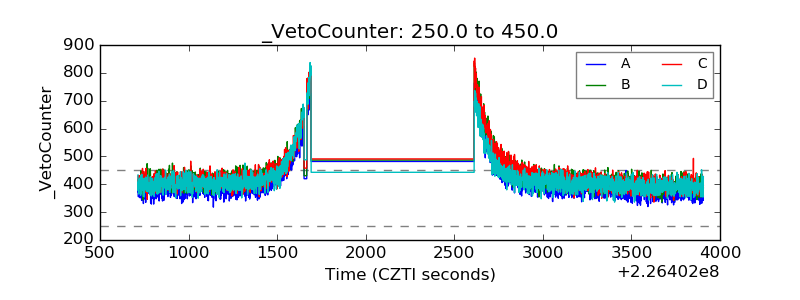 |