| Param | Original file | Final file |
|---|---|---|
| Filename | modeM0/AS1A02_132T01_9000001068_07761cztM0_level2.evt | modeM0/AS1A02_132T01_9000001068_07761cztM0_level2_quad_clean.evt |
| Size (bytes) | 446,437,440 | 80,524,800 |
| Size | 425.8 MB | 76.8 MB |
| Events in quadrant A | 3,137,060 | 491,024 |
| Events in quadrant B | 3,361,545 | 502,741 |
| Events in quadrant C | 3,116,334 | 501,814 |
| Events in quadrant D | 3,447,905 | 473,742 |
| Mode M0 | |||
|---|---|---|---|
| Quadrant | BADHDUFLAG | Total packets | Discarded packets |
| A | 0 | 13825 | 2 |
| B | 0 | 14244 | 1 |
| C | 0 | 13813 | 1 |
| D | 0 | 14927 | 1 |
| Mode SS | |||
|---|---|---|---|
| Quadrant | BADHDUFLAG | Total packets | Discarded packets |
| A | 0 | 136 | 0 |
| B | 0 | 136 | 0 |
| C | 0 | 136 | 0 |
| D | 0 | 136 | 0 |
| Mode M9 | |||
|---|---|---|---|
| Quadrant | BADHDUFLAG | Total packets | Discarded packets |
| A | 0 | 5 | 0 |
| B | 0 | 5 | 0 |
| C | 0 | 5 | 0 |
| D | 0 | 5 | 0 |
| Quadrant | Total seconds | Saturated seconds | Saturation percentage |
|---|---|---|---|
| A | 6727 | 157 | 2.333878% |
| B | 6727 | 164 | 2.437937% |
| C | 6727 | 121 | 1.798722% |
| D | 6727 | 168 | 2.497399% |
Noise dominated data is calculated using 1-second bins in cleaned event files. If a bin has >2000 counts, and if more than 50% of those come from <1% of pixels, then it is considered to be noise-dominated and hence unusable.
| Quadrant | # 1 sec bins | Bins with >0 counts | Bins with >2000 counts | High rate bins dominated by noise | Noise dominated (total time) | Noise dominated (detector-on time) | Marked lightcurve |
|---|---|---|---|---|---|---|---|
| A | 7232 | 6727 | 0 | 0 | 0.00% | 0.00% | 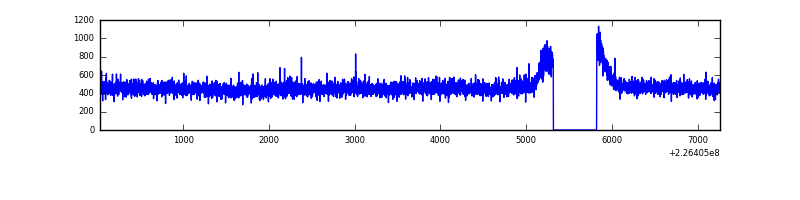 |
| B | 7232 | 6727 | 4 | 4 | 0.06% | 0.06% | 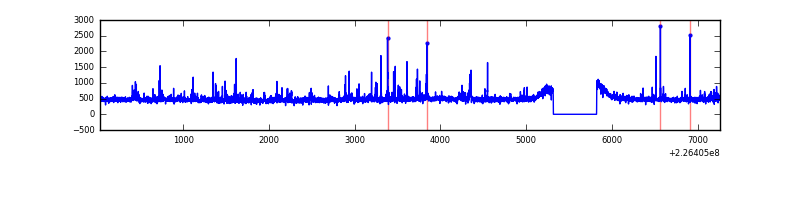 |
| C | 7232 | 6727 | 0 | 0 | 0.00% | 0.00% | 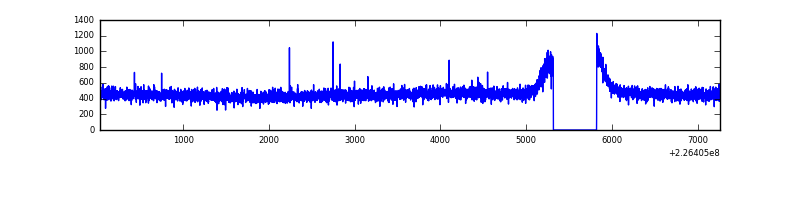 |
| D | 7232 | 6727 | 25 | 25 | 0.35% | 0.37% | 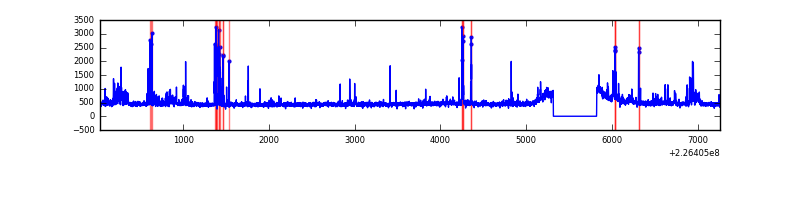 |
Top three noisy pixels from each quadrant. If the there are fewer than three noisy pixels in the level2.evt file, extra rows are filled as -1
| Pixel properties | Quadrant properties | ||||||
|---|---|---|---|---|---|---|---|
| Quadrant | DetID | PixID | Counts | Sigma | Mean | Median | Sigma |
| A | 0 | 226 | 7757 | 41.46 | 812 | 792 | 168.0 |
| A | 12 | 194 | 7356 | 39.07 | 812 | 792 | 168.0 |
| A | 13 | 14 | 6168 | 32.0 | 812 | 792 | 168.0 |
| B | 4 | 173 | 129257 | 817.26 | 815 | 795 | 157.2 |
| B | 4 | 81 | 24154 | 148.61 | 815 | 795 | 157.2 |
| B | 0 | 214 | 16388 | 99.2 | 815 | 795 | 157.2 |
| C | 13 | 61 | 5925 | 27.59 | 796 | 799 | 185.8 |
| C | 8 | 128 | 5186 | 23.61 | 796 | 799 | 185.8 |
| C | 8 | 112 | 3231 | 13.09 | 796 | 799 | 185.8 |
| D | 1 | 52 | 215900 | 1100.03 | 794 | 770 | 195.6 |
| D | 2 | 152 | 128316 | 652.19 | 794 | 770 | 195.6 |
| D | 2 | 14 | 61245 | 309.23 | 794 | 770 | 195.6 |
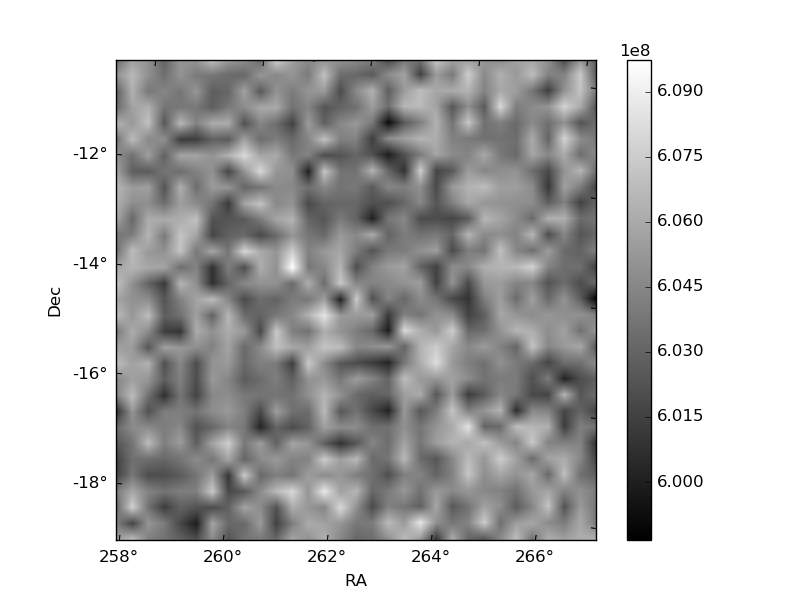
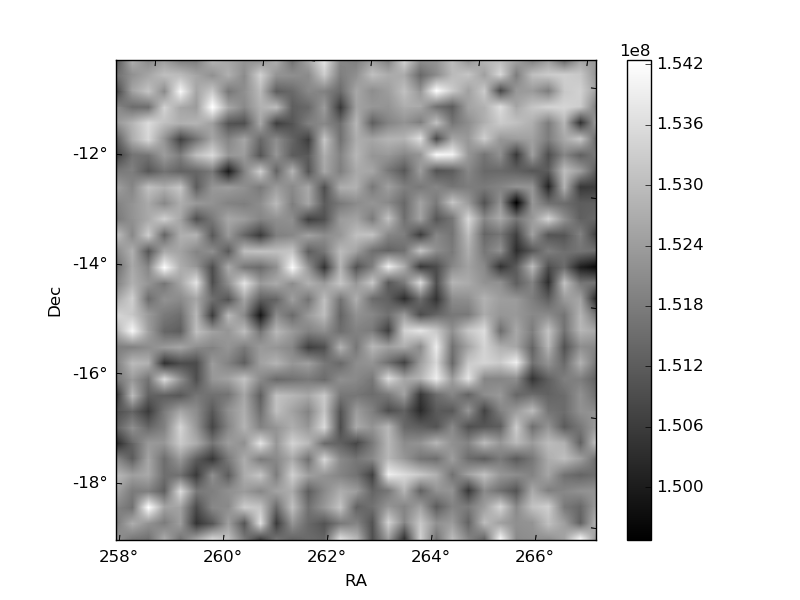
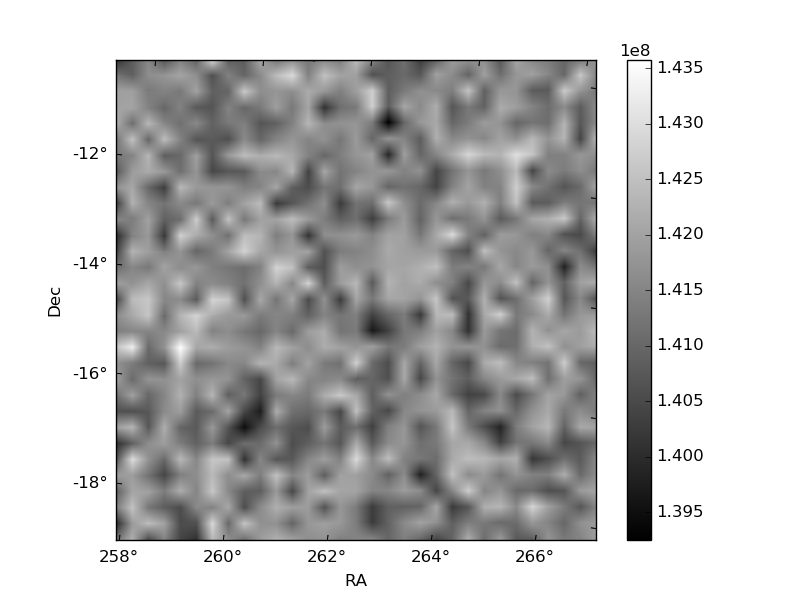
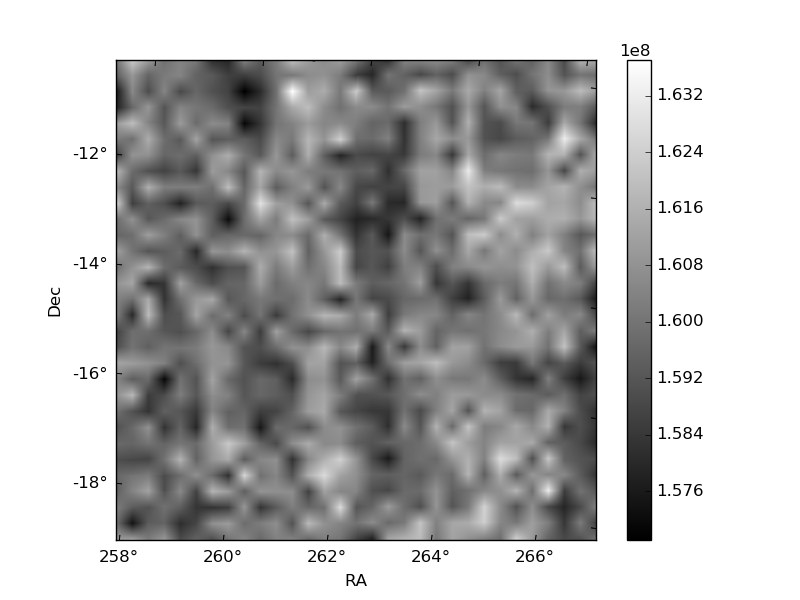
Histogram calculated using DETX and DETY for each event in the final _common_clean file
| Quadrant A | 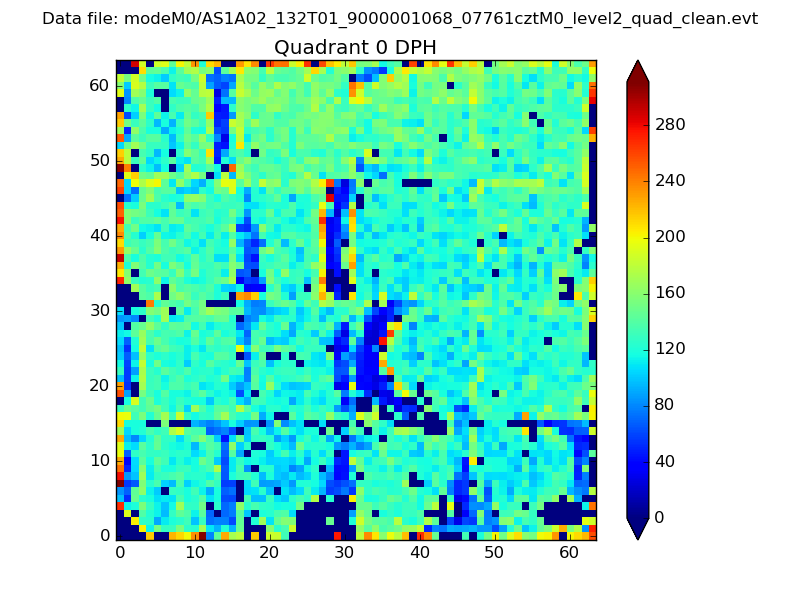 |
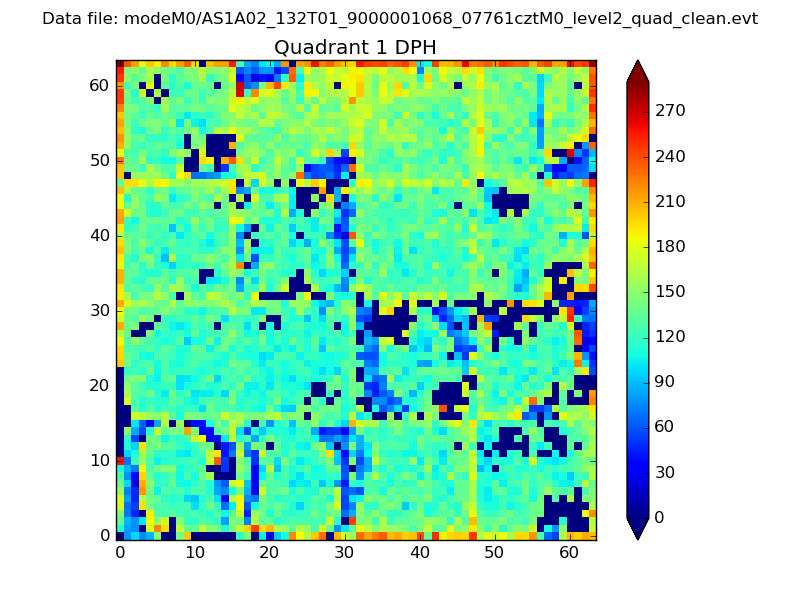 |
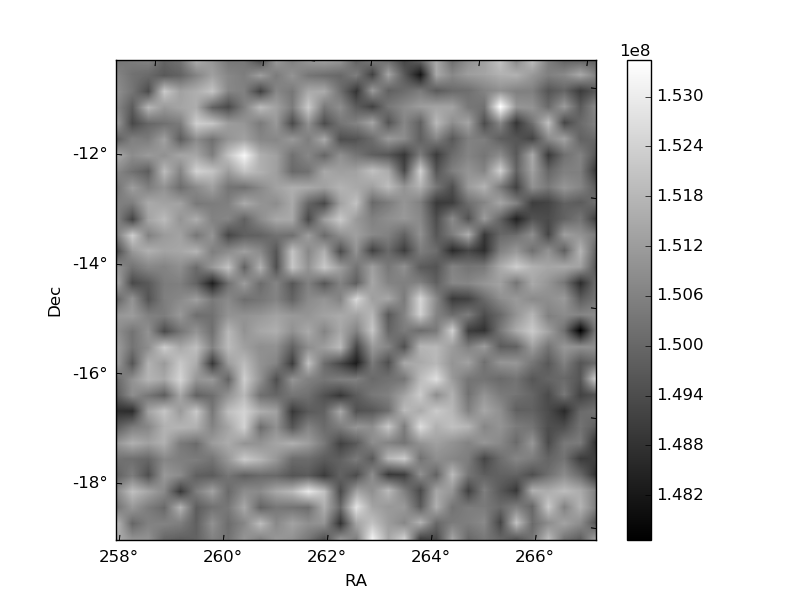
Quadrant B |
|---|---|---|---|
| Quadrant D | 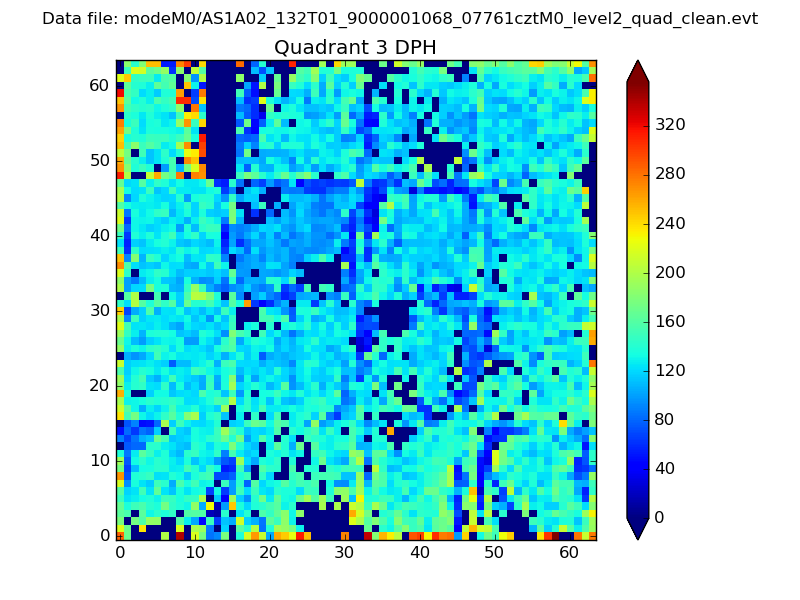 |
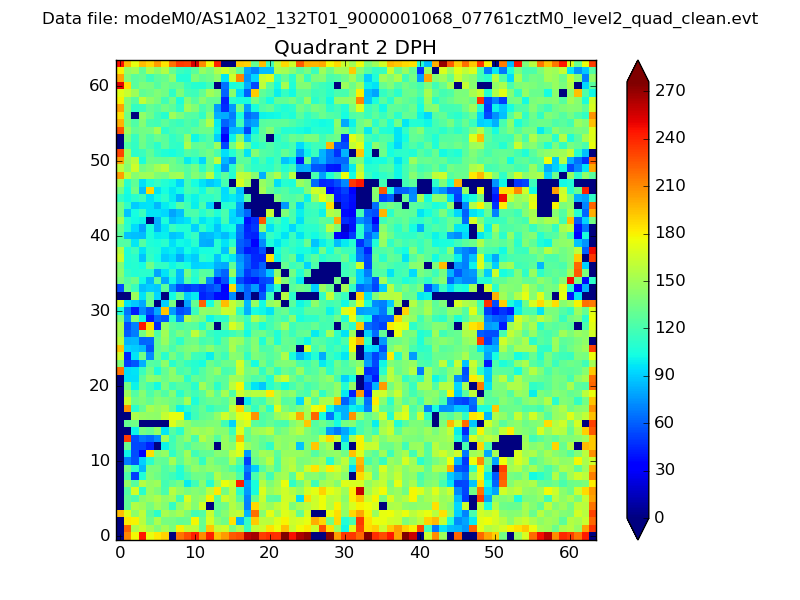 |
Quadrant C |
| Plot type | Count rate plots | Images |
|---|---|---|
| Comparison with Poisson distribution Blue bars denote a histogram of data divided into 1 sec bins. Red curve is a Poisson curve with rate = median count rate of data. |
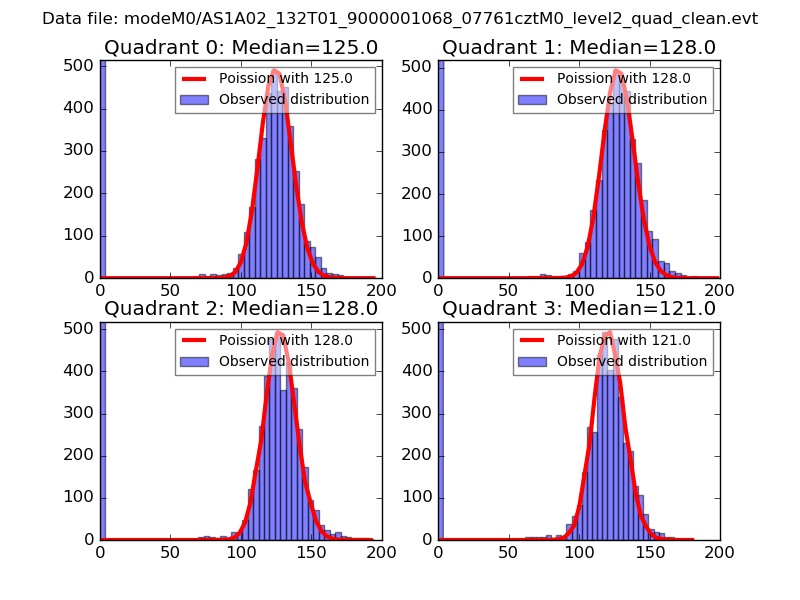 |
 |
| Quadrant-wise count rates Data is divided into 100 sec bins |
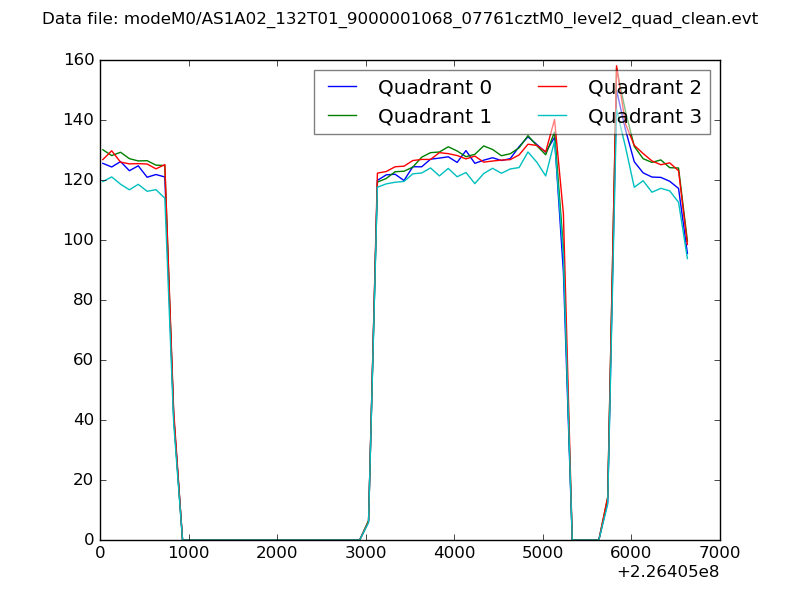 |
|
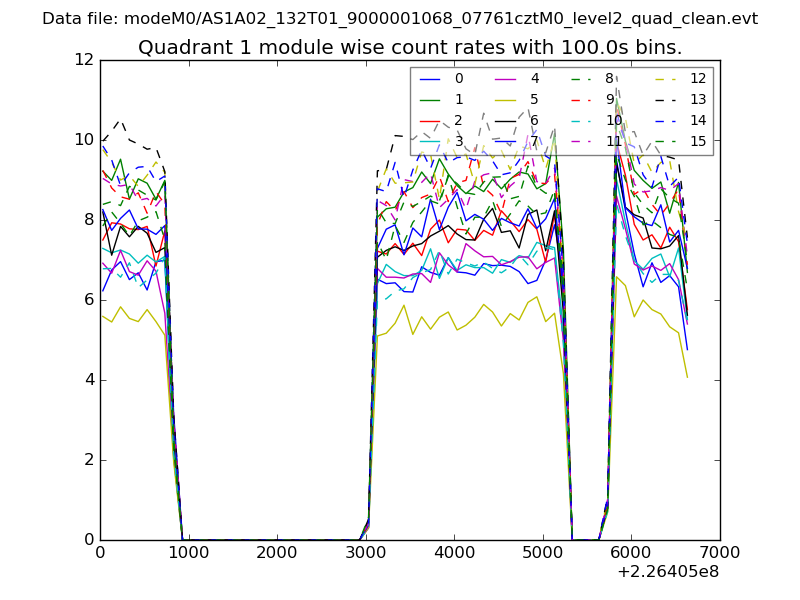
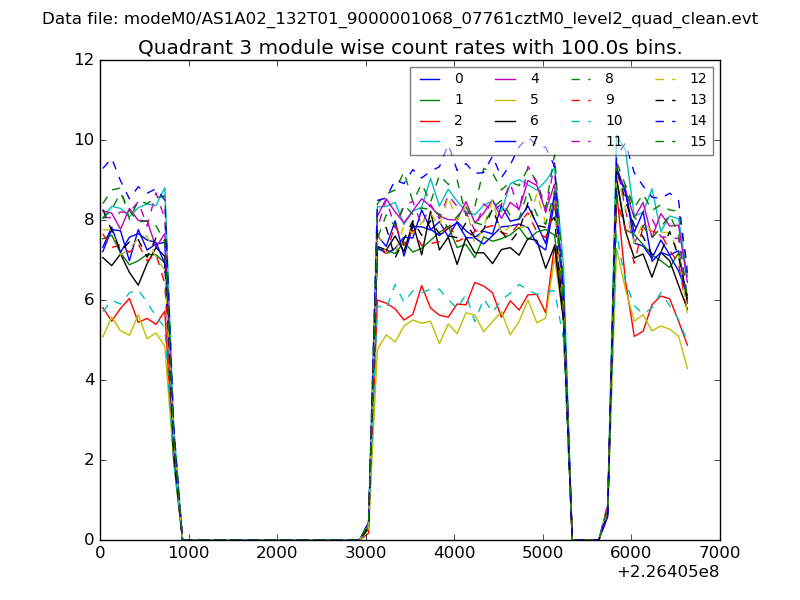
| Module-wise count rates for Quadrant A Data is divided into 100 sec bins |
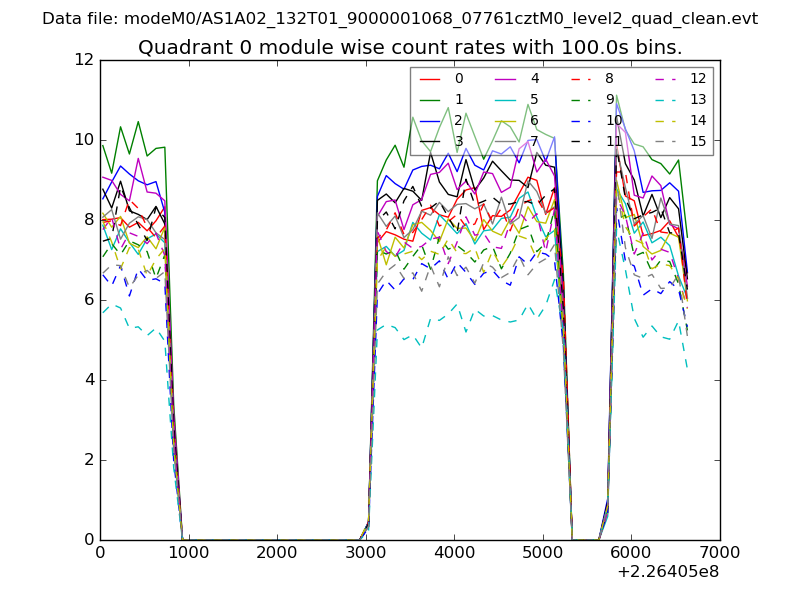 |
 |
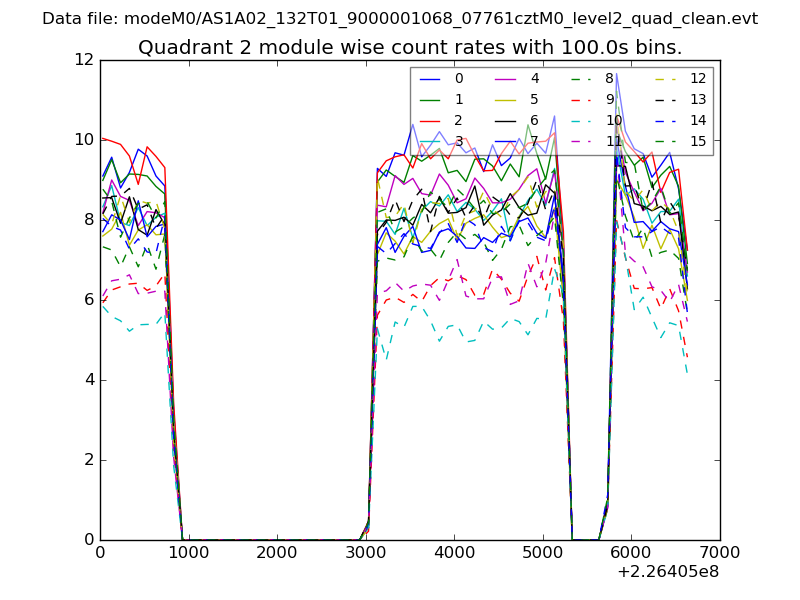
| Module-wise count rates for Quadrant B Data is divided into 100 sec bins |
 |
 |
| Module-wise count rates for Quadrant C Data is divided into 100 sec bins |
 |
 |
| Module-wise count rates for Quadrant D Data is divided into 100 sec bins |
 |
 |
| Parameter | Plot |
|---|---|
| CZT HV Monitor | 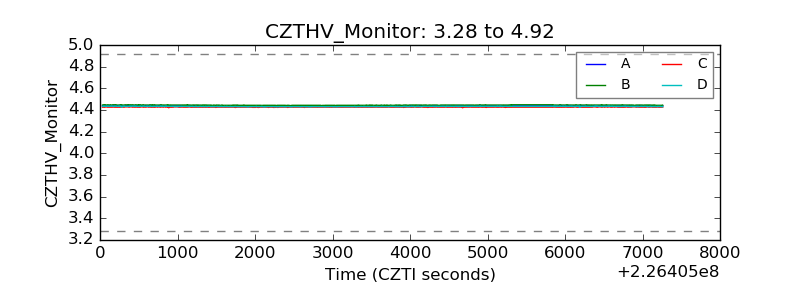 |
| D_VDD | 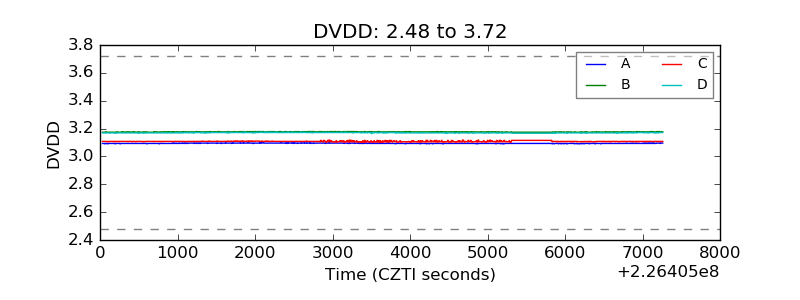 |
| Temperature 1 | 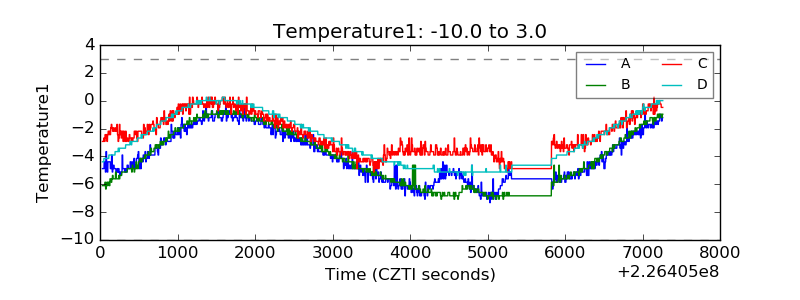 |
| Veto HV Monitor | 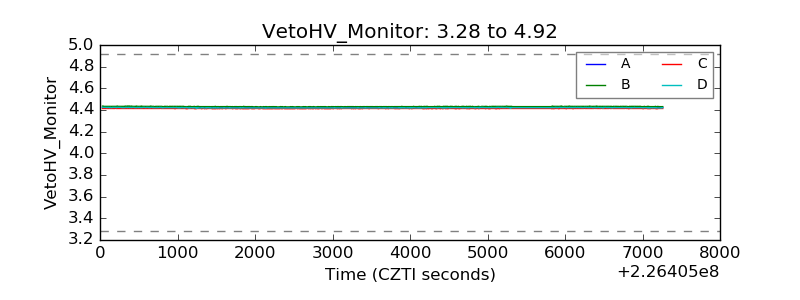 |
| Veto LLD | 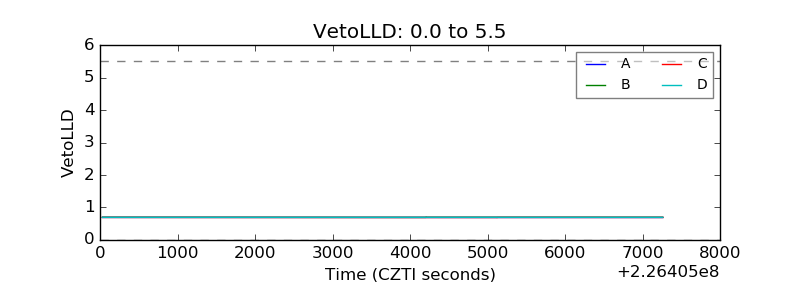 |
| Alpha Counter | 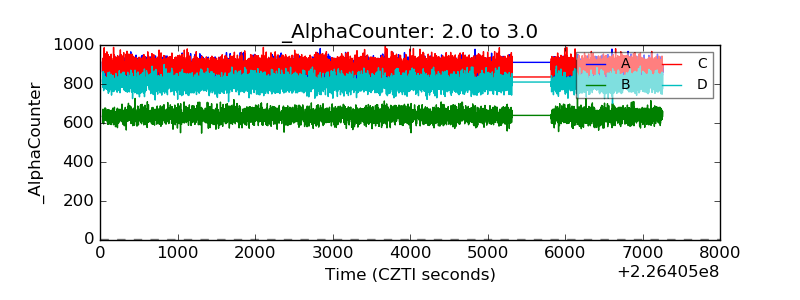 |
| _CPM_Rate | 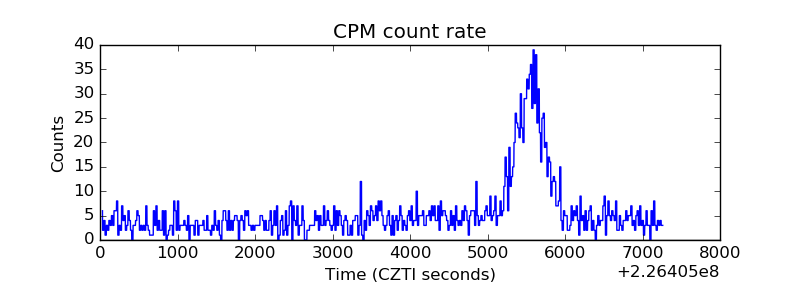 |
| CZT Counter | 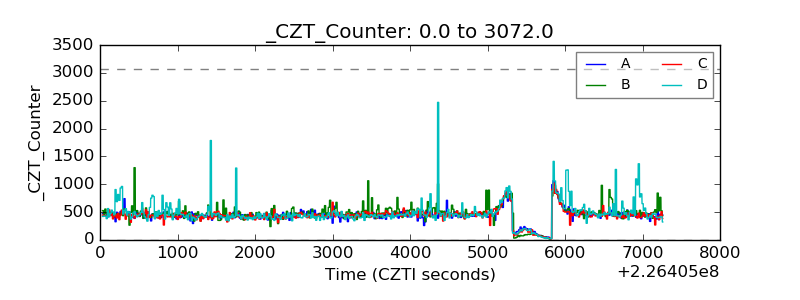 |
| +2.5 Volts monitor |  |
| +5 Volts monitor |  |
| _ROLL_ROT | 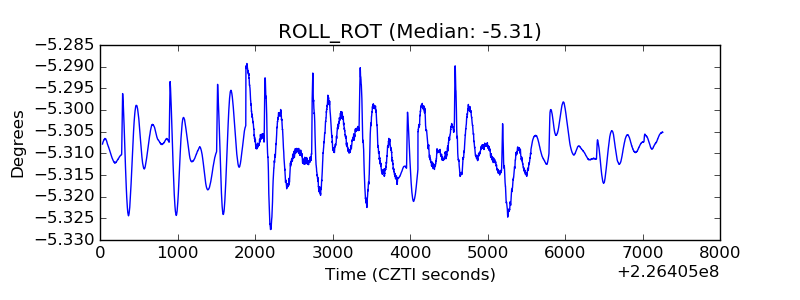 |
| _Roll_DEC | 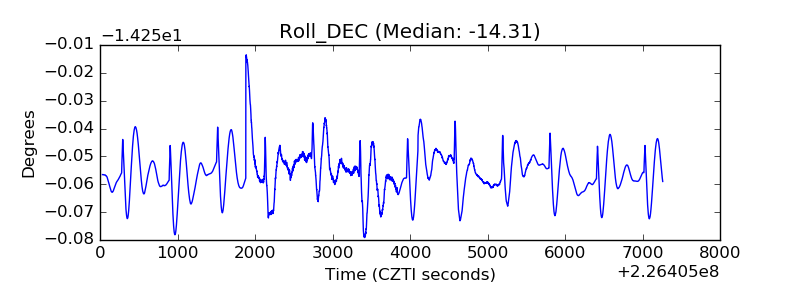 |
| _Roll_RA | 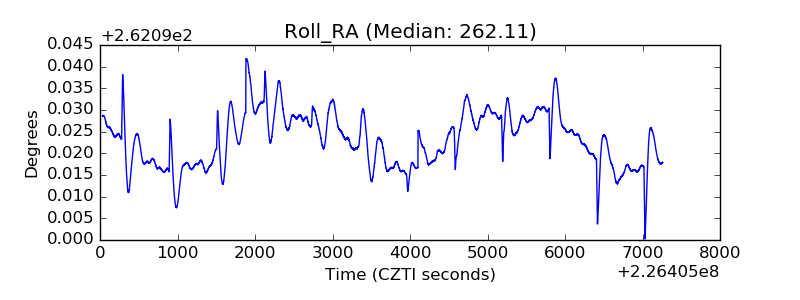 |
| Veto Counter | 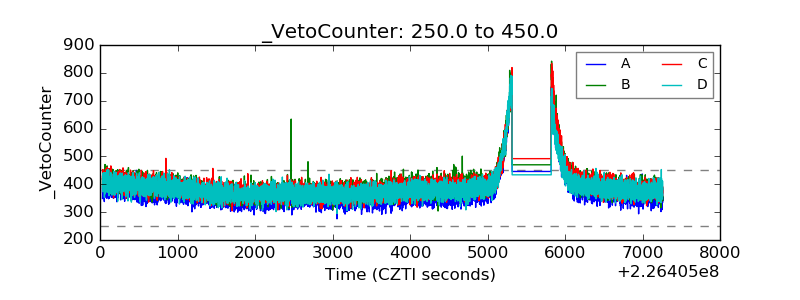 |