| Param | Original file | Final file |
|---|---|---|
| Filename | modeM0/AS1A02_132T01_9000001068_07762cztM0_level2.evt | modeM0/AS1A02_132T01_9000001068_07762cztM0_level2_quad_clean.evt |
| Size (bytes) | 521,974,080 | 85,138,560 |
| Size | 497.8 MB | 81.2 MB |
| Events in quadrant A | 3,680,037 | 507,766 |
| Events in quadrant B | 3,911,473 | 517,728 |
| Events in quadrant C | 3,669,769 | 521,921 |
| Events in quadrant D | 4,022,332 | 493,573 |
| Mode M0 | |||
|---|---|---|---|
| Quadrant | BADHDUFLAG | Total packets | Discarded packets |
| A | 0 | 16241 | 2 |
| B | 0 | 16569 | 1 |
| C | 0 | 16302 | 1 |
| D | 0 | 17363 | 1 |
| Mode SS | |||
|---|---|---|---|
| Quadrant | BADHDUFLAG | Total packets | Discarded packets |
| A | 0 | 156 | 0 |
| B | 0 | 156 | 0 |
| C | 0 | 156 | 0 |
| D | 0 | 156 | 0 |
| Quadrant | Total seconds | Saturated seconds | Saturation percentage |
|---|---|---|---|
| A | 7709 | 344 | 4.462317% |
| B | 7709 | 352 | 4.566092% |
| C | 7709 | 282 | 3.658062% |
| D | 7709 | 323 | 4.189908% |
Noise dominated data is calculated using 1-second bins in cleaned event files. If a bin has >2000 counts, and if more than 50% of those come from <1% of pixels, then it is considered to be noise-dominated and hence unusable.
| Quadrant | # 1 sec bins | Bins with >0 counts | Bins with >2000 counts | High rate bins dominated by noise | Noise dominated (total time) | Noise dominated (detector-on time) | Marked lightcurve |
|---|---|---|---|---|---|---|---|
| A | 7724 | 7709 | 0 | 0 | 0.00% | 0.00% | 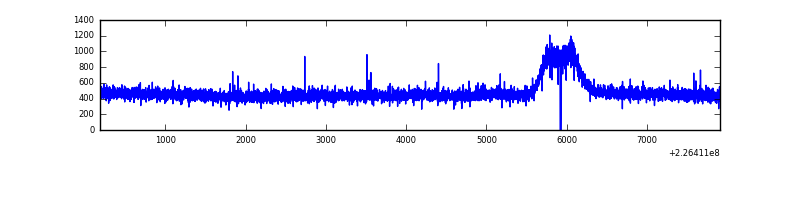 |
| B | 7724 | 7709 | 7 | 7 | 0.09% | 0.09% | 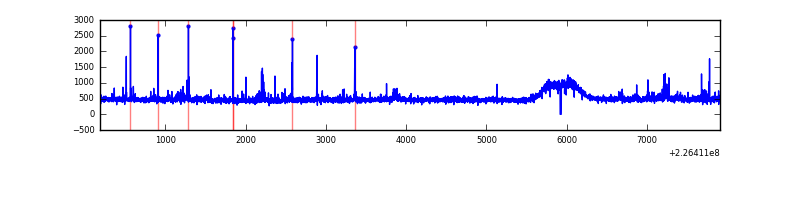 |
| C | 7724 | 7709 | 0 | 0 | 0.00% | 0.00% | 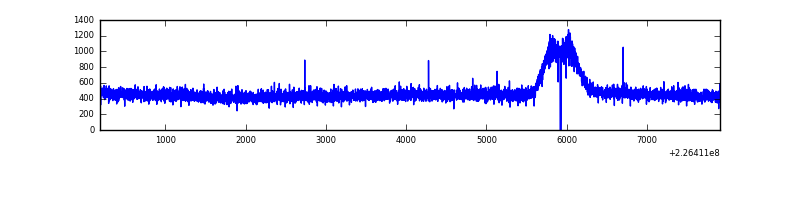 |
| D | 7724 | 7709 | 11 | 11 | 0.14% | 0.14% |  |
Top three noisy pixels from each quadrant. If the there are fewer than three noisy pixels in the level2.evt file, extra rows are filled as -1
| Pixel properties | Quadrant properties | ||||||
|---|---|---|---|---|---|---|---|
| Quadrant | DetID | PixID | Counts | Sigma | Mean | Median | Sigma |
| A | 0 | 226 | 8870 | 39.79 | 954 | 927 | 199.6 |
| A | 12 | 194 | 8574 | 38.31 | 954 | 927 | 199.6 |
| A | 13 | 248 | 4147 | 16.13 | 954 | 927 | 199.6 |
| B | 4 | 173 | 68925 | 365.18 | 956 | 932 | 186.2 |
| B | 0 | 214 | 33092 | 172.73 | 956 | 932 | 186.2 |
| B | 15 | 204 | 18781 | 95.86 | 956 | 932 | 186.2 |
| C | 13 | 61 | 6992 | 27.31 | 937 | 942 | 221.5 |
| C | 8 | 128 | 5017 | 18.39 | 937 | 942 | 221.5 |
| C | 8 | 222 | 4681 | 16.87 | 937 | 942 | 221.5 |
| D | 1 | 52 | 238346 | 1017.81 | 938 | 909 | 233.3 |
| D | 2 | 152 | 97651 | 414.7 | 938 | 909 | 233.3 |
| D | 2 | 14 | 30286 | 125.93 | 938 | 909 | 233.3 |
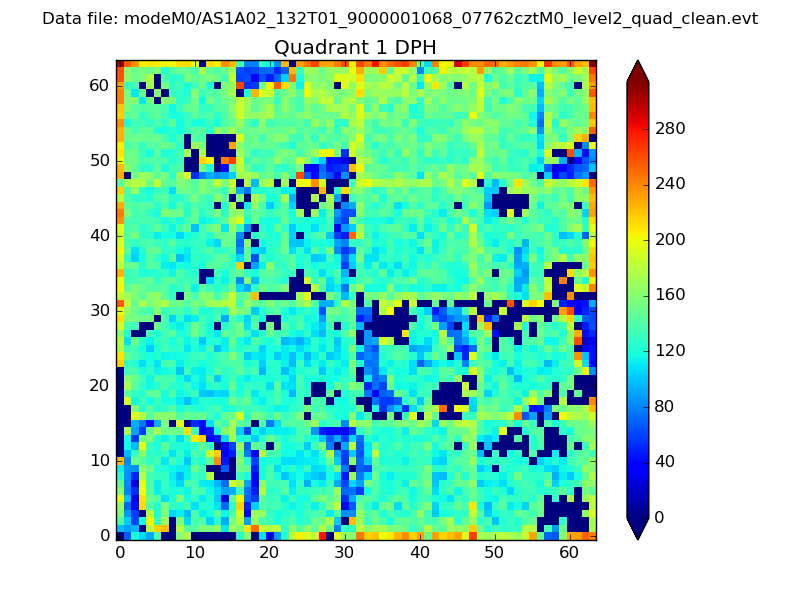
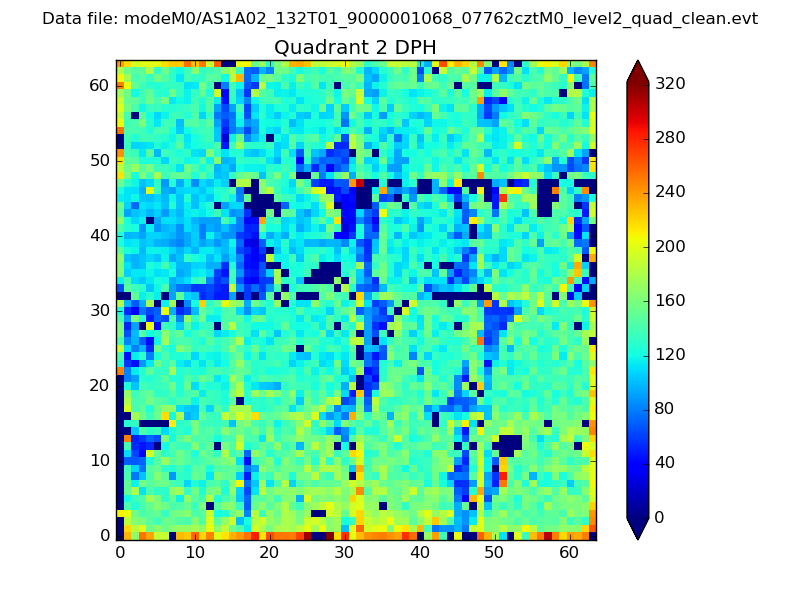
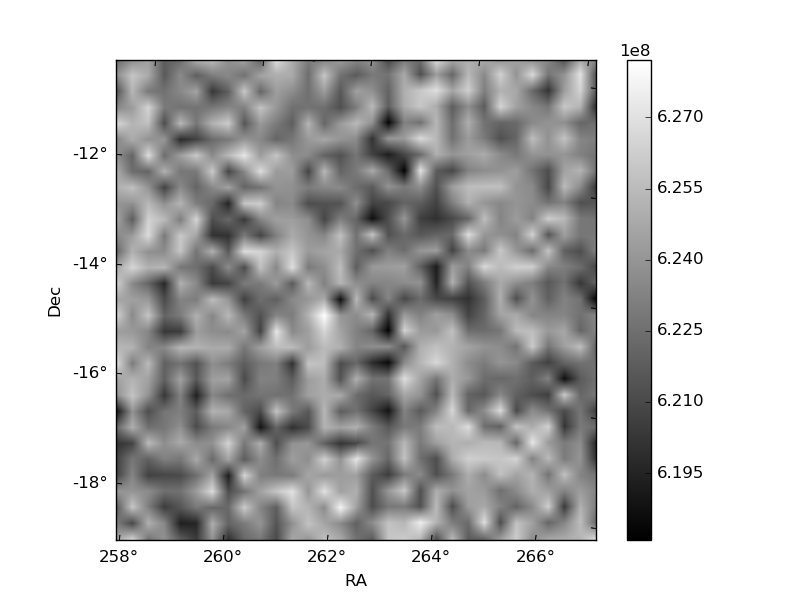
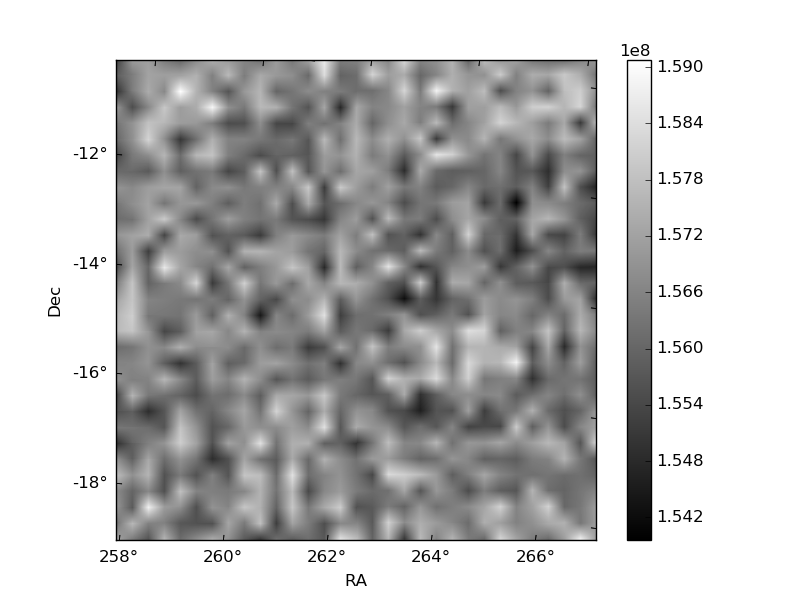
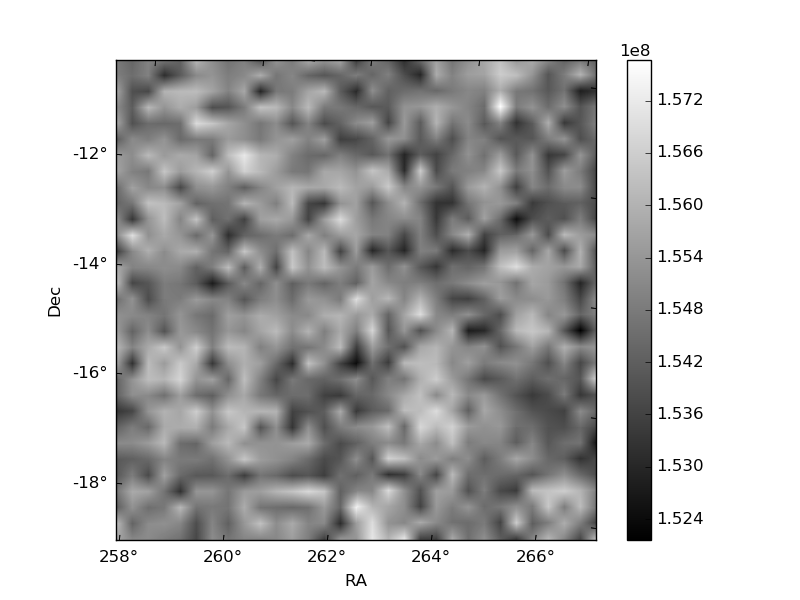
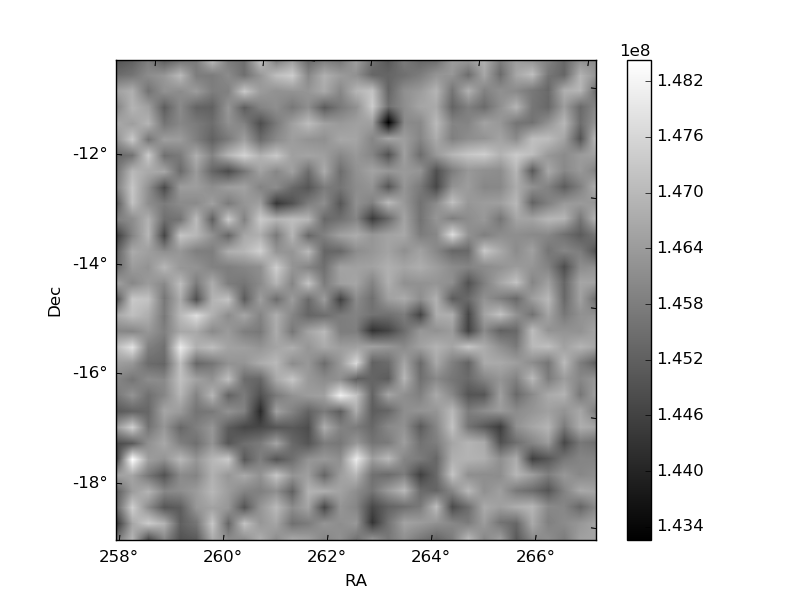
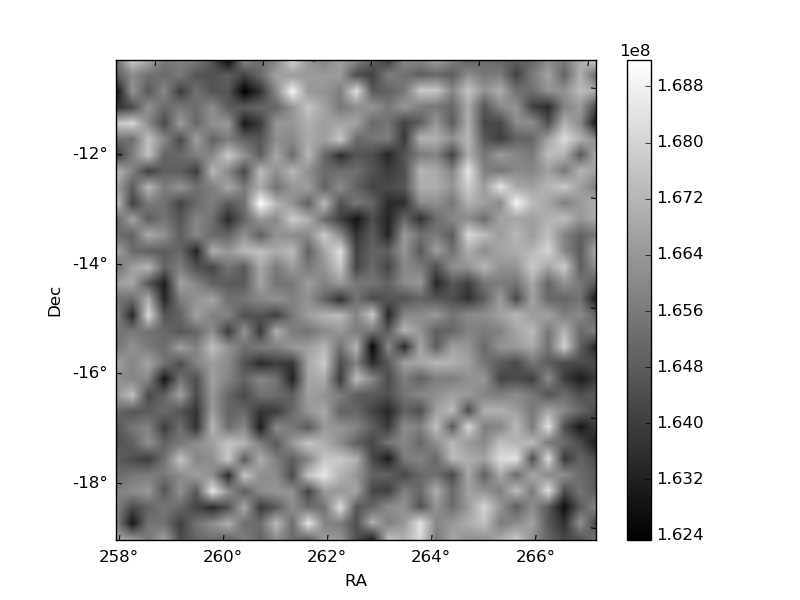
Histogram calculated using DETX and DETY for each event in the final _common_clean file
| Quadrant A | 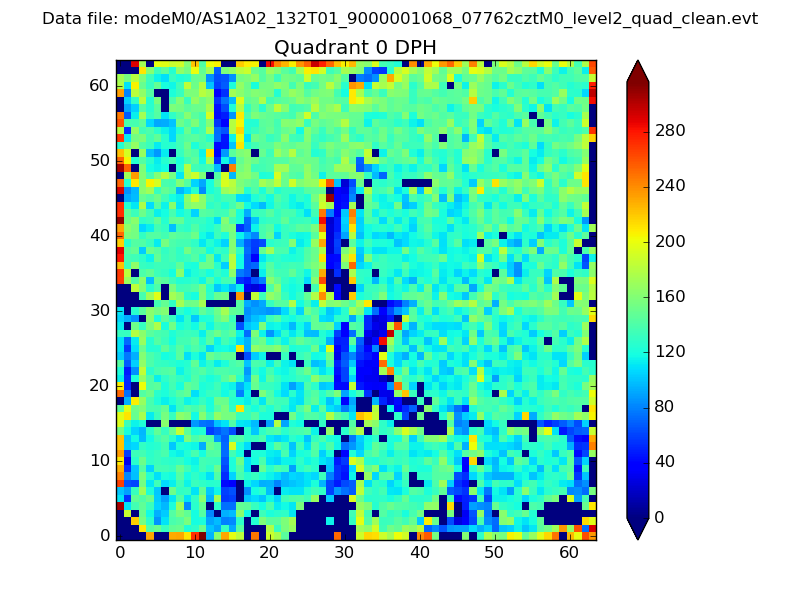 |
 |
Quadrant B |
|---|---|---|---|
| Quadrant D | 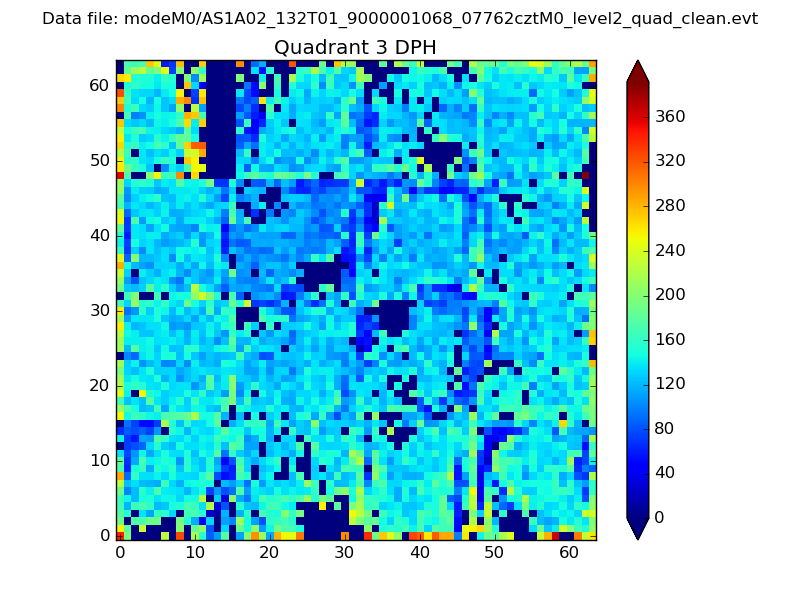 |
 |
Quadrant C |
| Plot type | Count rate plots | Images |
|---|---|---|
| Comparison with Poisson distribution Blue bars denote a histogram of data divided into 1 sec bins. Red curve is a Poisson curve with rate = median count rate of data. |
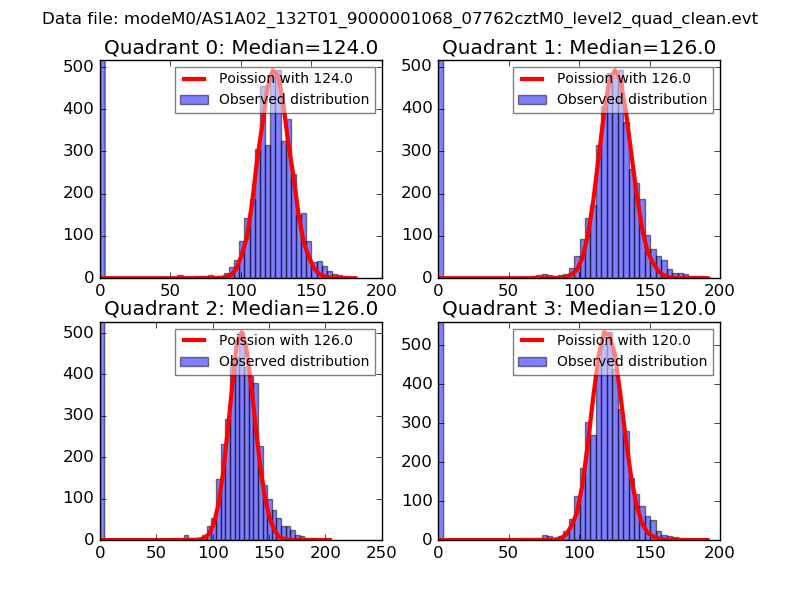 |
 |
| Quadrant-wise count rates Data is divided into 100 sec bins |
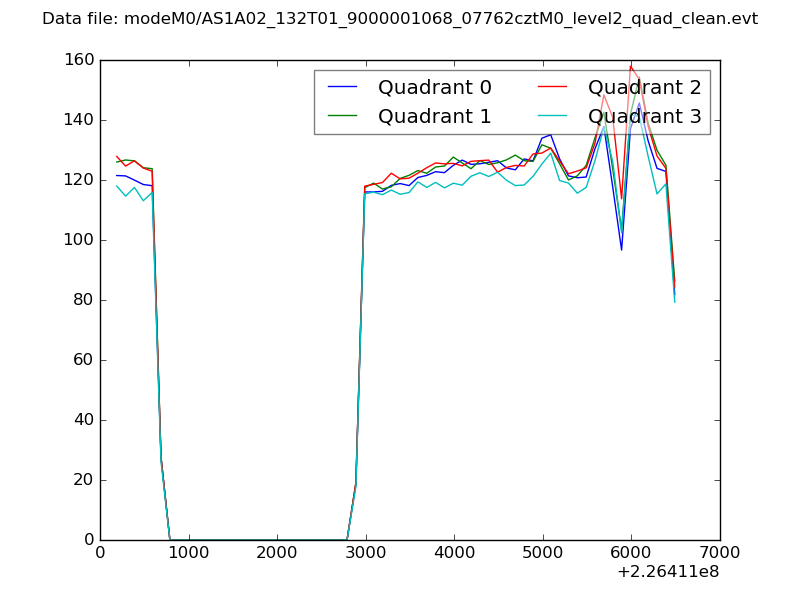 |
|
| Module-wise count rates for Quadrant A Data is divided into 100 sec bins |
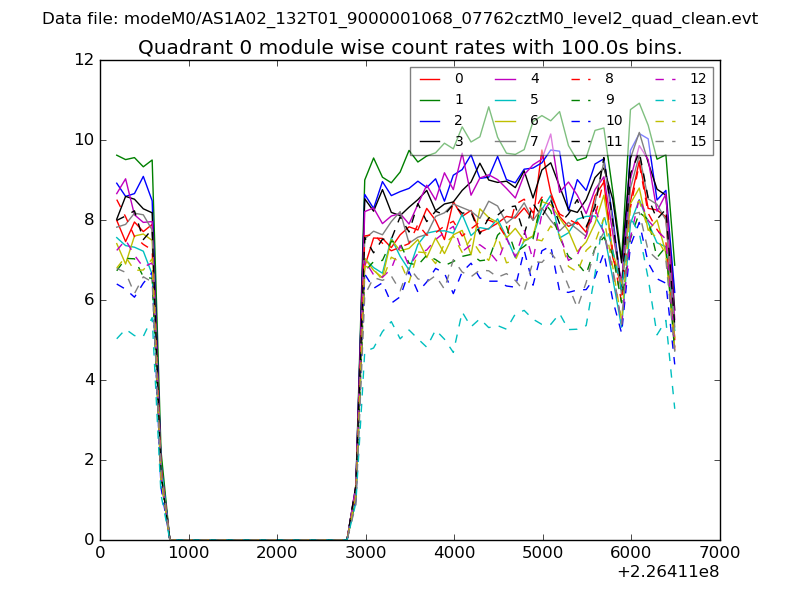 |
 |
| Module-wise count rates for Quadrant B Data is divided into 100 sec bins |
 |
 |
| Module-wise count rates for Quadrant C Data is divided into 100 sec bins |
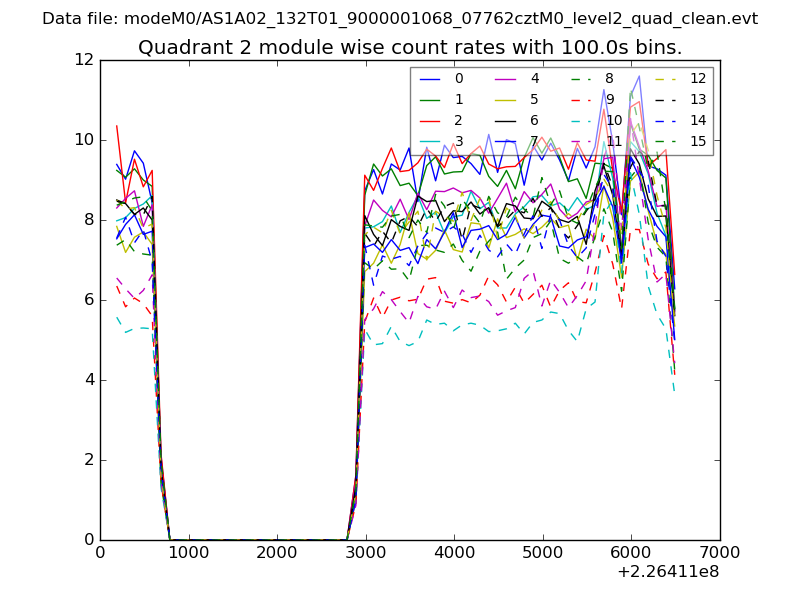 |
 |
| Module-wise count rates for Quadrant D Data is divided into 100 sec bins |
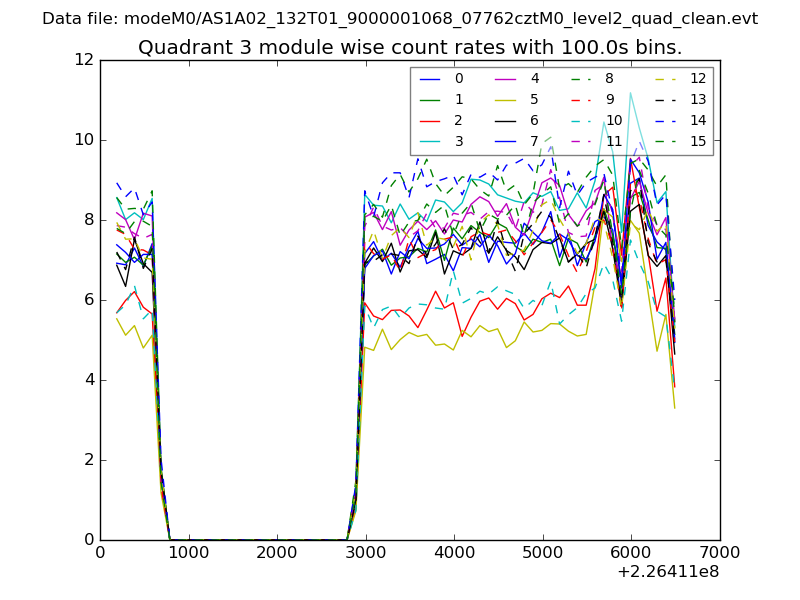 |
 |
| Parameter | Plot |
|---|---|
| CZT HV Monitor |  |
| D_VDD | 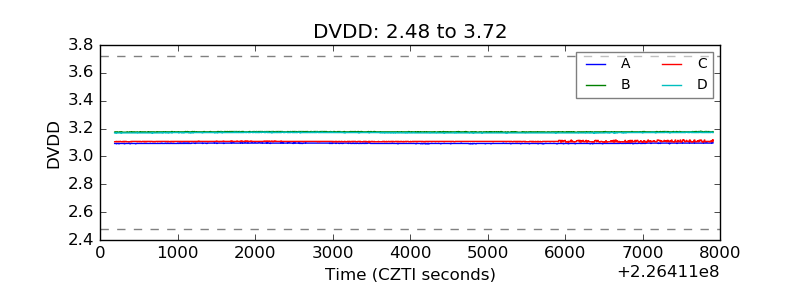 |
| Temperature 1 | 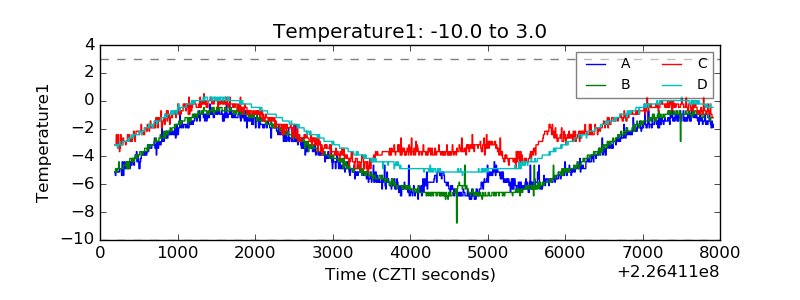 |
| Veto HV Monitor | 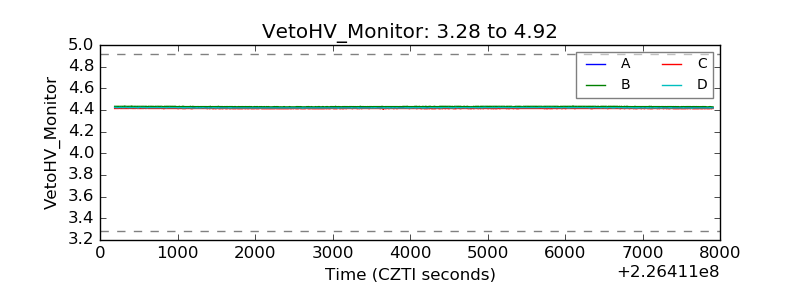 |
| Veto LLD | 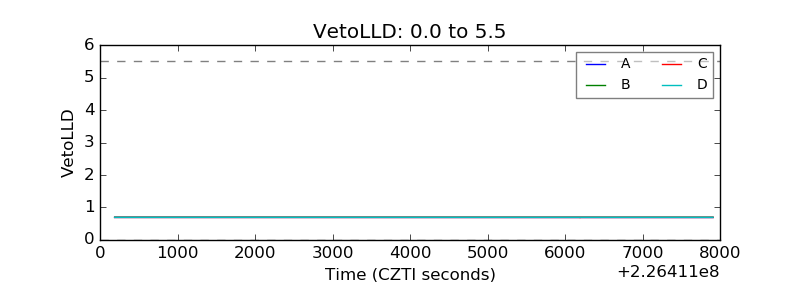 |
| Alpha Counter | 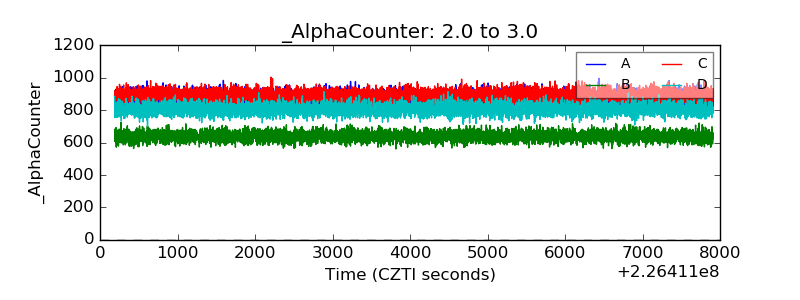 |
| _CPM_Rate | 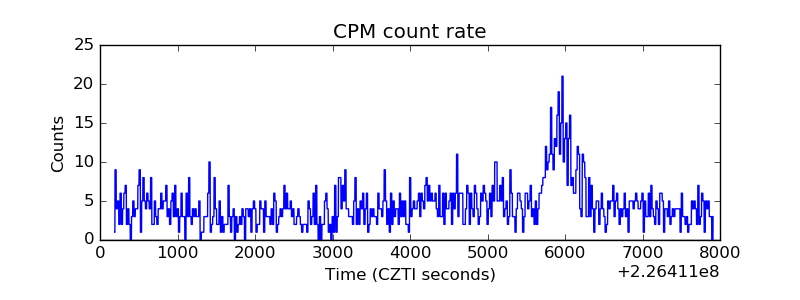 |
| CZT Counter | 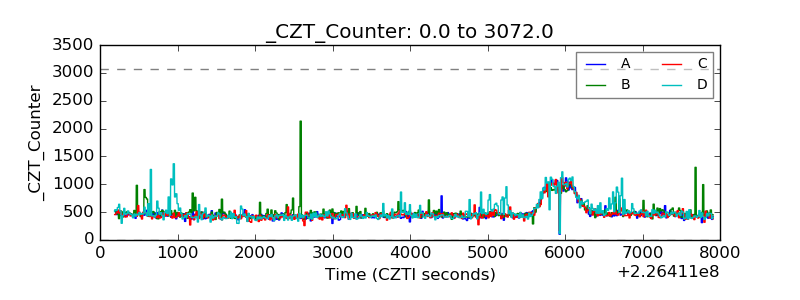 |
| +2.5 Volts monitor |  |
| +5 Volts monitor |  |
| _ROLL_ROT | 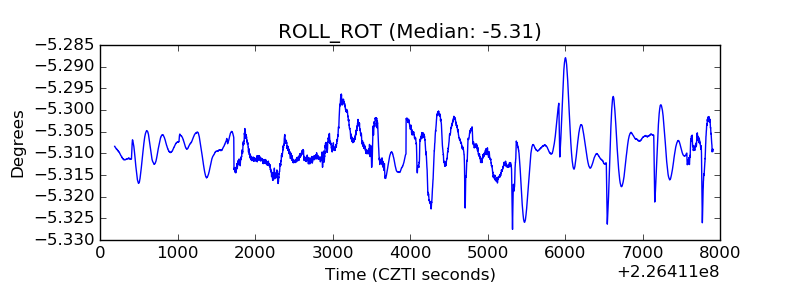 |
| _Roll_DEC | 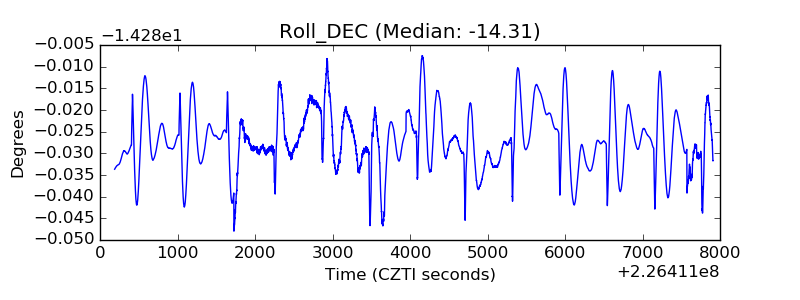 |
| _Roll_RA | 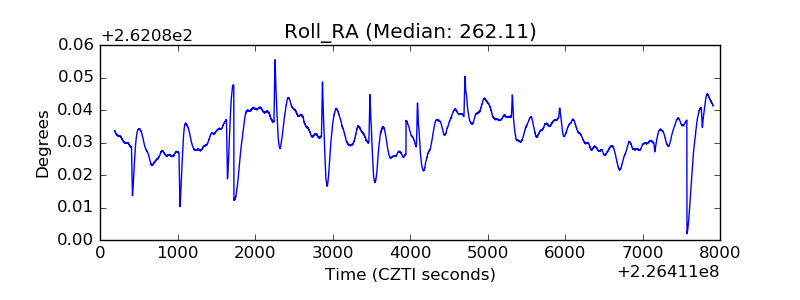 |
| Veto Counter |  |