| Param | Original file | Final file |
|---|---|---|
| Filename | modeM0/AS1A02_132T01_9000001068_07763cztM0_level2.evt | modeM0/AS1A02_132T01_9000001068_07763cztM0_level2_quad_clean.evt |
| Size (bytes) | 522,774,720 | 79,079,040 |
| Size | 498.6 MB | 75.4 MB |
| Events in quadrant A | 3,641,106 | 462,957 |
| Events in quadrant B | 4,073,543 | 470,626 |
| Events in quadrant C | 3,641,515 | 472,116 |
| Events in quadrant D | 3,947,433 | 447,680 |
| Mode M0 | |||
|---|---|---|---|
| Quadrant | BADHDUFLAG | Total packets | Discarded packets |
| A | 0 | 16167 | 2 |
| B | 0 | 17121 | 1 |
| C | 0 | 16180 | 1 |
| D | 0 | 17125 | 1 |
| Mode SS | |||
|---|---|---|---|
| Quadrant | BADHDUFLAG | Total packets | Discarded packets |
| A | 0 | 158 | 0 |
| B | 0 | 158 | 0 |
| C | 0 | 158 | 0 |
| D | 0 | 158 | 0 |
| Mode M9 | |||
|---|---|---|---|
| Quadrant | BADHDUFLAG | Total packets | Discarded packets |
| A | 0 | 2 | 0 |
| B | 0 | 2 | 0 |
| C | 0 | 2 | 0 |
| D | 0 | 2 | 0 |
| Quadrant | Total seconds | Saturated seconds | Saturation percentage |
|---|---|---|---|
| A | 7784 | 184 | 2.363823% |
| B | 7784 | 266 | 3.417266% |
| C | 7784 | 134 | 1.721480% |
| D | 7784 | 157 | 2.016958% |
Noise dominated data is calculated using 1-second bins in cleaned event files. If a bin has >2000 counts, and if more than 50% of those come from <1% of pixels, then it is considered to be noise-dominated and hence unusable.
| Quadrant | # 1 sec bins | Bins with >0 counts | Bins with >2000 counts | High rate bins dominated by noise | Noise dominated (total time) | Noise dominated (detector-on time) | Marked lightcurve |
|---|---|---|---|---|---|---|---|
| A | 7949 | 7784 | 0 | 0 | 0.00% | 0.00% | 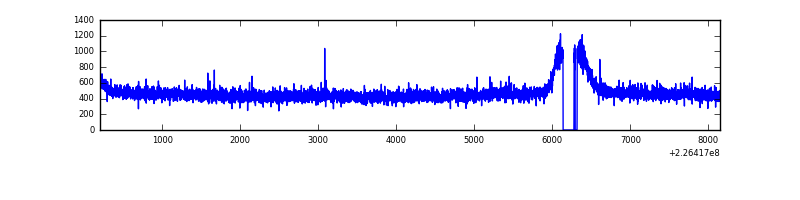 |
| B | 7949 | 7784 | 61 | 61 | 0.77% | 0.78% | 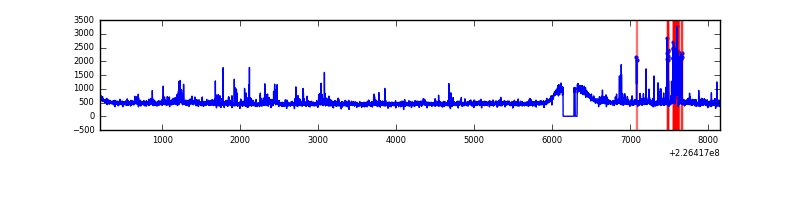 |
| C | 7949 | 7785 | 0 | 0 | 0.00% | 0.00% | 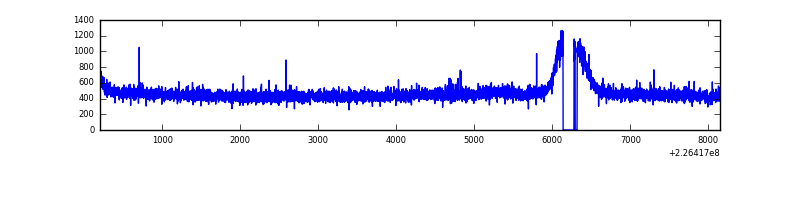 |
| D | 7949 | 7785 | 16 | 16 | 0.20% | 0.21% | 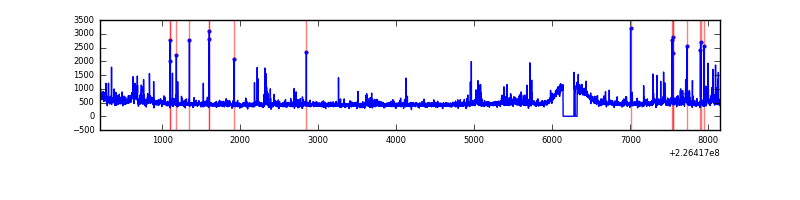 |
Top three noisy pixels from each quadrant. If the there are fewer than three noisy pixels in the level2.evt file, extra rows are filled as -1
| Pixel properties | Quadrant properties | ||||||
|---|---|---|---|---|---|---|---|
| Quadrant | DetID | PixID | Counts | Sigma | Mean | Median | Sigma |
| A | 0 | 226 | 8834 | 40.64 | 944 | 921 | 194.7 |
| A | 12 | 194 | 8332 | 38.06 | 944 | 921 | 194.7 |
| A | 13 | 254 | 3696 | 14.25 | 944 | 921 | 194.7 |
| B | 0 | 229 | 200300 | 1081.74 | 947 | 923 | 184.3 |
| B | 4 | 173 | 115487 | 621.58 | 947 | 923 | 184.3 |
| B | 0 | 214 | 22597 | 117.59 | 947 | 923 | 184.3 |
| C | 8 | 128 | 11724 | 49.61 | 924 | 930 | 217.6 |
| C | 13 | 61 | 7270 | 29.14 | 924 | 930 | 217.6 |
| C | 8 | 112 | 6781 | 26.89 | 924 | 930 | 217.6 |
| D | 2 | 152 | 186194 | 801.91 | 926 | 898 | 231.1 |
| D | 1 | 52 | 85669 | 366.87 | 926 | 898 | 231.1 |
| D | 7 | 55 | 60773 | 259.12 | 926 | 898 | 231.1 |
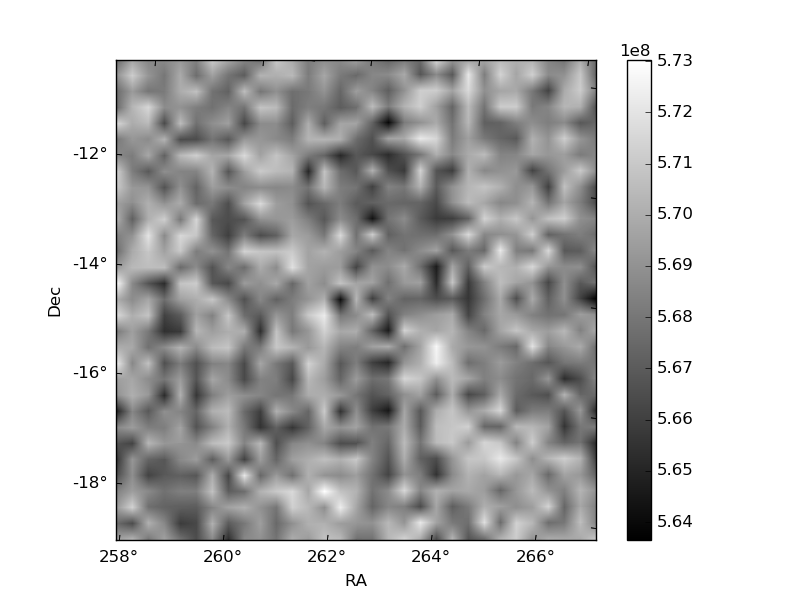
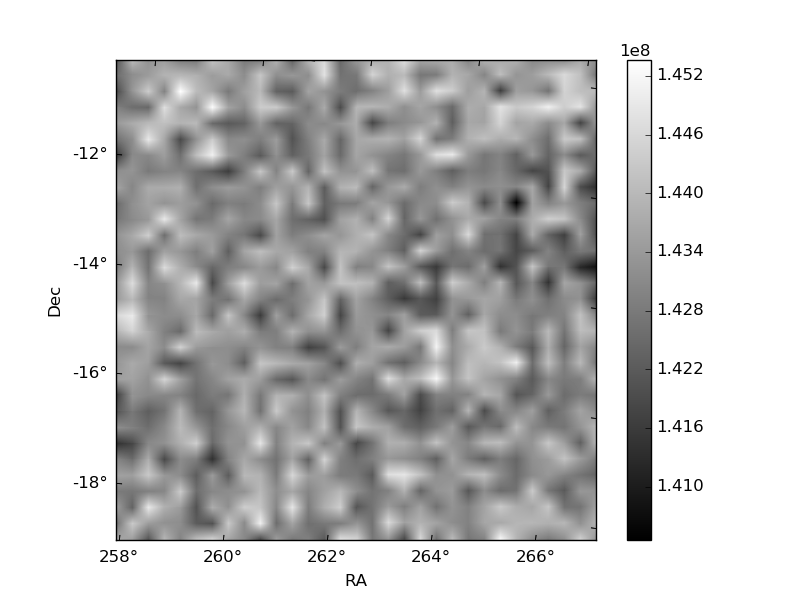
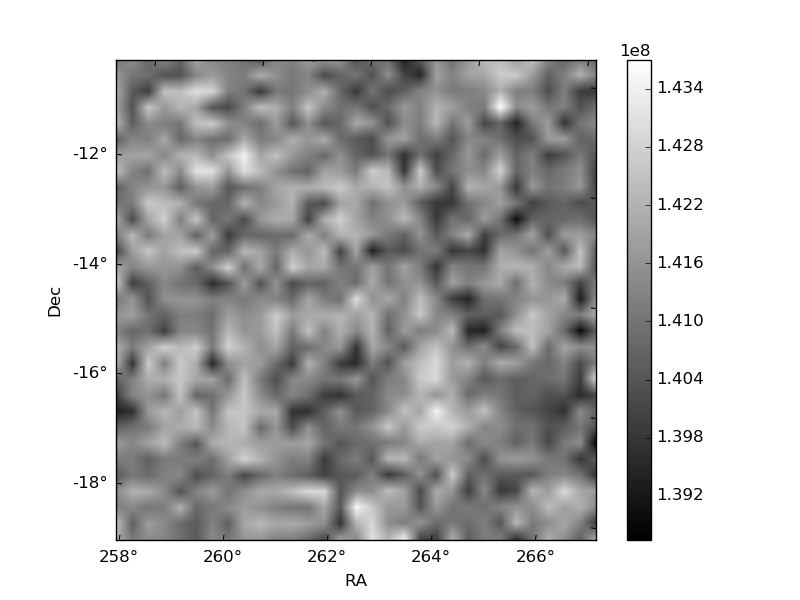
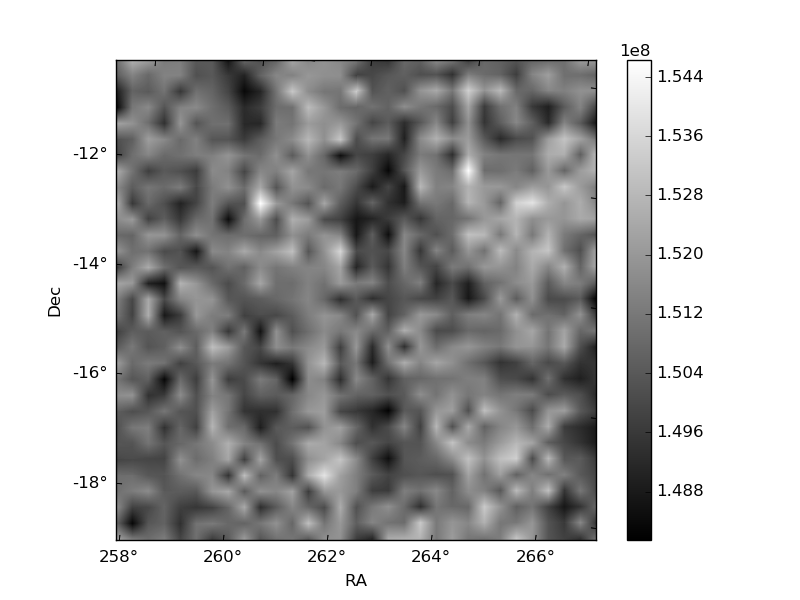
Histogram calculated using DETX and DETY for each event in the final _common_clean file
| Quadrant A | 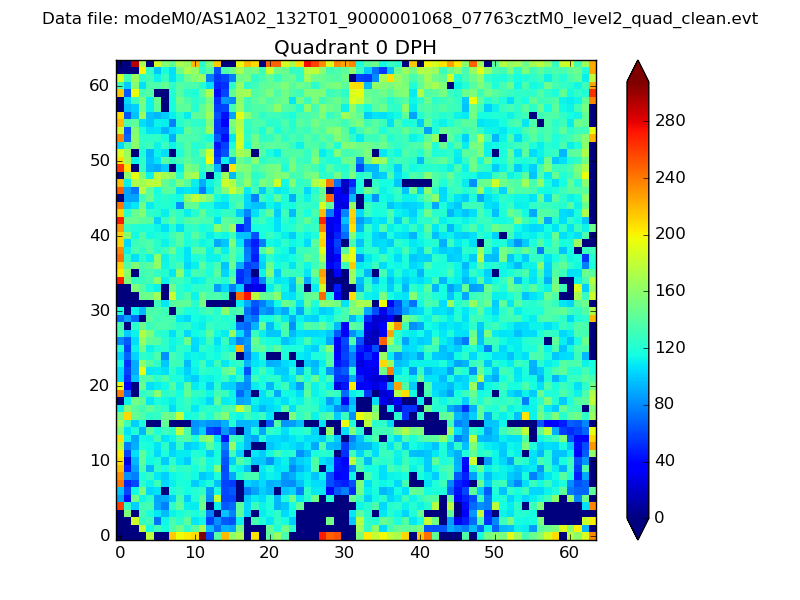 |
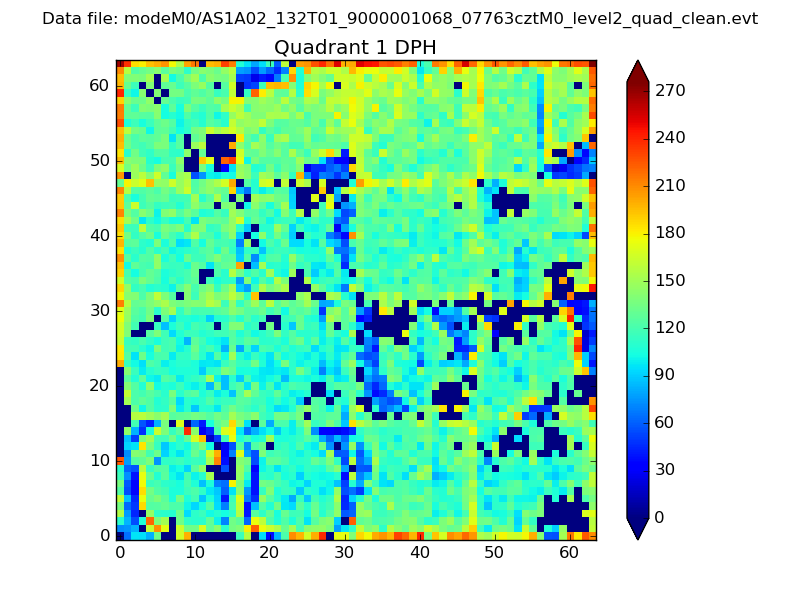 |
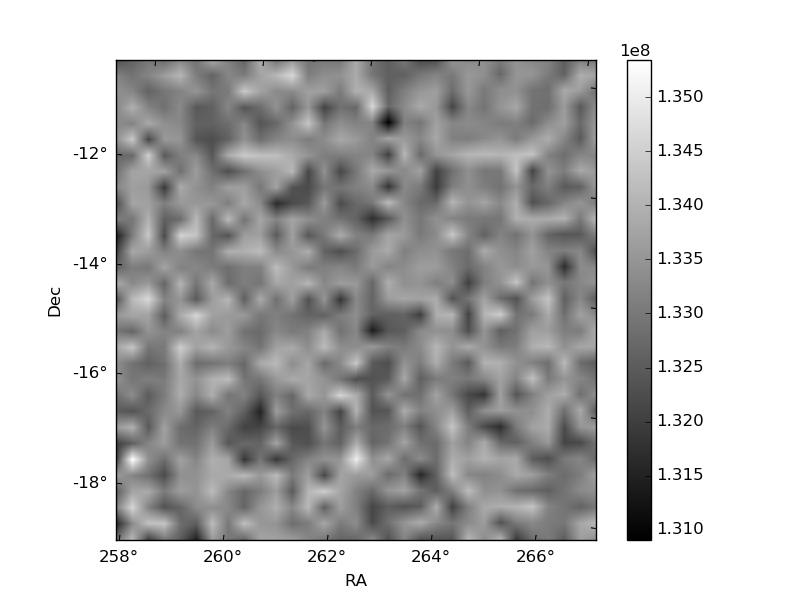
Quadrant B |
|---|---|---|---|
| Quadrant D | 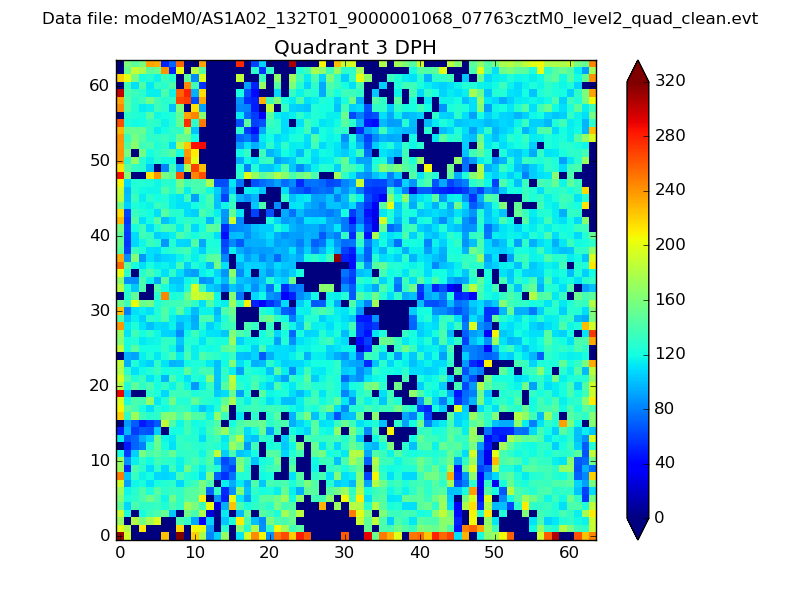 |
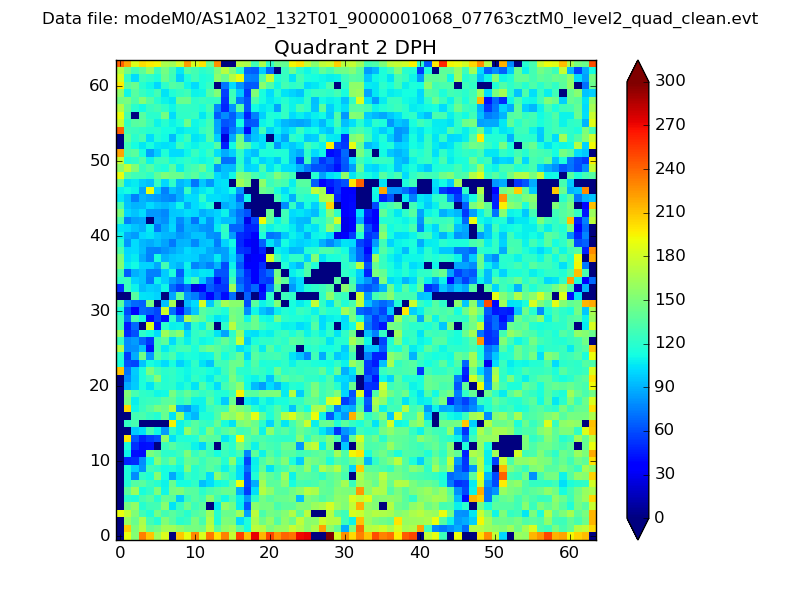 |
Quadrant C |
| Plot type | Count rate plots | Images |
|---|---|---|
| Comparison with Poisson distribution Blue bars denote a histogram of data divided into 1 sec bins. Red curve is a Poisson curve with rate = median count rate of data. |
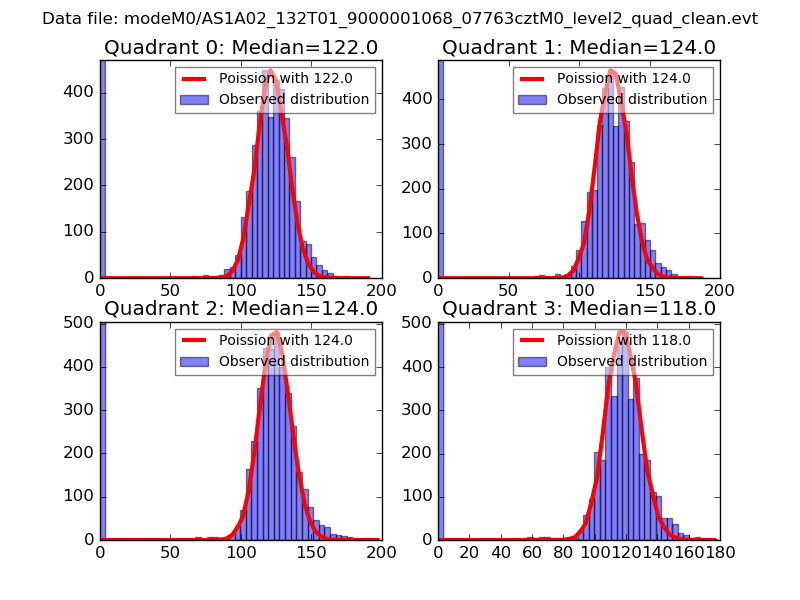 |
 |
| Quadrant-wise count rates Data is divided into 100 sec bins |
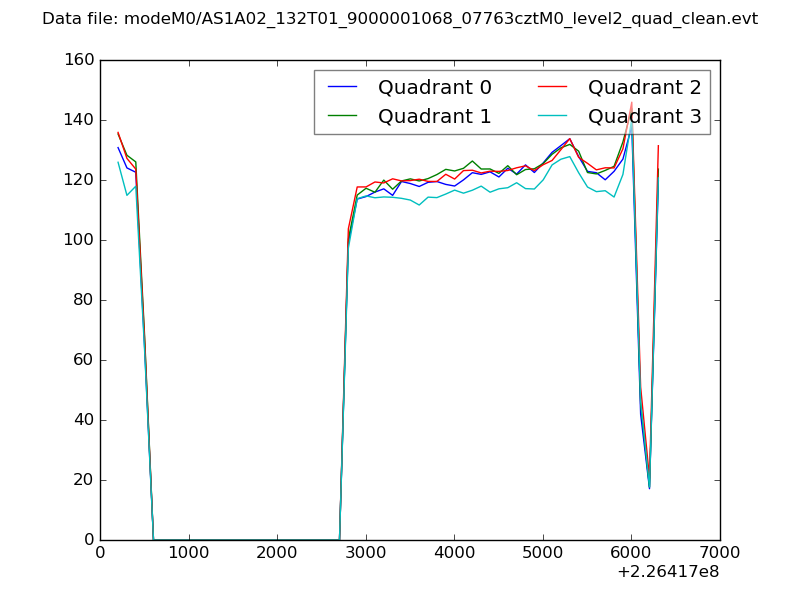 |
|
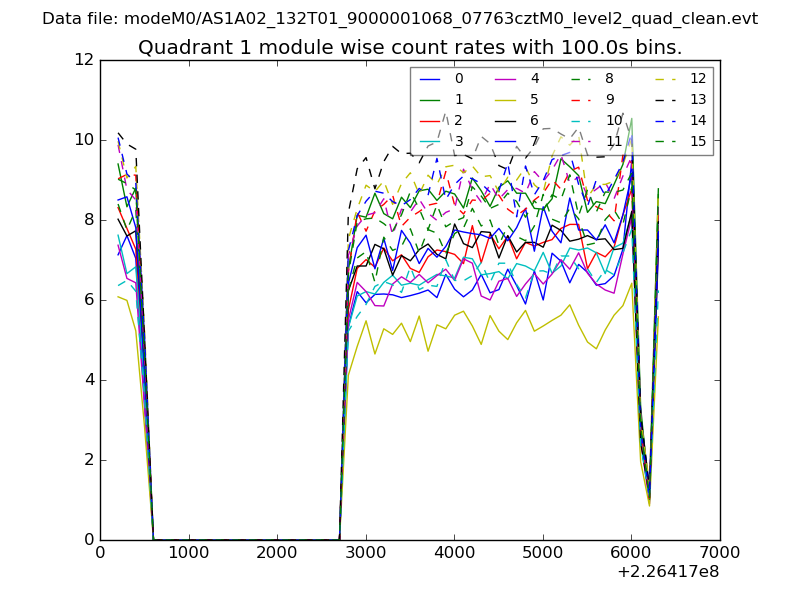
| Module-wise count rates for Quadrant A Data is divided into 100 sec bins |
 |
 |
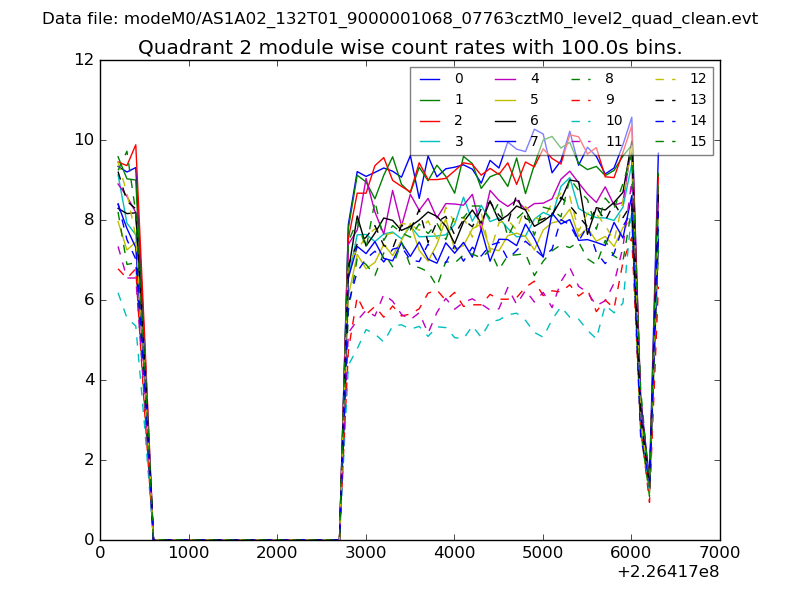
| Module-wise count rates for Quadrant B Data is divided into 100 sec bins |
 |
 |
| Module-wise count rates for Quadrant C Data is divided into 100 sec bins |
 |
 |
| Module-wise count rates for Quadrant D Data is divided into 100 sec bins |
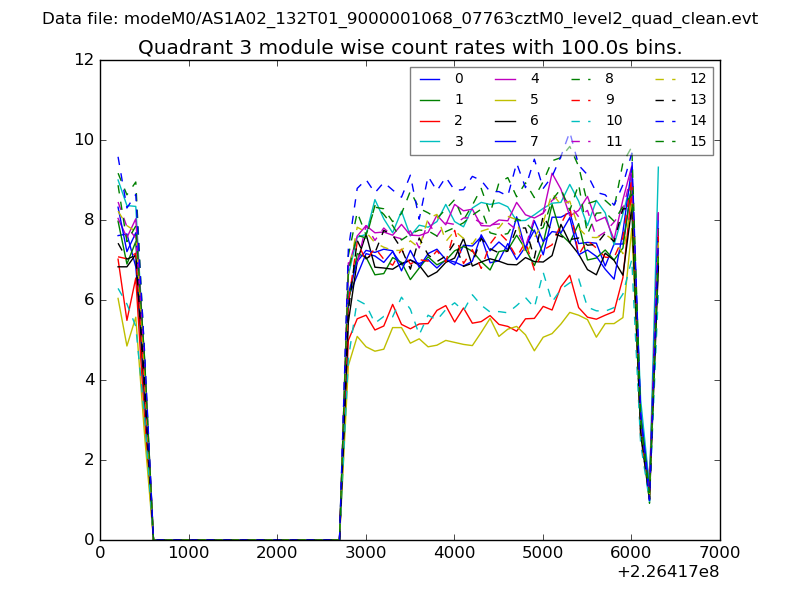 |
 |
| Parameter | Plot |
|---|---|
| CZT HV Monitor | 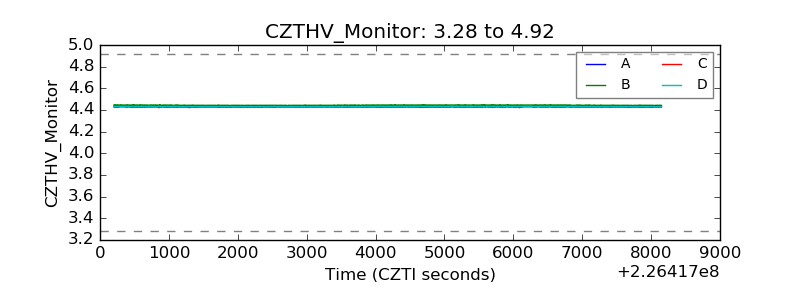 |
| D_VDD |  |
| Temperature 1 | 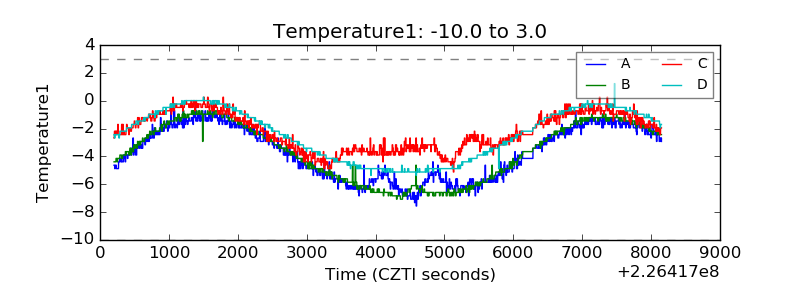 |
| Veto HV Monitor | 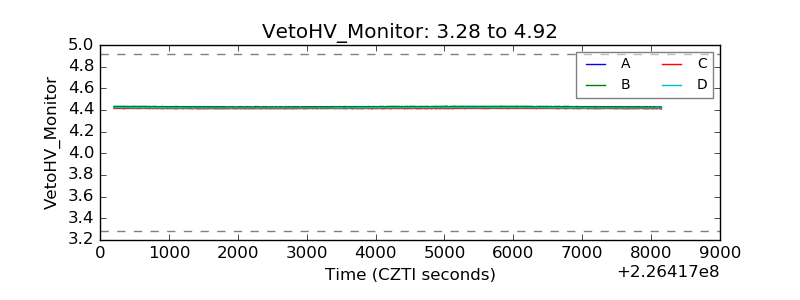 |
| Veto LLD | 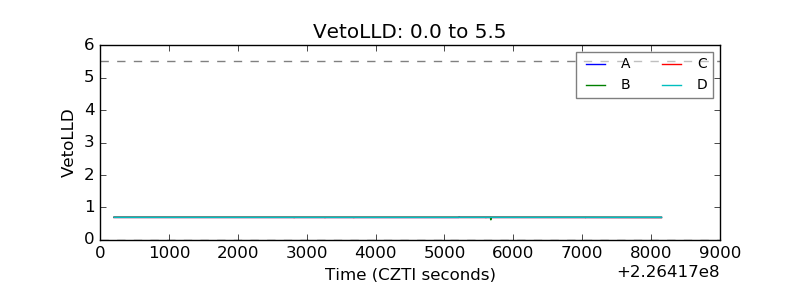 |
| Alpha Counter |  |
| _CPM_Rate | 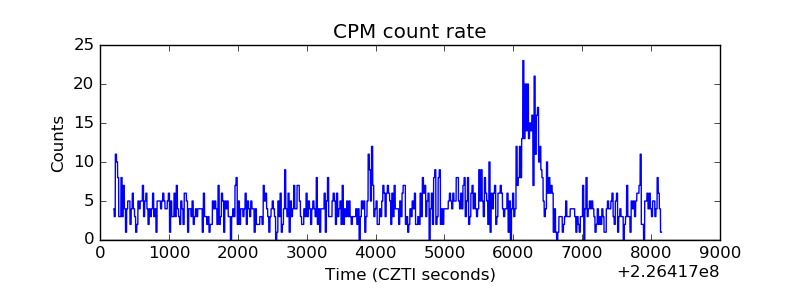 |
| CZT Counter | 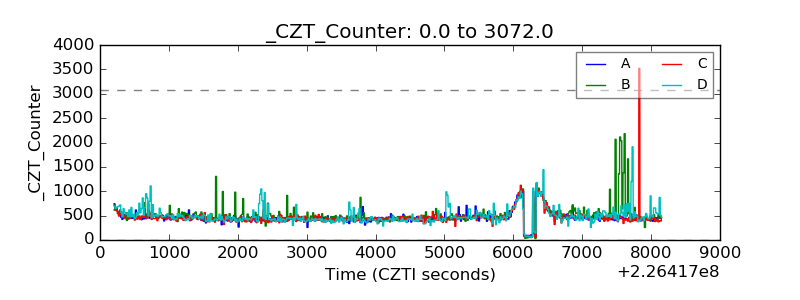 |
| +2.5 Volts monitor |  |
| +5 Volts monitor |  |
| _ROLL_ROT | 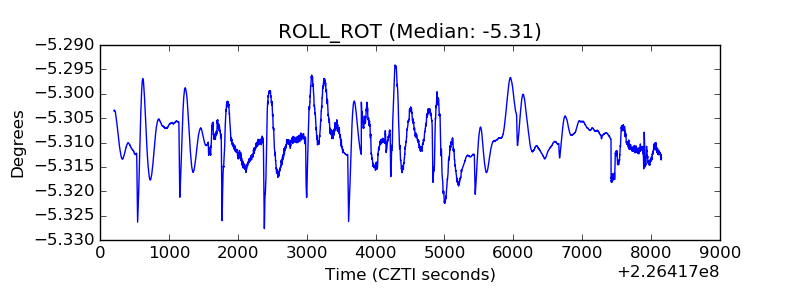 |
| _Roll_DEC | 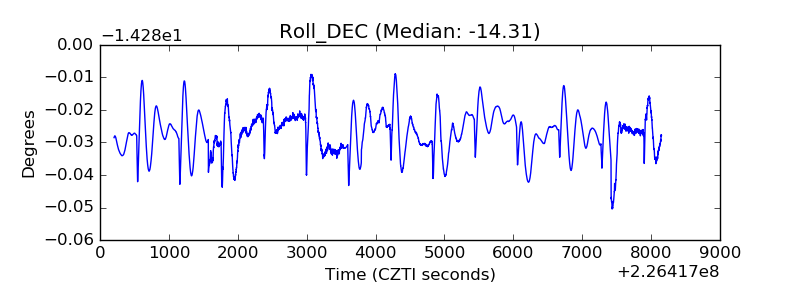 |
| _Roll_RA | 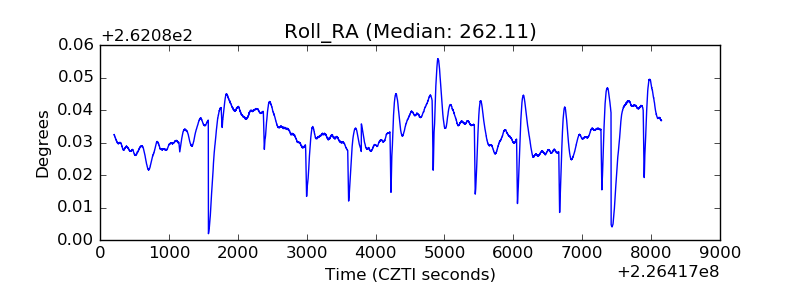 |
| Veto Counter | 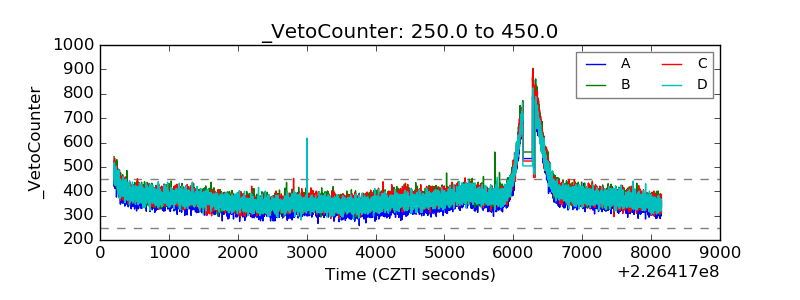 |