| Param | Original file | Final file |
|---|---|---|
| Filename | modeM0/AS1A02_132T01_9000001068_07766cztM0_level2.evt | modeM0/AS1A02_132T01_9000001068_07766cztM0_level2_quad_clean.evt |
| Size (bytes) | 1,160,308,800 | 209,511,360 |
| Size | 1.1 GB | 199.8 MB |
| Events in quadrant A | 7,882,593 | 1,293,309 |
| Events in quadrant B | 8,518,780 | 1,310,140 |
| Events in quadrant C | 7,836,919 | 1,312,974 |
| Events in quadrant D | 9,736,990 | 1,242,001 |
| Mode M0 | |||
|---|---|---|---|
| Quadrant | BADHDUFLAG | Total packets | Discarded packets |
| A | 0 | 35336 | 41 |
| B | 0 | 36793 | 25 |
| C | 0 | 35237 | 39 |
| D | 0 | 40835 | 70 |
| Mode SS | |||
|---|---|---|---|
| Quadrant | BADHDUFLAG | Total packets | Discarded packets |
| A | 0 | 350 | 2 |
| B | 0 | 350 | 0 |
| C | 0 | 350 | 0 |
| D | 0 | 350 | 0 |
| Mode M9 | |||
|---|---|---|---|
| Quadrant | BADHDUFLAG | Total packets | Discarded packets |
| A | 0 | 11 | 0 |
| B | 0 | 11 | 0 |
| C | 0 | 11 | 0 |
| D | 0 | 11 | 0 |
| Quadrant | Total seconds | Saturated seconds | Saturation percentage |
|---|---|---|---|
| A | 17217 | 230 | 1.335889% |
| B | 17224 | 347 | 2.014631% |
| C | 17217 | 139 | 0.807342% |
| D | 17215 | 321 | 1.864653% |
Noise dominated data is calculated using 1-second bins in cleaned event files. If a bin has >2000 counts, and if more than 50% of those come from <1% of pixels, then it is considered to be noise-dominated and hence unusable.
| Quadrant | # 1 sec bins | Bins with >0 counts | Bins with >2000 counts | High rate bins dominated by noise | Noise dominated (total time) | Noise dominated (detector-on time) | Marked lightcurve |
|---|---|---|---|---|---|---|---|
| A | 18280 | 17234 | 0 | 0 | 0.00% | 0.00% | 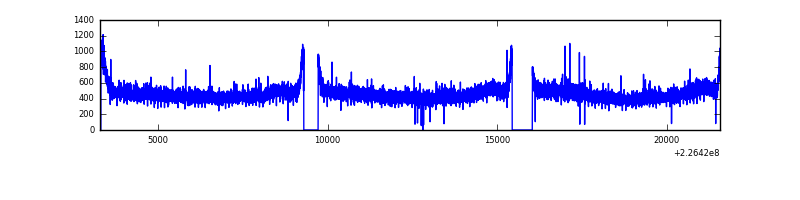 |
| B | 18280 | 17235 | 73 | 73 | 0.40% | 0.42% | 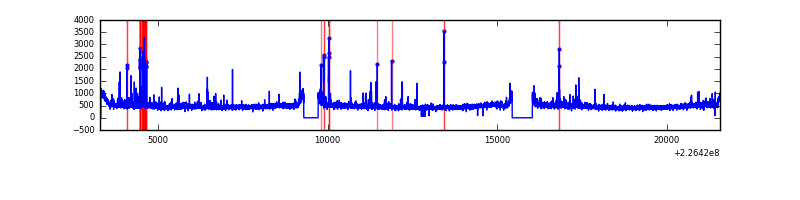 |
| C | 18279 | 17235 | 0 | 0 | 0.00% | 0.00% | 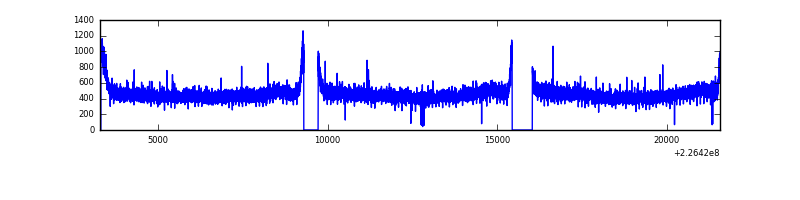 |
| D | 18280 | 17236 | 119 | 119 | 0.65% | 0.69% |  |
Top three noisy pixels from each quadrant. If the there are fewer than three noisy pixels in the level2.evt file, extra rows are filled as -1
| Pixel properties | Quadrant properties | ||||||
|---|---|---|---|---|---|---|---|
| Quadrant | DetID | PixID | Counts | Sigma | Mean | Median | Sigma |
| A | 0 | 226 | 19260 | 41.4 | 2039 | 1991 | 417.2 |
| A | 12 | 194 | 18270 | 39.02 | 2039 | 1991 | 417.2 |
| A | 8 | 4 | 13806 | 28.32 | 2039 | 1991 | 417.2 |
| B | 0 | 229 | 193084 | 488.27 | 2049 | 2002 | 391.3 |
| B | 4 | 173 | 100923 | 252.77 | 2049 | 2002 | 391.3 |
| B | 4 | 239 | 69736 | 173.08 | 2049 | 2002 | 391.3 |
| C | 13 | 61 | 15618 | 29.2 | 1997 | 2007 | 466.1 |
| C | 8 | 128 | 13411 | 24.47 | 1997 | 2007 | 466.1 |
| C | 12 | 4 | 12408 | 22.32 | 1997 | 2007 | 466.1 |
| D | 2 | 152 | 1141002 | 2347.15 | 1980 | 1917 | 485.3 |
| D | 12 | 221 | 440544 | 903.82 | 1980 | 1917 | 485.3 |
| D | 1 | 52 | 394883 | 809.73 | 1980 | 1917 | 485.3 |
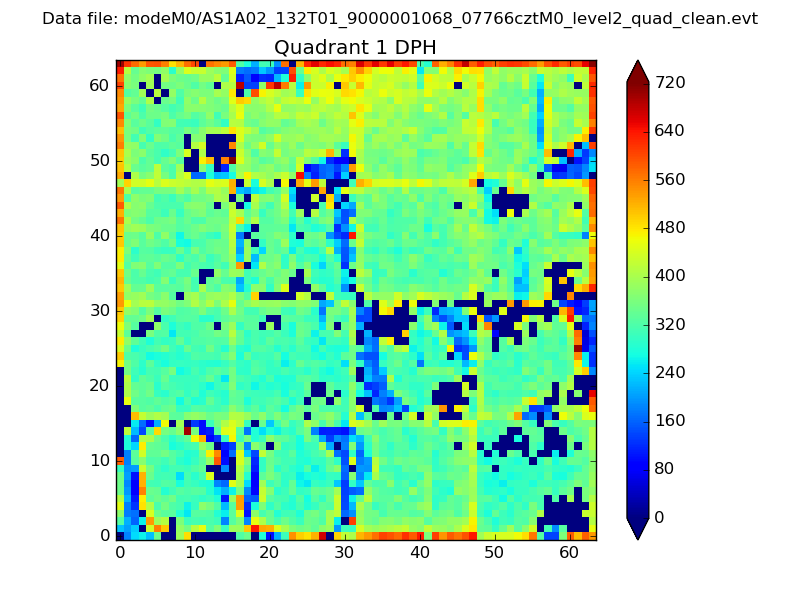
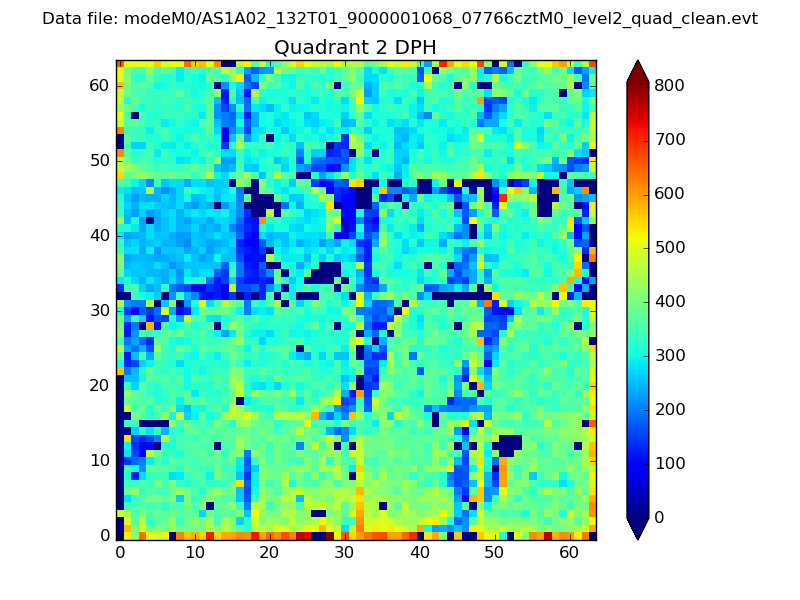
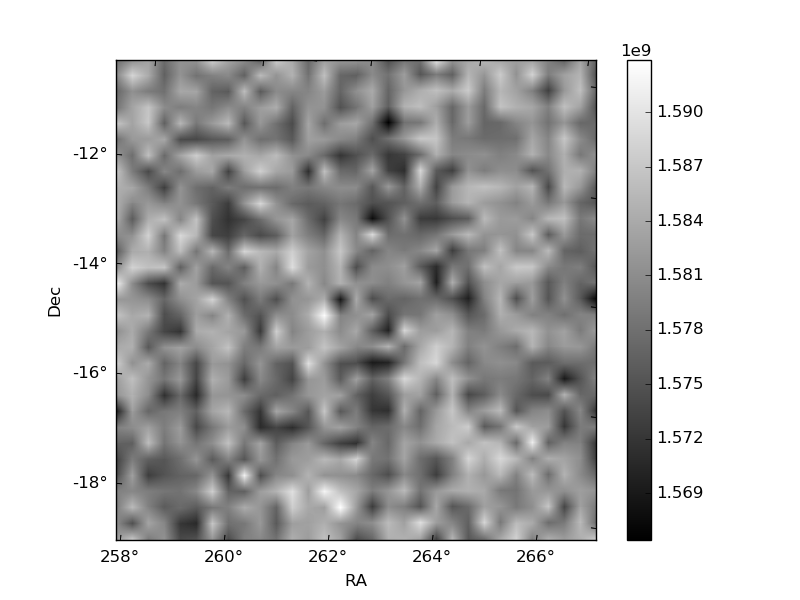
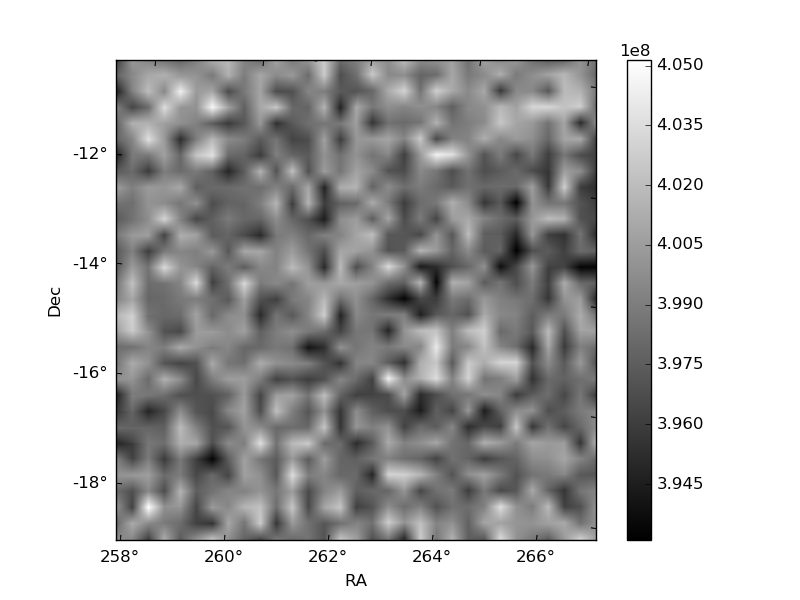
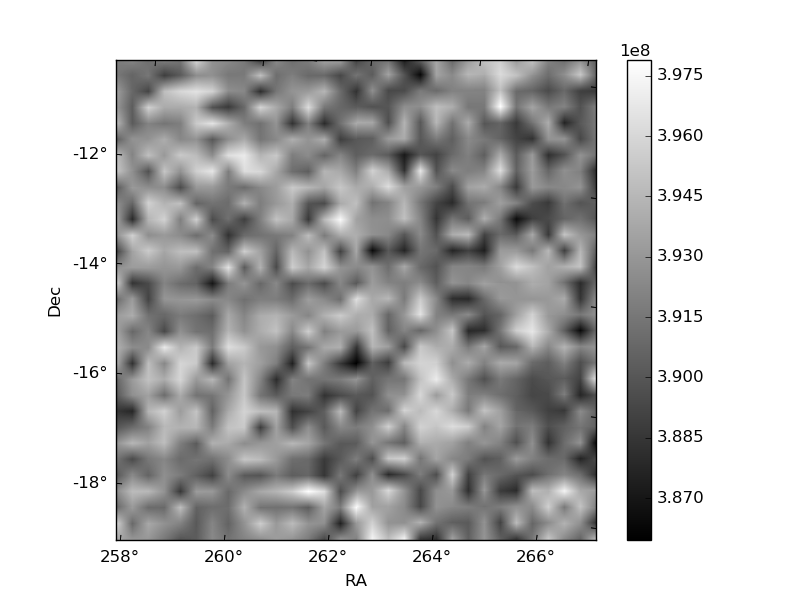
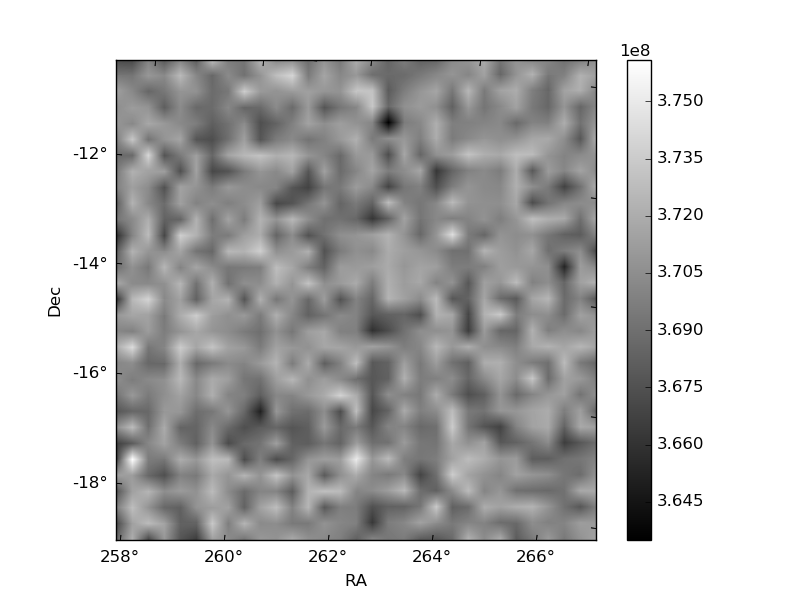
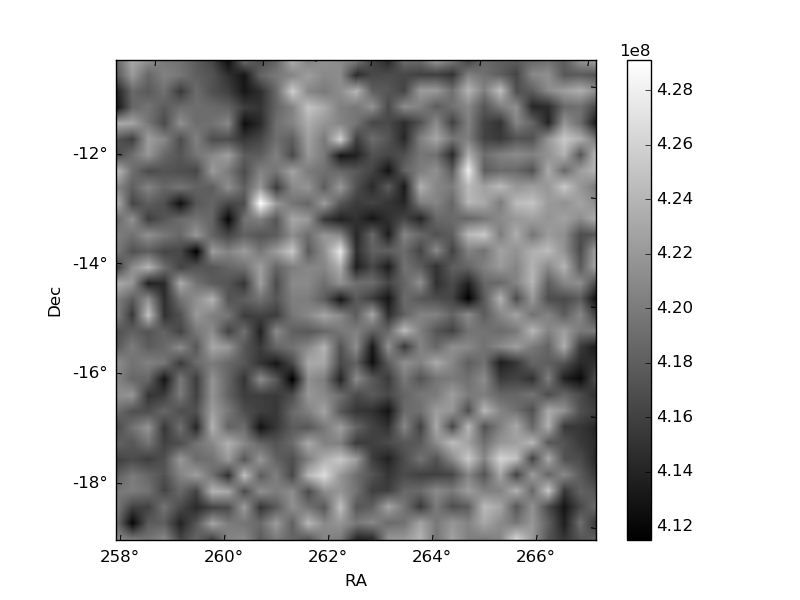
Histogram calculated using DETX and DETY for each event in the final _common_clean file
| Quadrant A | 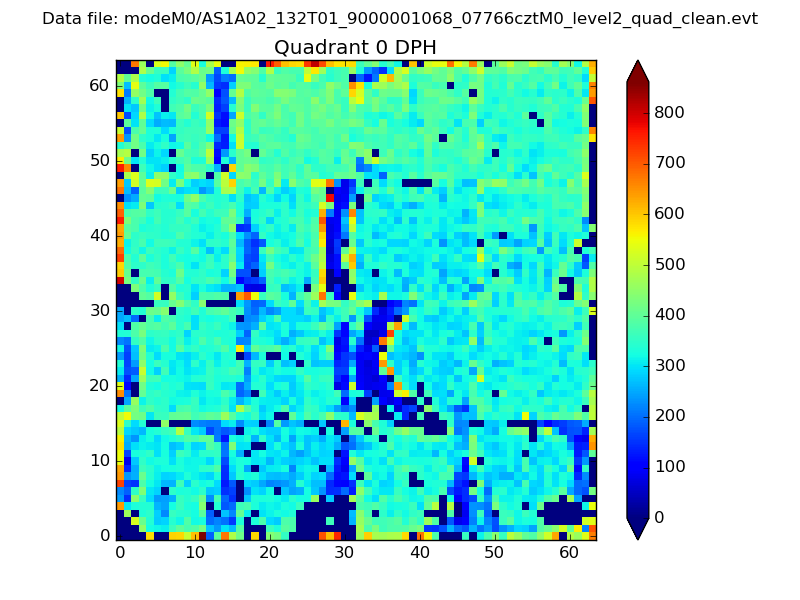 |
 |
Quadrant B |
|---|---|---|---|
| Quadrant D | 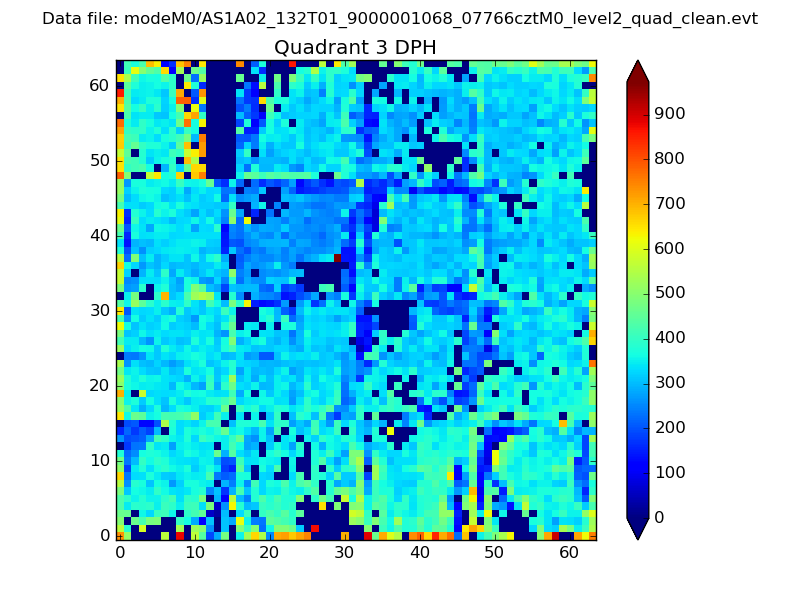 |
 |
Quadrant C |
| Plot type | Count rate plots | Images |
|---|---|---|
| Comparison with Poisson distribution Blue bars denote a histogram of data divided into 1 sec bins. Red curve is a Poisson curve with rate = median count rate of data. |
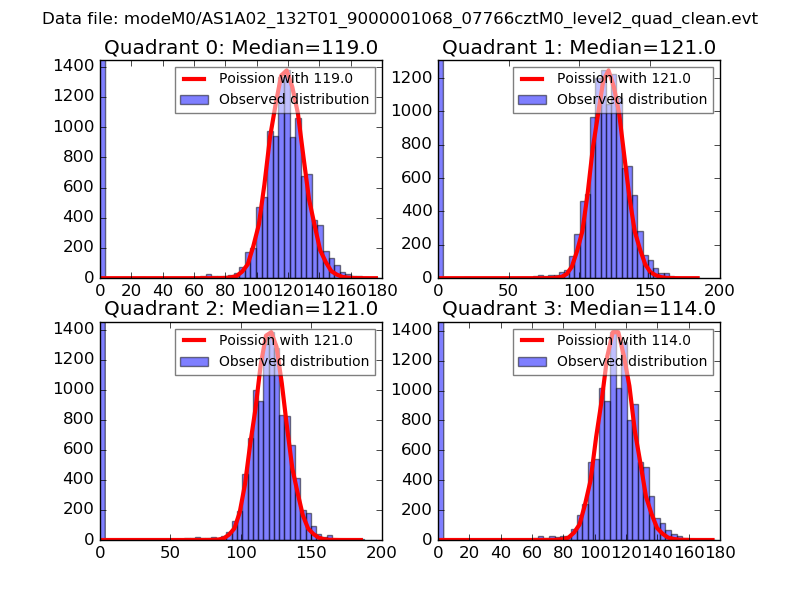 |
 |
| Quadrant-wise count rates Data is divided into 100 sec bins |
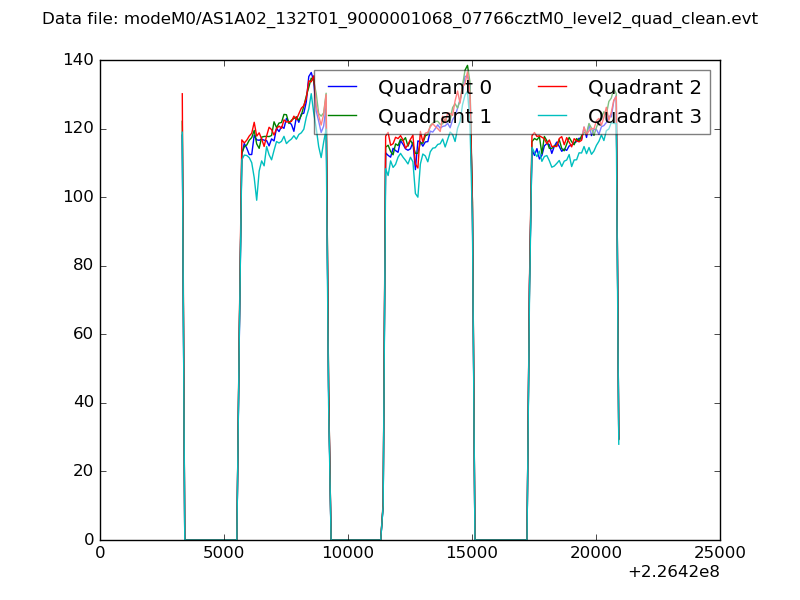 |
|
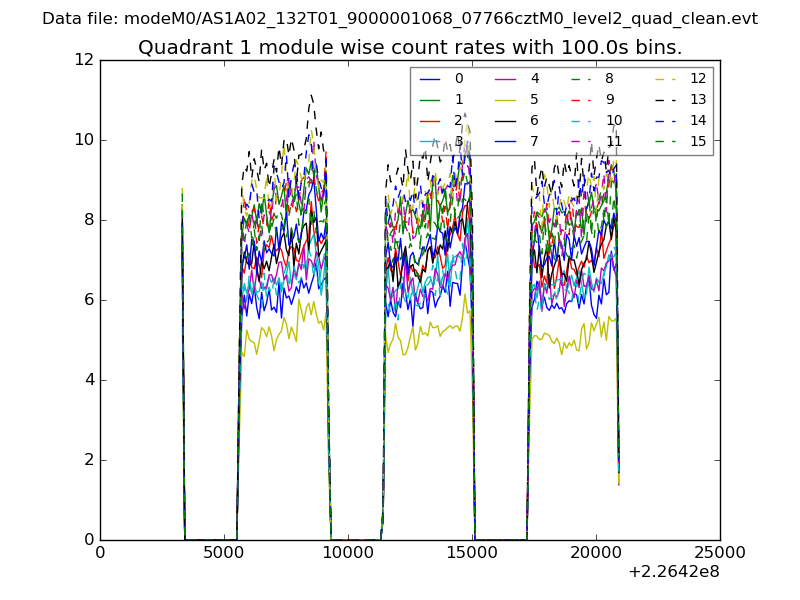
| Module-wise count rates for Quadrant A Data is divided into 100 sec bins |
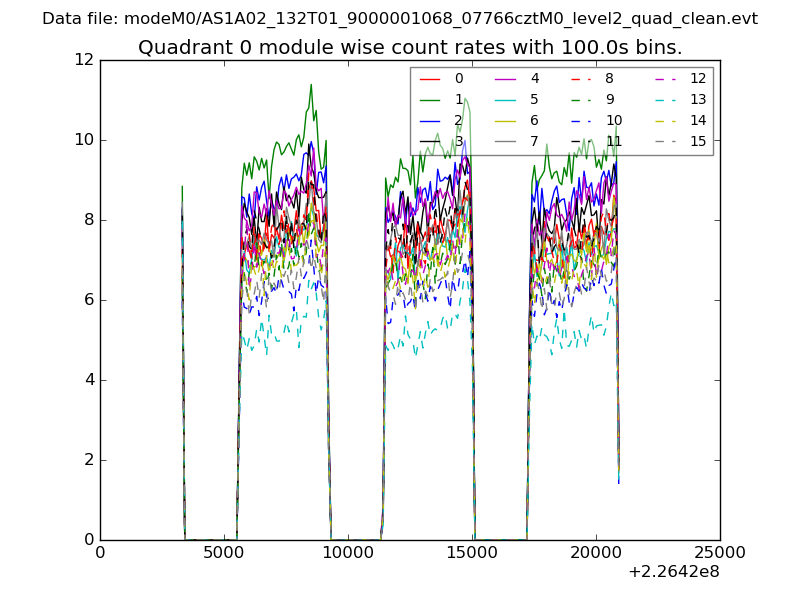 |
 |
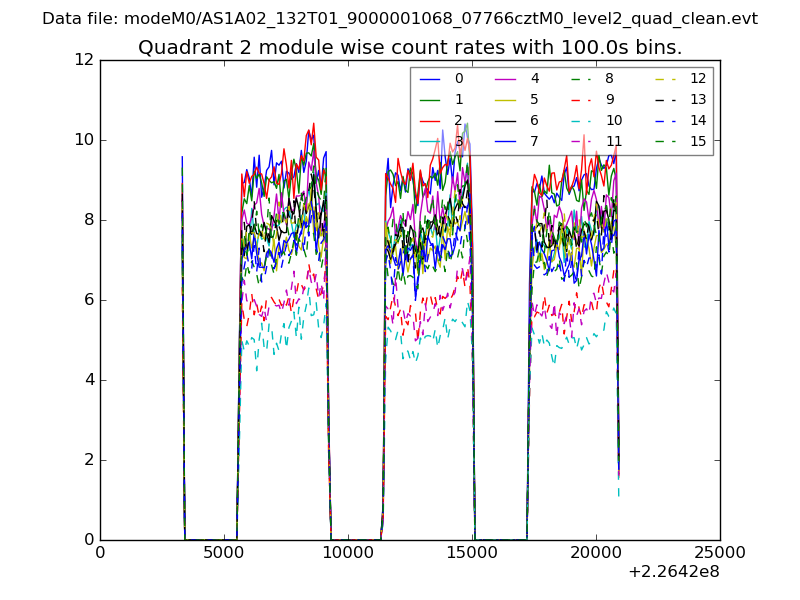
| Module-wise count rates for Quadrant B Data is divided into 100 sec bins |
 |
 |
| Module-wise count rates for Quadrant C Data is divided into 100 sec bins |
 |
 |
| Module-wise count rates for Quadrant D Data is divided into 100 sec bins |
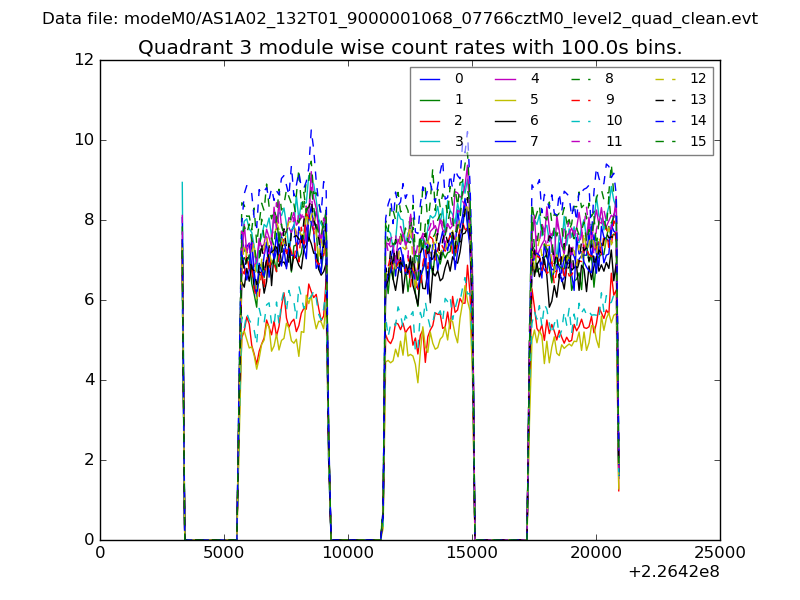 |
 |
| Parameter | Plot |
|---|---|
| CZT HV Monitor | 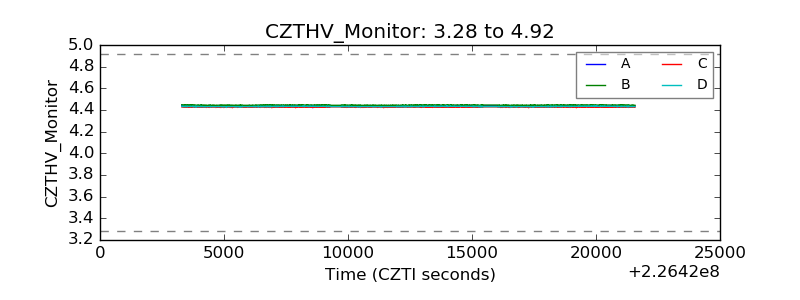 |
| D_VDD | 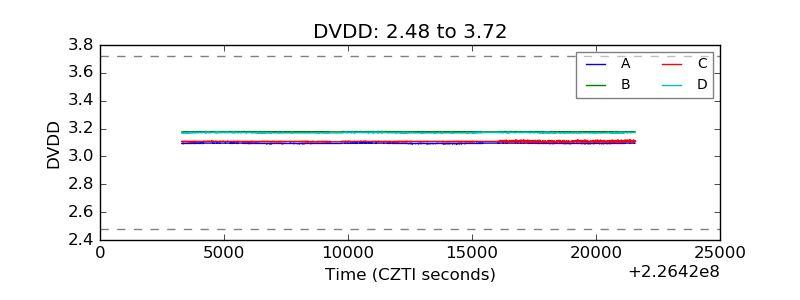 |
| Temperature 1 | 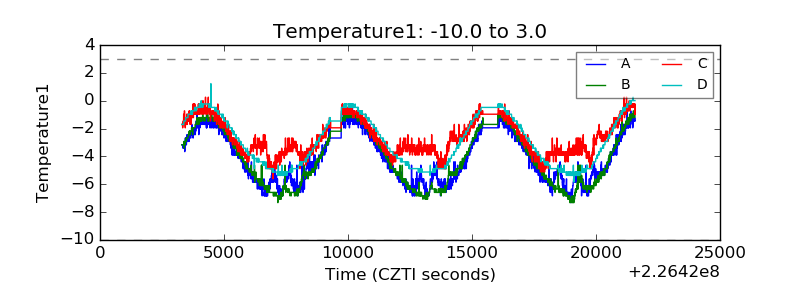 |
| Veto HV Monitor | 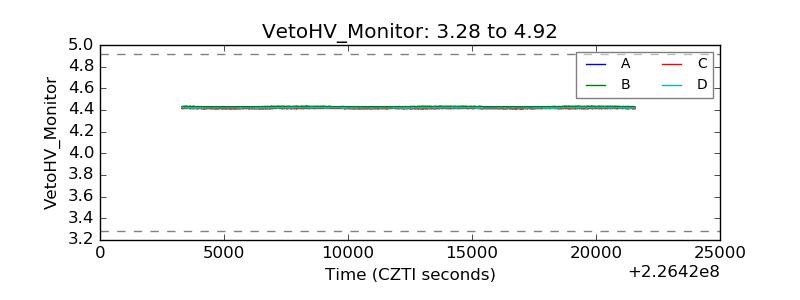 |
| Veto LLD | 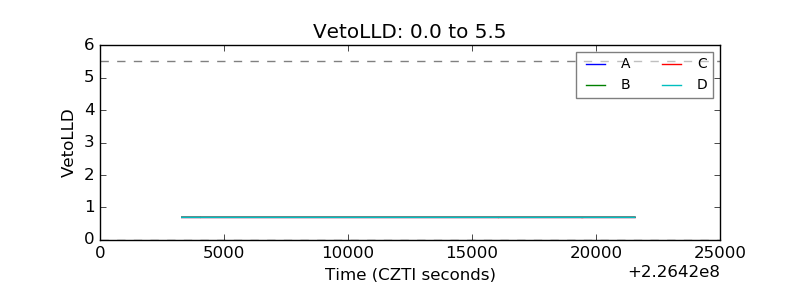 |
| Alpha Counter | 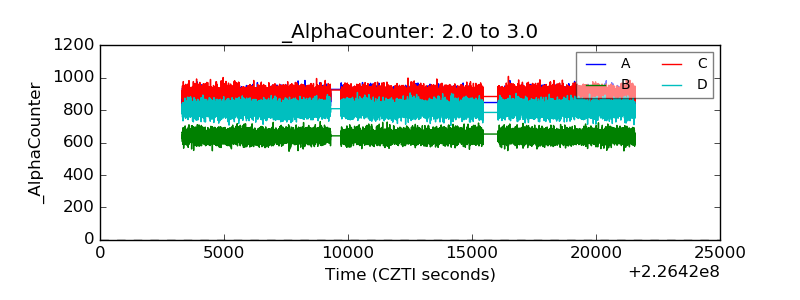 |
| _CPM_Rate | 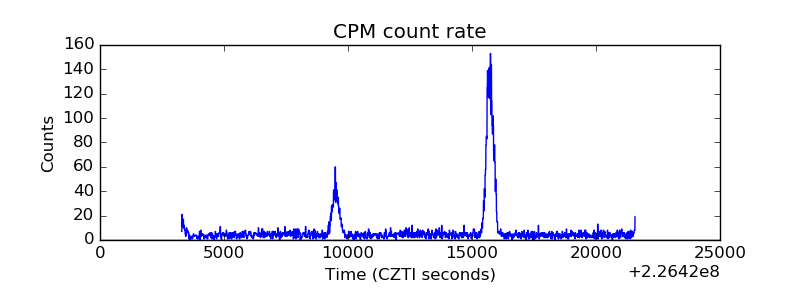 |
| CZT Counter | 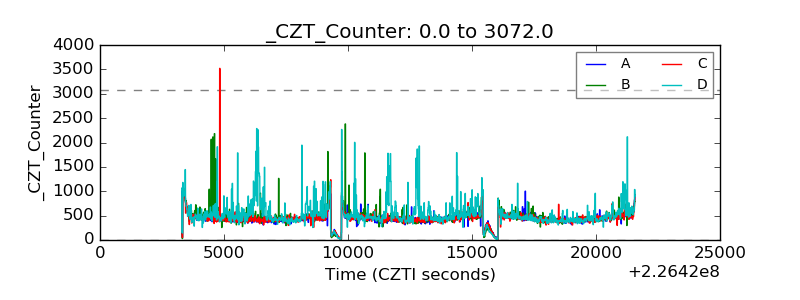 |
| +2.5 Volts monitor |  |
| +5 Volts monitor |  |
| _ROLL_ROT | 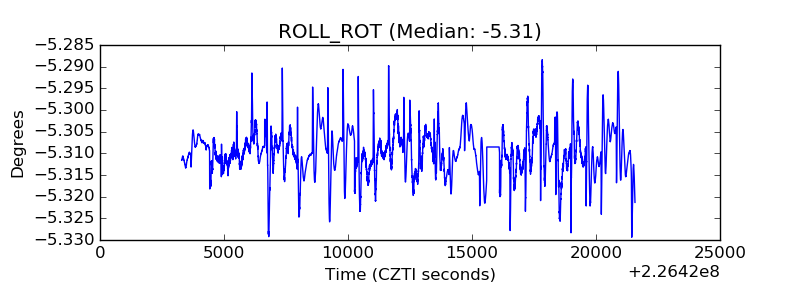 |
| _Roll_DEC | 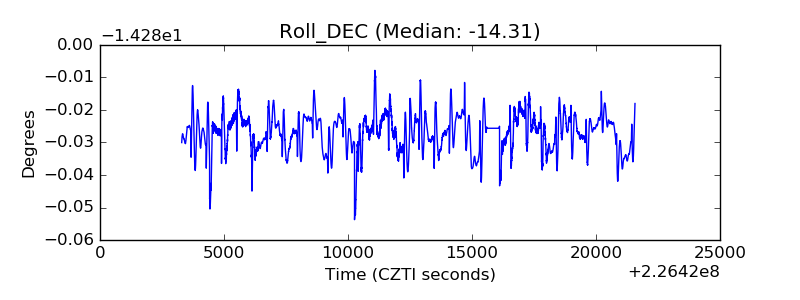 |
| _Roll_RA | 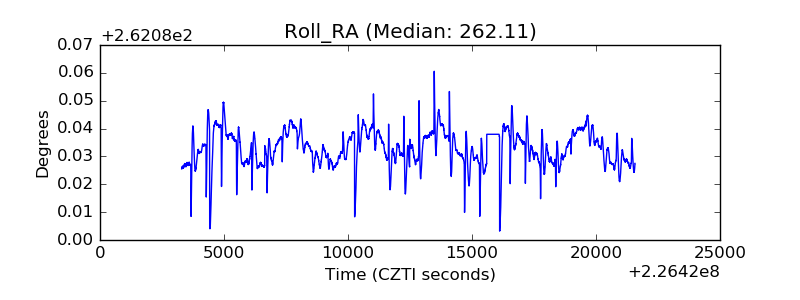 |
| Veto Counter | 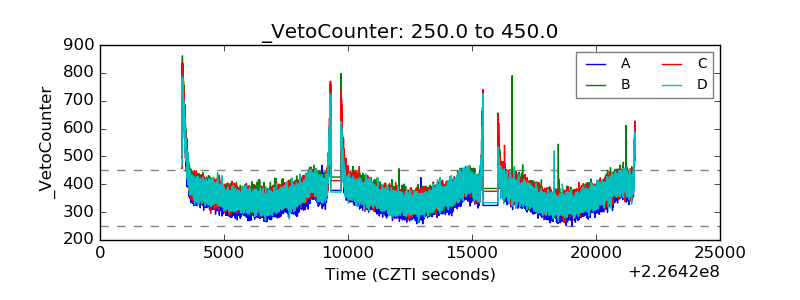 |