| Param | Original file | Final file |
|---|---|---|
| Filename | modeM0/AS1A02_132T01_9000001068_07767cztM0_level2.evt | modeM0/AS1A02_132T01_9000001068_07767cztM0_level2_quad_clean.evt |
| Size (bytes) | 493,848,000 | 87,632,640 |
| Size | 471.0 MB | 83.6 MB |
| Events in quadrant A | 3,478,129 | 535,135 |
| Events in quadrant B | 3,645,266 | 547,766 |
| Events in quadrant C | 3,381,371 | 545,308 |
| Events in quadrant D | 3,953,506 | 515,232 |
| Mode M0 | |||
|---|---|---|---|
| Quadrant | BADHDUFLAG | Total packets | Discarded packets |
| A | 0 | 15188 | 3 |
| B | 0 | 15577 | 2 |
| C | 0 | 14922 | 2 |
| D | 0 | 16779 | 2 |
| Mode SS | |||
|---|---|---|---|
| Quadrant | BADHDUFLAG | Total packets | Discarded packets |
| A | 0 | 150 | 0 |
| B | 0 | 150 | 0 |
| C | 0 | 150 | 0 |
| D | 0 | 150 | 0 |
| Mode M9 | |||
|---|---|---|---|
| Quadrant | BADHDUFLAG | Total packets | Discarded packets |
| A | 0 | 17 | 0 |
| B | 0 | 17 | 0 |
| C | 0 | 17 | 0 |
| D | 0 | 17 | 0 |
| Quadrant | Total seconds | Saturated seconds | Saturation percentage |
|---|---|---|---|
| A | 7333 | 64 | 0.872767% |
| B | 7333 | 75 | 1.022774% |
| C | 7333 | 39 | 0.531842% |
| D | 7333 | 122 | 1.663712% |
Noise dominated data is calculated using 1-second bins in cleaned event files. If a bin has >2000 counts, and if more than 50% of those come from <1% of pixels, then it is considered to be noise-dominated and hence unusable.
| Quadrant | # 1 sec bins | Bins with >0 counts | Bins with >2000 counts | High rate bins dominated by noise | Noise dominated (total time) | Noise dominated (detector-on time) | Marked lightcurve |
|---|---|---|---|---|---|---|---|
| A | 9028 | 7334 | 2 | 2 | 0.02% | 0.03% | 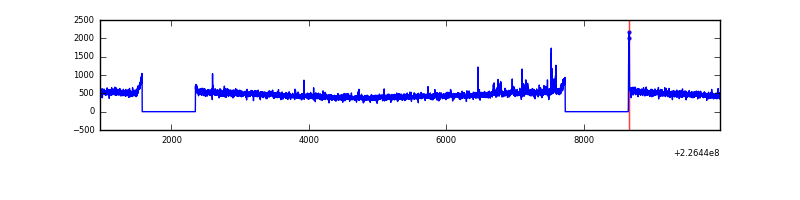 |
| B | 9028 | 7334 | 7 | 7 | 0.08% | 0.10% | 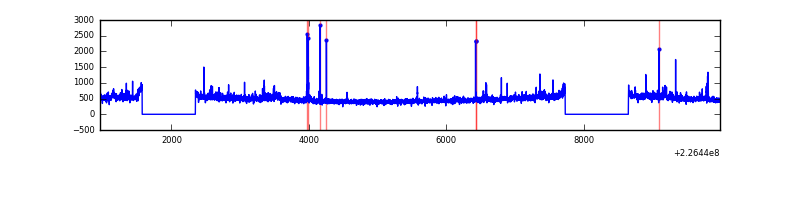 |
| C | 9028 | 7334 | 0 | 0 | 0.00% | 0.00% | 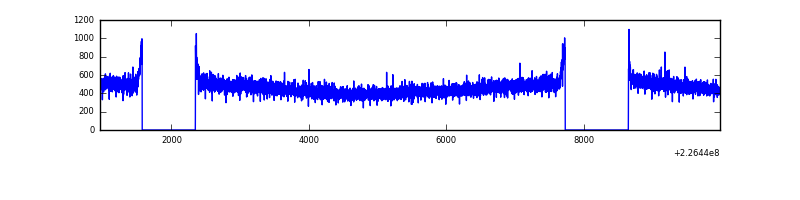 |
| D | 9028 | 7333 | 85 | 85 | 0.94% | 1.16% | 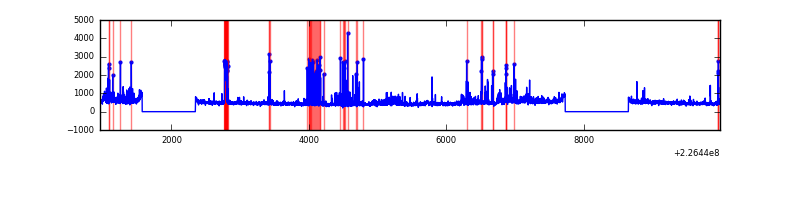 |
Top three noisy pixels from each quadrant. If the there are fewer than three noisy pixels in the level2.evt file, extra rows are filled as -1
| Pixel properties | Quadrant properties | ||||||
|---|---|---|---|---|---|---|---|
| Quadrant | DetID | PixID | Counts | Sigma | Mean | Median | Sigma |
| A | 8 | 6 | 61942 | 336.37 | 884 | 864 | 181.6 |
| A | 0 | 226 | 8316 | 41.04 | 884 | 864 | 181.6 |
| A | 12 | 194 | 7818 | 38.3 | 884 | 864 | 181.6 |
| B | 4 | 239 | 49221 | 280.87 | 893 | 871 | 172.1 |
| B | 0 | 214 | 25094 | 140.71 | 893 | 871 | 172.1 |
| B | 0 | 219 | 25011 | 140.23 | 893 | 871 | 172.1 |
| C | 1 | 16 | 7873 | 34.6 | 864 | 870 | 202.4 |
| C | 13 | 61 | 6540 | 28.01 | 864 | 870 | 202.4 |
| C | 8 | 222 | 3181 | 11.42 | 864 | 870 | 202.4 |
| D | 2 | 152 | 356998 | 1689.9 | 857 | 831 | 210.8 |
| D | 1 | 52 | 244444 | 1155.86 | 857 | 831 | 210.8 |
| D | 12 | 233 | 42950 | 199.84 | 857 | 831 | 210.8 |
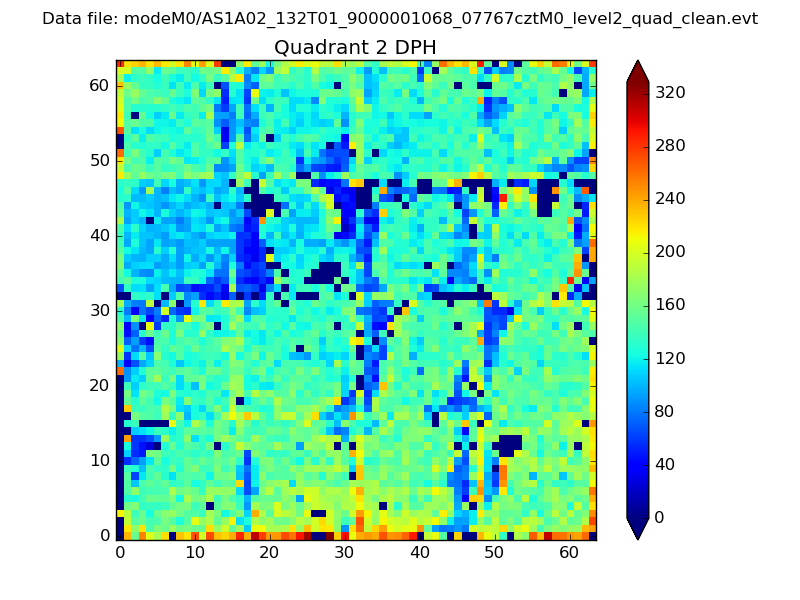
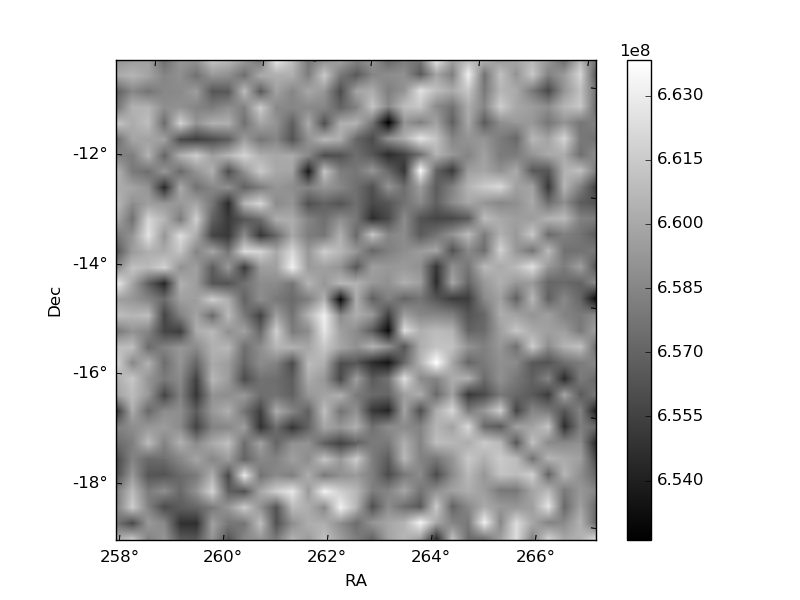
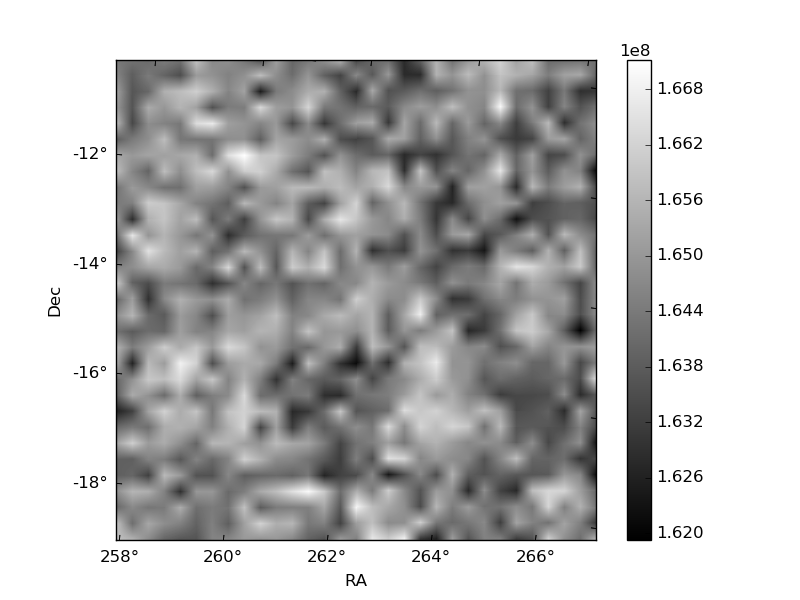
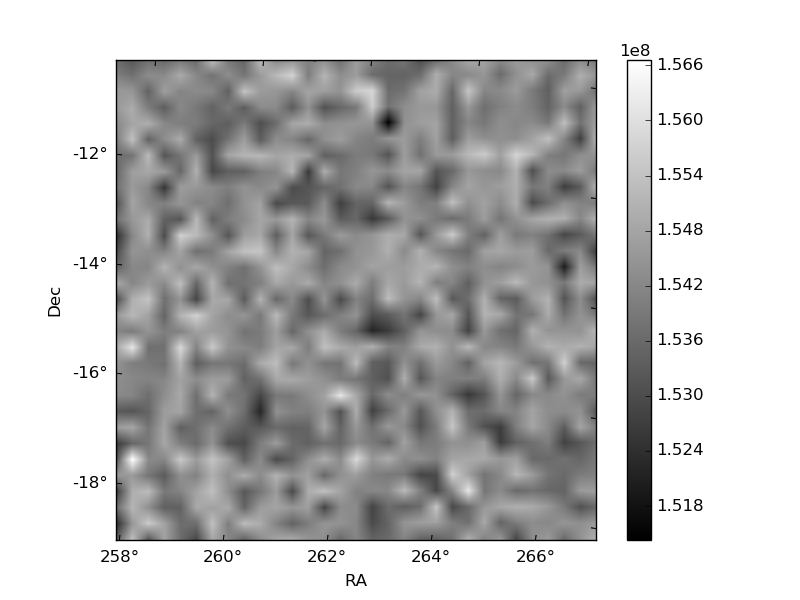
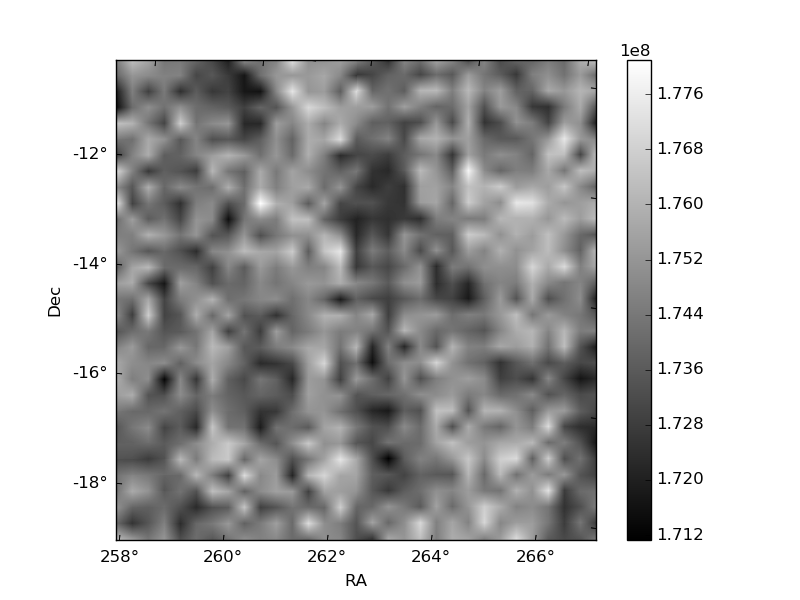
Histogram calculated using DETX and DETY for each event in the final _common_clean file
| Quadrant A | 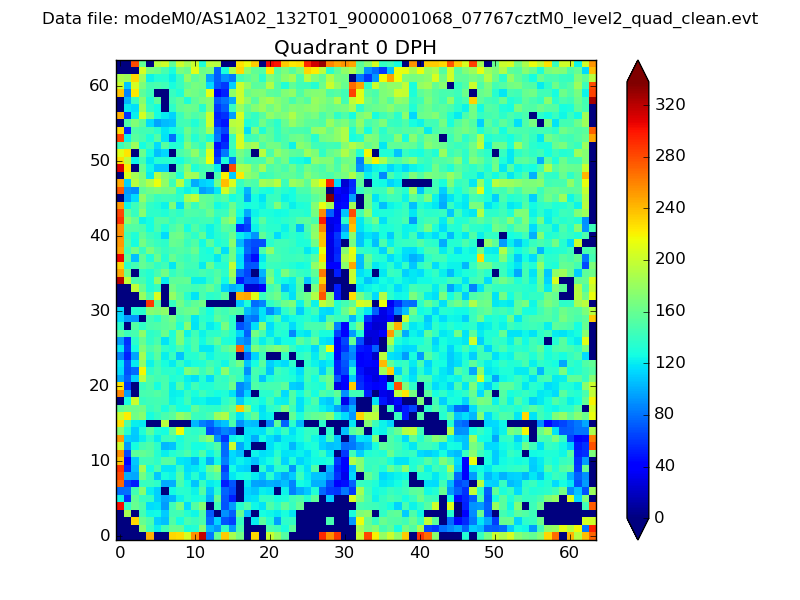 |
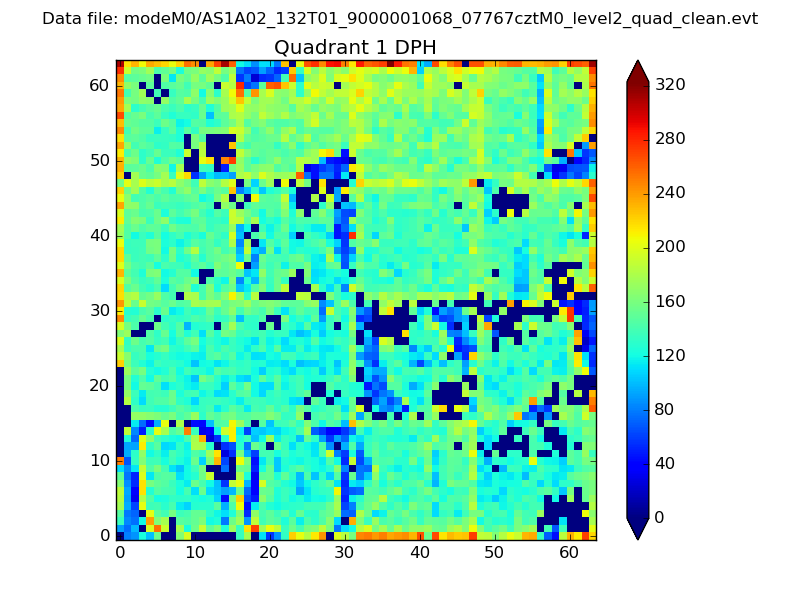 |
Quadrant B |
|---|---|---|---|
| Quadrant D | 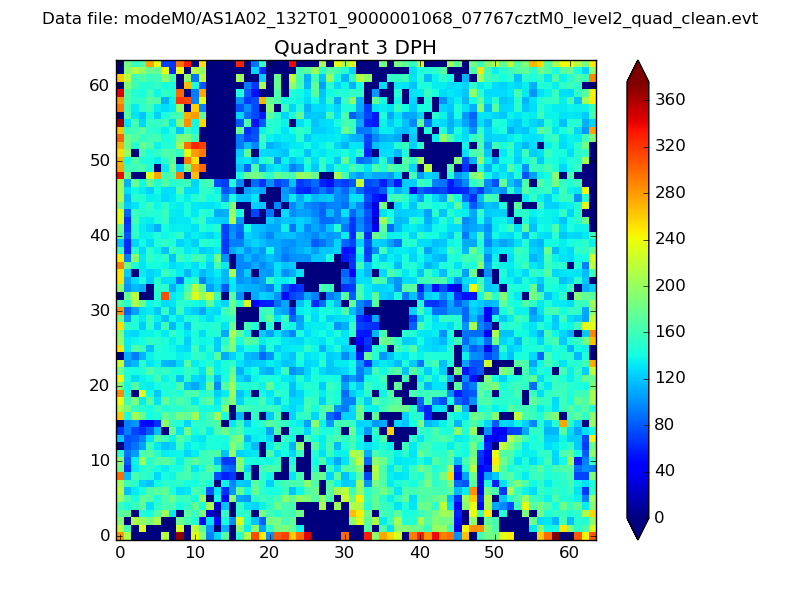 |
 |
Quadrant C |
| Plot type | Count rate plots | Images |
|---|---|---|
| Comparison with Poisson distribution Blue bars denote a histogram of data divided into 1 sec bins. Red curve is a Poisson curve with rate = median count rate of data. |
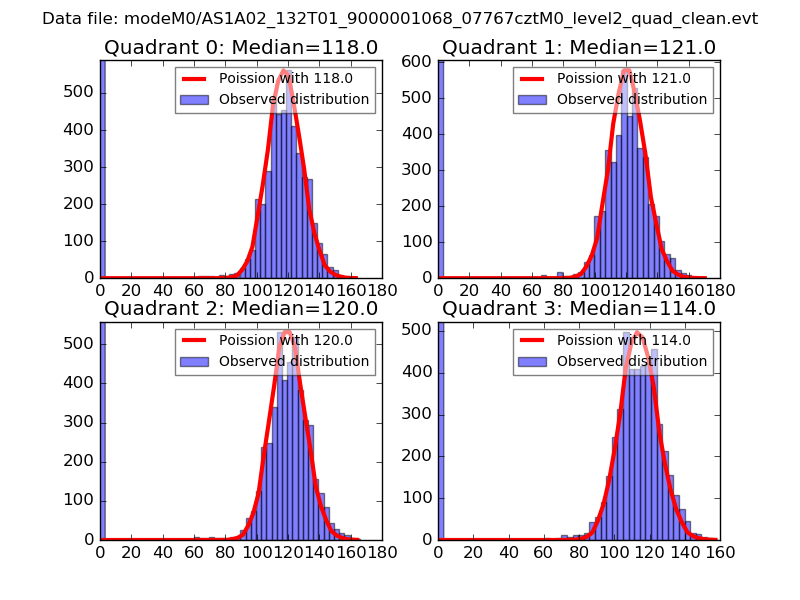 |
 |
| Quadrant-wise count rates Data is divided into 100 sec bins |
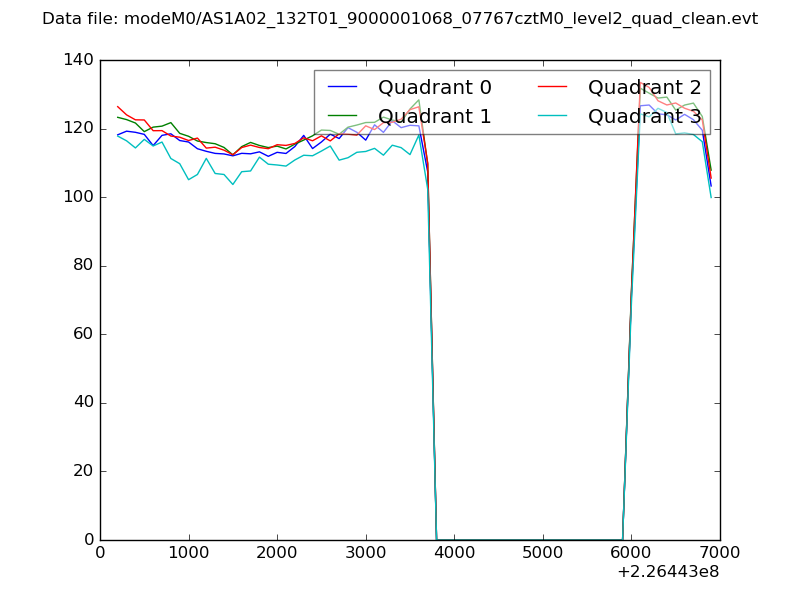 |
|
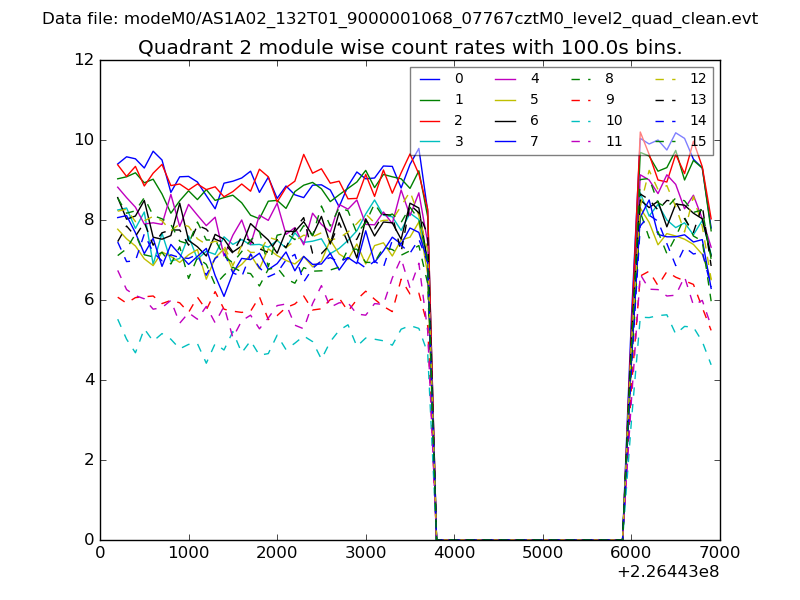
| Module-wise count rates for Quadrant A Data is divided into 100 sec bins |
 |
 |
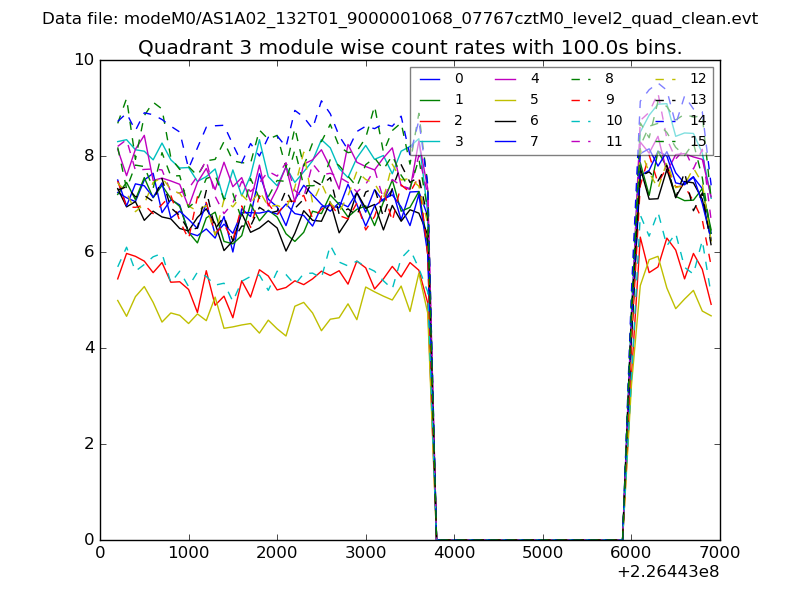
| Module-wise count rates for Quadrant B Data is divided into 100 sec bins |
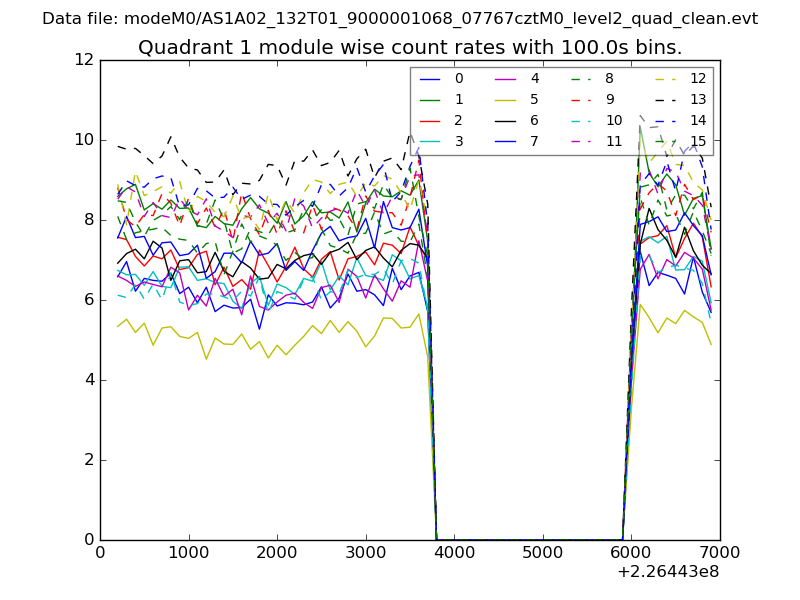 |
 |
| Module-wise count rates for Quadrant C Data is divided into 100 sec bins |
 |
 |
| Module-wise count rates for Quadrant D Data is divided into 100 sec bins |
 |
 |
| Parameter | Plot |
|---|---|
| CZT HV Monitor | 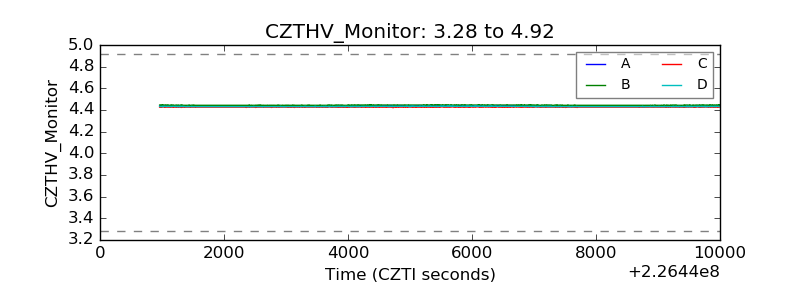 |
| D_VDD |  |
| Temperature 1 | 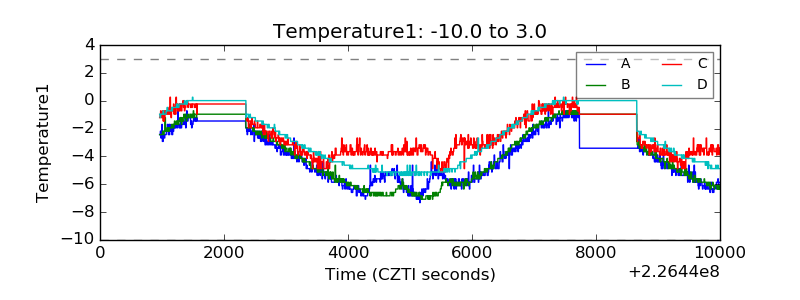 |
| Veto HV Monitor | 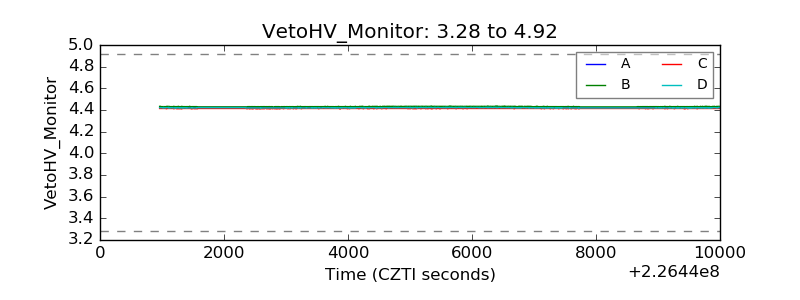 |
| Veto LLD | 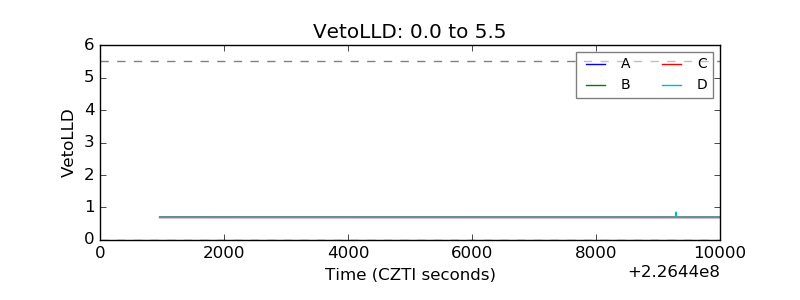 |
| Alpha Counter | 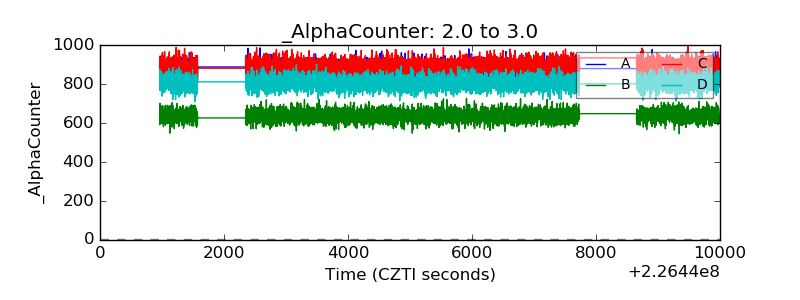 |
| _CPM_Rate | 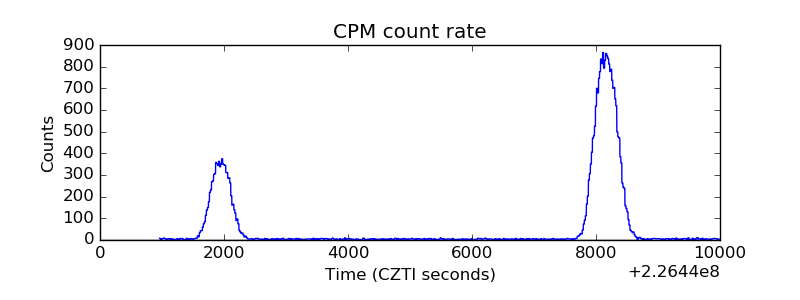 |
| CZT Counter | 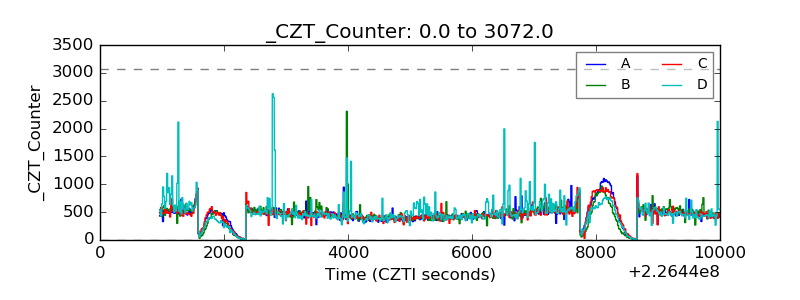 |
| +2.5 Volts monitor |  |
| +5 Volts monitor |  |
| _ROLL_ROT | 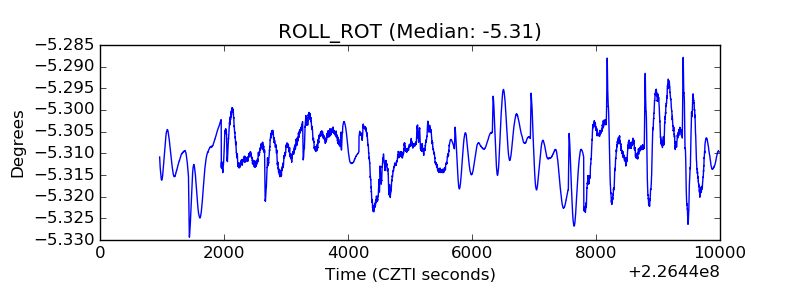 |
| _Roll_DEC |  |
| _Roll_RA | 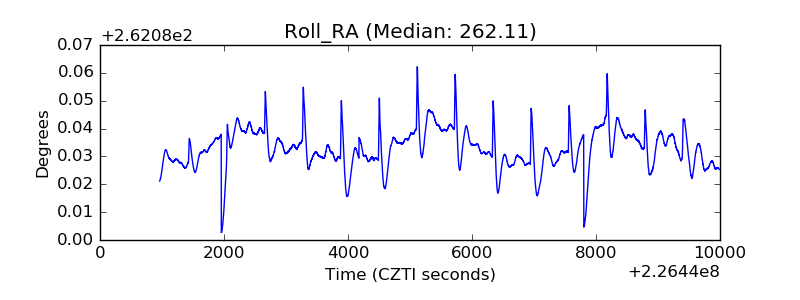 |
| Veto Counter | 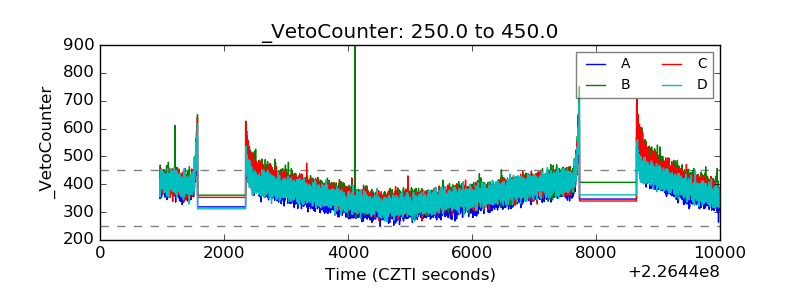 |